Carpatho Rusyn vs Immigrants from Somalia Disability Age 5 to 17
COMPARE
Carpatho Rusyn
Immigrants from Somalia
Disability Age 5 to 17
Disability Age 5 to 17 Comparison
Carpatho Rusyns
Immigrants from Somalia
6.3%
DISABILITY AGE 5 TO 17
0.0/ 100
METRIC RATING
300th/ 347
METRIC RANK
6.0%
DISABILITY AGE 5 TO 17
0.4/ 100
METRIC RATING
270th/ 347
METRIC RANK
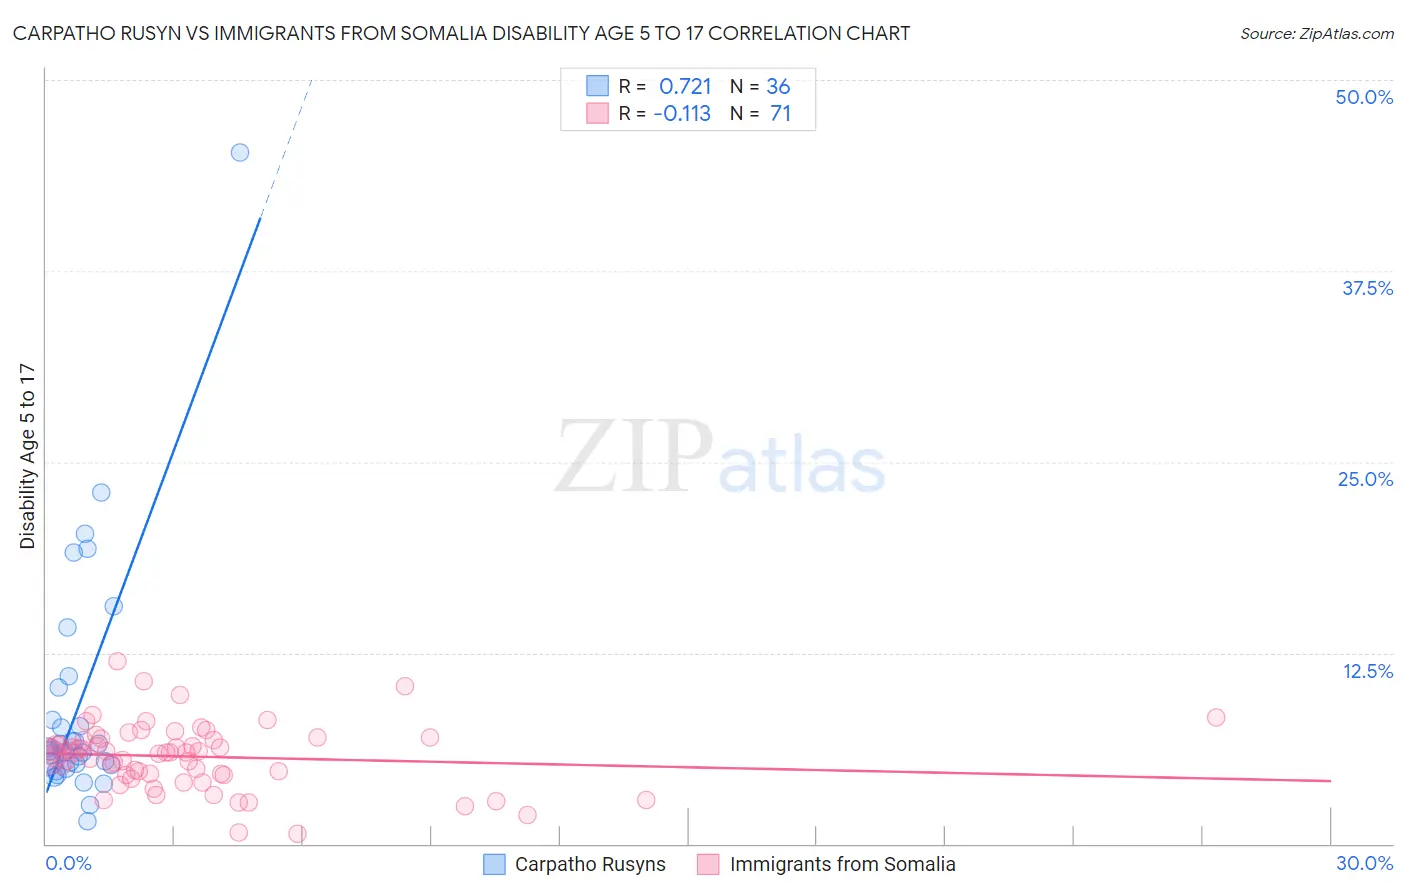
Carpatho Rusyn vs Immigrants from Somalia Disability Age 5 to 17 Correlation Chart
The statistical analysis conducted on geographies consisting of 58,826,840 people shows a strong positive correlation between the proportion of Carpatho Rusyns and percentage of population with a disability between the ages 5 and 17 in the United States with a correlation coefficient (R) of 0.721 and weighted average of 6.3%. Similarly, the statistical analysis conducted on geographies consisting of 92,029,922 people shows a poor negative correlation between the proportion of Immigrants from Somalia and percentage of population with a disability between the ages 5 and 17 in the United States with a correlation coefficient (R) of -0.113 and weighted average of 6.0%, a difference of 4.6%.
Disability Age 5 to 17 Correlation Summary
| Measurement | Carpatho Rusyn | Immigrants from Somalia |
| Minimum | 1.5% | 0.64% |
| Maximum | 45.2% | 12.0% |
| Range | 43.8% | 11.3% |
| Mean | 9.1% | 5.7% |
| Median | 6.1% | 6.0% |
| Interquartile 25% (IQ1) | 5.2% | 4.5% |
| Interquartile 75% (IQ3) | 9.1% | 6.9% |
| Interquartile Range (IQR) | 4.0% | 2.4% |
| Standard Deviation (Sample) | 8.1% | 2.1% |
| Standard Deviation (Population) | 8.0% | 2.1% |
Similar Demographics by Disability Age 5 to 17
Demographics Similar to Carpatho Rusyns by Disability Age 5 to 17
In terms of disability age 5 to 17, the demographic groups most similar to Carpatho Rusyns are U.S. Virgin Islander (6.3%, a difference of 0.020%), Welsh (6.3%, a difference of 0.12%), Lumbee (6.2%, a difference of 0.27%), Immigrants from Bahamas (6.2%, a difference of 0.34%), and Celtic (6.3%, a difference of 0.35%).
| Demographics | Rating | Rank | Disability Age 5 to 17 |
| Central American Indians | 0.0 /100 | #293 | Tragic 6.2% |
| Irish | 0.0 /100 | #294 | Tragic 6.2% |
| Cree | 0.0 /100 | #295 | Tragic 6.2% |
| Spanish Americans | 0.0 /100 | #296 | Tragic 6.2% |
| Immigrants | Bahamas | 0.0 /100 | #297 | Tragic 6.2% |
| Lumbee | 0.0 /100 | #298 | Tragic 6.2% |
| Welsh | 0.0 /100 | #299 | Tragic 6.3% |
| Carpatho Rusyns | 0.0 /100 | #300 | Tragic 6.3% |
| U.S. Virgin Islanders | 0.0 /100 | #301 | Tragic 6.3% |
| Celtics | 0.0 /100 | #302 | Tragic 6.3% |
| Yakama | 0.0 /100 | #303 | Tragic 6.3% |
| Senegalese | 0.0 /100 | #304 | Tragic 6.3% |
| Natives/Alaskans | 0.0 /100 | #305 | Tragic 6.3% |
| Immigrants | Nonimmigrants | 0.0 /100 | #306 | Tragic 6.3% |
| Bahamians | 0.0 /100 | #307 | Tragic 6.3% |
Demographics Similar to Immigrants from Somalia by Disability Age 5 to 17
In terms of disability age 5 to 17, the demographic groups most similar to Immigrants from Somalia are Liberian (6.0%, a difference of 0.19%), Sioux (6.0%, a difference of 0.22%), Spanish (6.0%, a difference of 0.41%), Slovene (6.0%, a difference of 0.52%), and Panamanian (6.0%, a difference of 0.55%).
| Demographics | Rating | Rank | Disability Age 5 to 17 |
| Czechoslovakians | 0.7 /100 | #263 | Tragic 5.9% |
| Canadians | 0.6 /100 | #264 | Tragic 6.0% |
| Panamanians | 0.6 /100 | #265 | Tragic 6.0% |
| Slovenes | 0.6 /100 | #266 | Tragic 6.0% |
| Spanish | 0.5 /100 | #267 | Tragic 6.0% |
| Sioux | 0.4 /100 | #268 | Tragic 6.0% |
| Liberians | 0.4 /100 | #269 | Tragic 6.0% |
| Immigrants | Somalia | 0.4 /100 | #270 | Tragic 6.0% |
| Immigrants | Zaire | 0.2 /100 | #271 | Tragic 6.0% |
| Finns | 0.2 /100 | #272 | Tragic 6.0% |
| Alaska Natives | 0.2 /100 | #273 | Tragic 6.0% |
| Cheyenne | 0.2 /100 | #274 | Tragic 6.0% |
| Dutch | 0.2 /100 | #275 | Tragic 6.0% |
| Japanese | 0.1 /100 | #276 | Tragic 6.1% |
| Puget Sound Salish | 0.1 /100 | #277 | Tragic 6.1% |