Inupiat vs Native Hawaiian Disability Age 5 to 17
COMPARE
Inupiat
Native Hawaiian
Disability Age 5 to 17
Disability Age 5 to 17 Comparison
Inupiat
Native Hawaiians
5.7%
DISABILITY AGE 5 TO 17
23.3/ 100
METRIC RATING
196th/ 347
METRIC RANK
5.2%
DISABILITY AGE 5 TO 17
99.6/ 100
METRIC RATING
81st/ 347
METRIC RANK
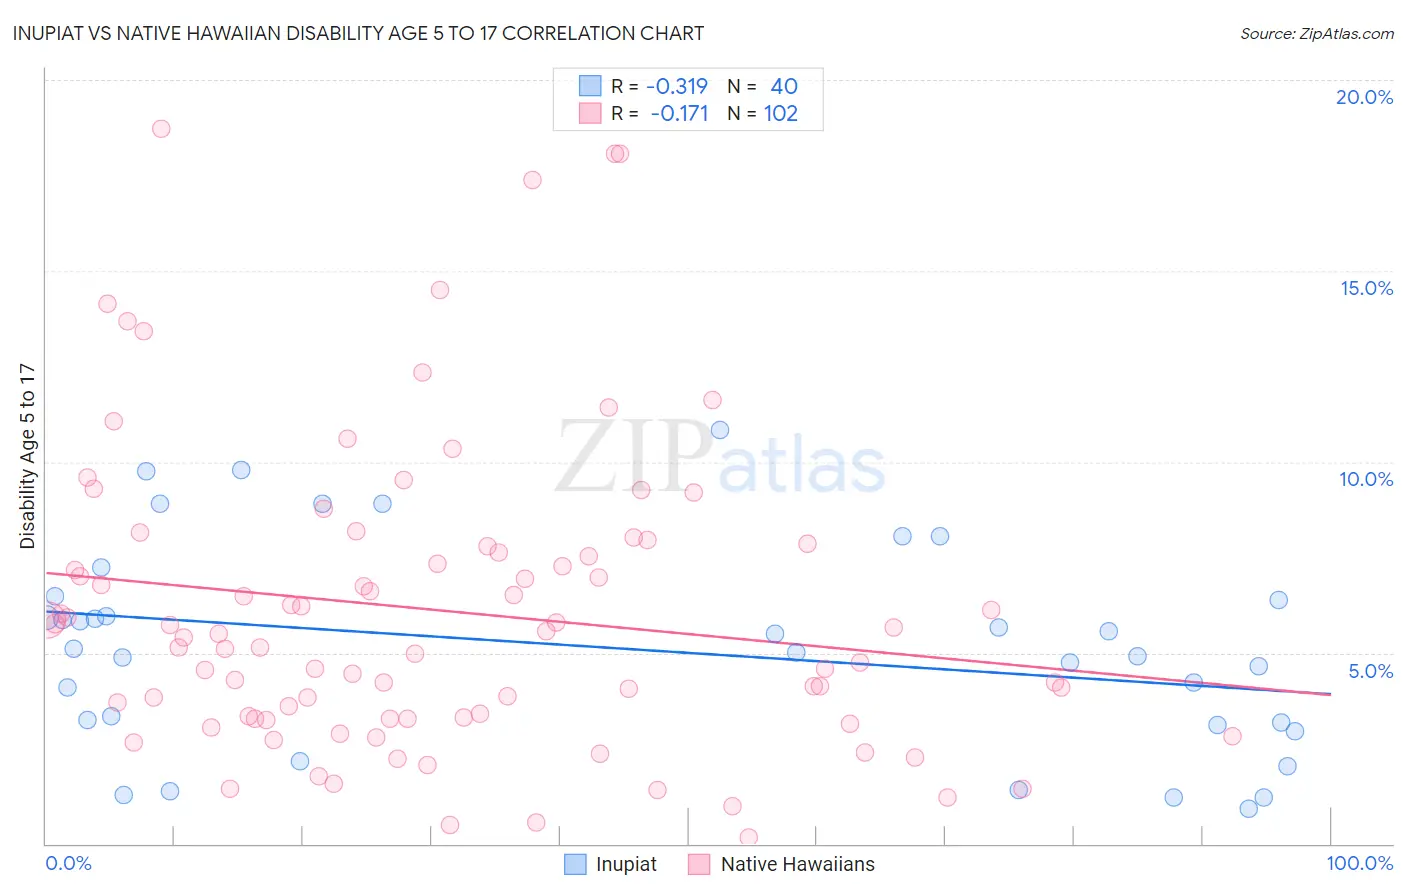
Inupiat vs Native Hawaiian Disability Age 5 to 17 Correlation Chart
The statistical analysis conducted on geographies consisting of 96,104,809 people shows a mild negative correlation between the proportion of Inupiat and percentage of population with a disability between the ages 5 and 17 in the United States with a correlation coefficient (R) of -0.319 and weighted average of 5.7%. Similarly, the statistical analysis conducted on geographies consisting of 329,860,359 people shows a poor negative correlation between the proportion of Native Hawaiians and percentage of population with a disability between the ages 5 and 17 in the United States with a correlation coefficient (R) of -0.171 and weighted average of 5.2%, a difference of 8.7%.
Disability Age 5 to 17 Correlation Summary
| Measurement | Inupiat | Native Hawaiian |
| Minimum | 0.93% | 0.15% |
| Maximum | 10.8% | 18.7% |
| Range | 9.9% | 18.6% |
| Mean | 5.1% | 6.1% |
| Median | 5.1% | 5.4% |
| Interquartile 25% (IQ1) | 3.2% | 3.3% |
| Interquartile 75% (IQ3) | 6.4% | 7.8% |
| Interquartile Range (IQR) | 3.3% | 4.5% |
| Standard Deviation (Sample) | 2.7% | 4.0% |
| Standard Deviation (Population) | 2.6% | 4.0% |
Similar Demographics by Disability Age 5 to 17
Demographics Similar to Inupiat by Disability Age 5 to 17
In terms of disability age 5 to 17, the demographic groups most similar to Inupiat are Immigrants from Nigeria (5.7%, a difference of 0.010%), Immigrants from North America (5.7%, a difference of 0.010%), Croatian (5.7%, a difference of 0.020%), Norwegian (5.7%, a difference of 0.17%), and Immigrants from Canada (5.7%, a difference of 0.18%).
| Demographics | Rating | Rank | Disability Age 5 to 17 |
| Pueblo | 27.5 /100 | #189 | Fair 5.7% |
| Immigrants | Eastern Africa | 27.3 /100 | #190 | Fair 5.7% |
| Danes | 26.5 /100 | #191 | Fair 5.7% |
| Immigrants | Bosnia and Herzegovina | 26.3 /100 | #192 | Fair 5.7% |
| Immigrants | Canada | 26.1 /100 | #193 | Fair 5.7% |
| Croatians | 23.6 /100 | #194 | Fair 5.7% |
| Immigrants | Nigeria | 23.4 /100 | #195 | Fair 5.7% |
| Inupiat | 23.3 /100 | #196 | Fair 5.7% |
| Immigrants | North America | 23.1 /100 | #197 | Fair 5.7% |
| Norwegians | 20.9 /100 | #198 | Fair 5.7% |
| Northern Europeans | 15.2 /100 | #199 | Poor 5.7% |
| Icelanders | 14.6 /100 | #200 | Poor 5.7% |
| Basques | 13.7 /100 | #201 | Poor 5.7% |
| Austrians | 13.2 /100 | #202 | Poor 5.7% |
| Spanish American Indians | 12.8 /100 | #203 | Poor 5.7% |
Demographics Similar to Native Hawaiians by Disability Age 5 to 17
In terms of disability age 5 to 17, the demographic groups most similar to Native Hawaiians are Sri Lankan (5.2%, a difference of 0.040%), Afghan (5.2%, a difference of 0.070%), Immigrants from Cuba (5.2%, a difference of 0.10%), Immigrants from Kazakhstan (5.2%, a difference of 0.11%), and Immigrants from Sweden (5.2%, a difference of 0.11%).
| Demographics | Rating | Rank | Disability Age 5 to 17 |
| Immigrants | Romania | 99.7 /100 | #74 | Exceptional 5.2% |
| Immigrants | Moldova | 99.6 /100 | #75 | Exceptional 5.2% |
| Immigrants | Guyana | 99.6 /100 | #76 | Exceptional 5.2% |
| Immigrants | Kazakhstan | 99.6 /100 | #77 | Exceptional 5.2% |
| Immigrants | Cuba | 99.6 /100 | #78 | Exceptional 5.2% |
| Afghans | 99.6 /100 | #79 | Exceptional 5.2% |
| Sri Lankans | 99.6 /100 | #80 | Exceptional 5.2% |
| Native Hawaiians | 99.6 /100 | #81 | Exceptional 5.2% |
| Immigrants | Sweden | 99.5 /100 | #82 | Exceptional 5.2% |
| Immigrants | France | 99.5 /100 | #83 | Exceptional 5.2% |
| Immigrants | Nicaragua | 99.5 /100 | #84 | Exceptional 5.2% |
| Bulgarians | 99.4 /100 | #85 | Exceptional 5.2% |
| Immigrants | St. Vincent and the Grenadines | 99.4 /100 | #86 | Exceptional 5.2% |
| Eastern Europeans | 99.4 /100 | #87 | Exceptional 5.2% |
| Immigrants | Croatia | 99.4 /100 | #88 | Exceptional 5.2% |