Carpatho Rusyn vs Native Hawaiian 2 or more Vehicles in Household
COMPARE
Carpatho Rusyn
Native Hawaiian
2 or more Vehicles in Household
2 or more Vehicles in Household Comparison
Carpatho Rusyns
Native Hawaiians
54.4%
2 OR MORE VEHICLES IN HOUSEHOLD
16.2/ 100
METRIC RATING
198th/ 347
METRIC RANK
61.4%
2 OR MORE VEHICLES IN HOUSEHOLD
100.0/ 100
METRIC RATING
16th/ 347
METRIC RANK
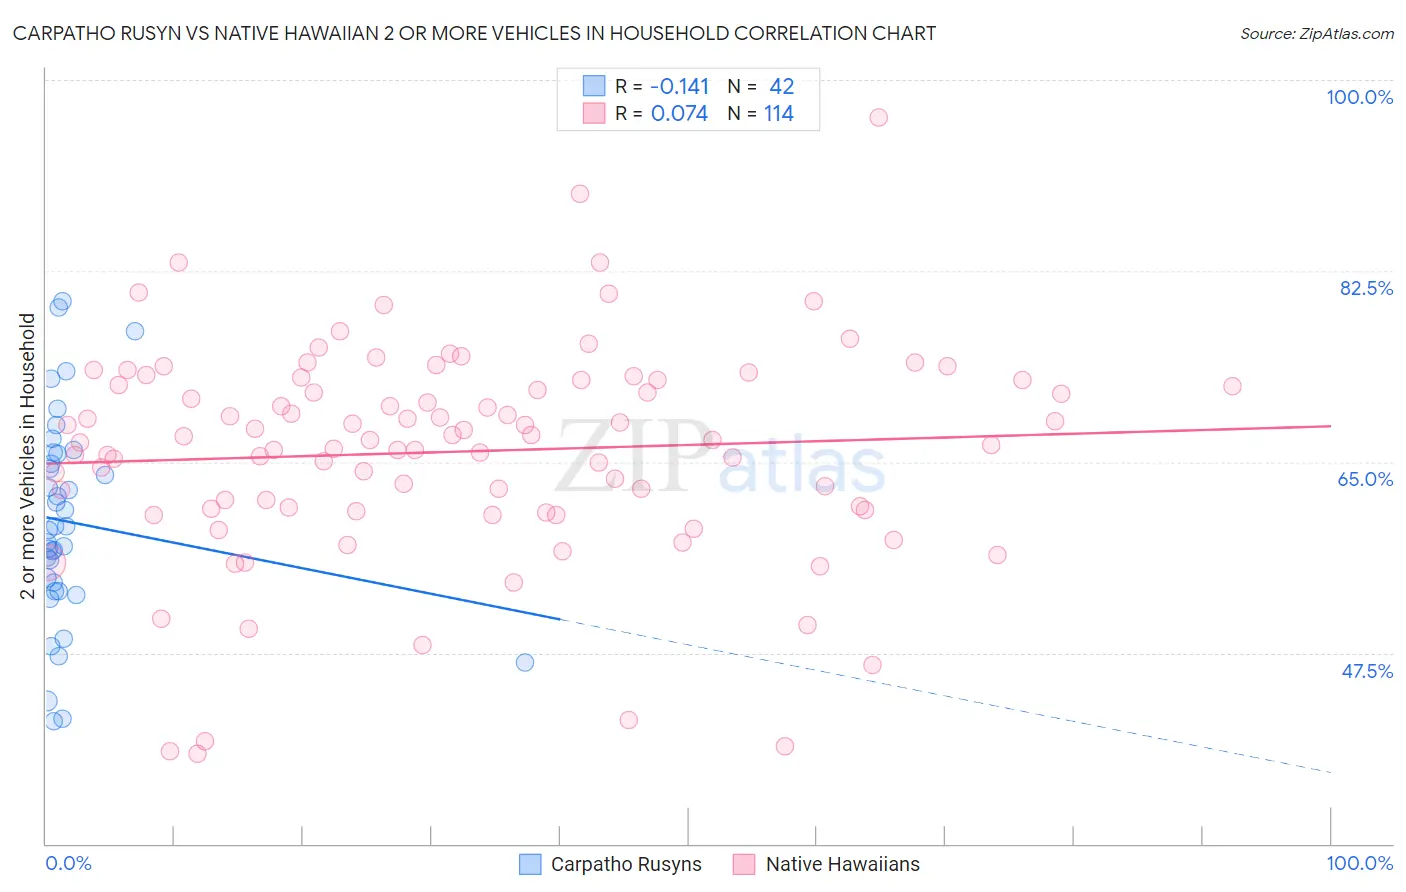
Carpatho Rusyn vs Native Hawaiian 2 or more Vehicles in Household Correlation Chart
The statistical analysis conducted on geographies consisting of 58,871,690 people shows a poor negative correlation between the proportion of Carpatho Rusyns and percentage of households with 2 or more vehicles available in the United States with a correlation coefficient (R) of -0.141 and weighted average of 54.4%. Similarly, the statistical analysis conducted on geographies consisting of 331,863,801 people shows a slight positive correlation between the proportion of Native Hawaiians and percentage of households with 2 or more vehicles available in the United States with a correlation coefficient (R) of 0.074 and weighted average of 61.4%, a difference of 12.8%.
2 or more Vehicles in Household Correlation Summary
| Measurement | Carpatho Rusyn | Native Hawaiian |
| Minimum | 41.3% | 38.2% |
| Maximum | 79.7% | 96.6% |
| Range | 38.5% | 58.3% |
| Mean | 59.5% | 65.9% |
| Median | 58.9% | 67.0% |
| Interquartile 25% (IQ1) | 53.2% | 60.8% |
| Interquartile 75% (IQ3) | 65.8% | 72.5% |
| Interquartile Range (IQR) | 12.6% | 11.7% |
| Standard Deviation (Sample) | 9.5% | 9.9% |
| Standard Deviation (Population) | 9.4% | 9.9% |
Similar Demographics by 2 or more Vehicles in Household
Demographics Similar to Carpatho Rusyns by 2 or more Vehicles in Household
In terms of 2 or more vehicles in household, the demographic groups most similar to Carpatho Rusyns are Immigrants from Norway (54.4%, a difference of 0.030%), Houma (54.4%, a difference of 0.030%), Immigrants from Italy (54.4%, a difference of 0.060%), Argentinean (54.5%, a difference of 0.090%), and Immigrants from North Macedonia (54.4%, a difference of 0.11%).
| Demographics | Rating | Rank | 2 or more Vehicles in Household |
| Immigrants | Immigrants | 25.0 /100 | #191 | Fair 54.7% |
| Immigrants | Romania | 23.8 /100 | #192 | Fair 54.7% |
| Immigrants | Japan | 23.4 /100 | #193 | Fair 54.7% |
| Central Americans | 23.0 /100 | #194 | Fair 54.7% |
| Iroquois | 22.6 /100 | #195 | Fair 54.7% |
| Immigrants | Poland | 19.3 /100 | #196 | Poor 54.6% |
| Argentineans | 17.5 /100 | #197 | Poor 54.5% |
| Carpatho Rusyns | 16.2 /100 | #198 | Poor 54.4% |
| Immigrants | Norway | 15.9 /100 | #199 | Poor 54.4% |
| Houma | 15.8 /100 | #200 | Poor 54.4% |
| Immigrants | Italy | 15.5 /100 | #201 | Poor 54.4% |
| Immigrants | North Macedonia | 14.9 /100 | #202 | Poor 54.4% |
| Immigrants | Peru | 14.3 /100 | #203 | Poor 54.4% |
| Immigrants | Belgium | 13.7 /100 | #204 | Poor 54.3% |
| Cheyenne | 13.6 /100 | #205 | Poor 54.3% |
Demographics Similar to Native Hawaiians by 2 or more Vehicles in Household
In terms of 2 or more vehicles in household, the demographic groups most similar to Native Hawaiians are Nepalese (61.4%, a difference of 0.020%), Basque (61.4%, a difference of 0.070%), European (61.4%, a difference of 0.080%), Czech (61.5%, a difference of 0.11%), and Samoan (61.5%, a difference of 0.16%).
| Demographics | Rating | Rank | 2 or more Vehicles in Household |
| Swedes | 100.0 /100 | #9 | Exceptional 61.8% |
| Mexicans | 100.0 /100 | #10 | Exceptional 61.7% |
| Dutch | 100.0 /100 | #11 | Exceptional 61.6% |
| Germans | 100.0 /100 | #12 | Exceptional 61.6% |
| Samoans | 100.0 /100 | #13 | Exceptional 61.5% |
| Czechs | 100.0 /100 | #14 | Exceptional 61.5% |
| Nepalese | 100.0 /100 | #15 | Exceptional 61.4% |
| Native Hawaiians | 100.0 /100 | #16 | Exceptional 61.4% |
| Basques | 100.0 /100 | #17 | Exceptional 61.4% |
| Europeans | 100.0 /100 | #18 | Exceptional 61.4% |
| Scottish | 100.0 /100 | #19 | Exceptional 61.2% |
| Sri Lankans | 100.0 /100 | #20 | Exceptional 61.0% |
| Koreans | 100.0 /100 | #21 | Exceptional 61.0% |
| Swiss | 100.0 /100 | #22 | Exceptional 61.0% |
| Scotch-Irish | 100.0 /100 | #23 | Exceptional 60.9% |