Carpatho Rusyn vs Immigrants from South Eastern Asia Disability Age 5 to 17
COMPARE
Carpatho Rusyn
Immigrants from South Eastern Asia
Disability Age 5 to 17
Disability Age 5 to 17 Comparison
Carpatho Rusyns
Immigrants from South Eastern Asia
6.3%
DISABILITY AGE 5 TO 17
0.0/ 100
METRIC RATING
300th/ 347
METRIC RANK
5.2%
DISABILITY AGE 5 TO 17
99.8/ 100
METRIC RATING
64th/ 347
METRIC RANK
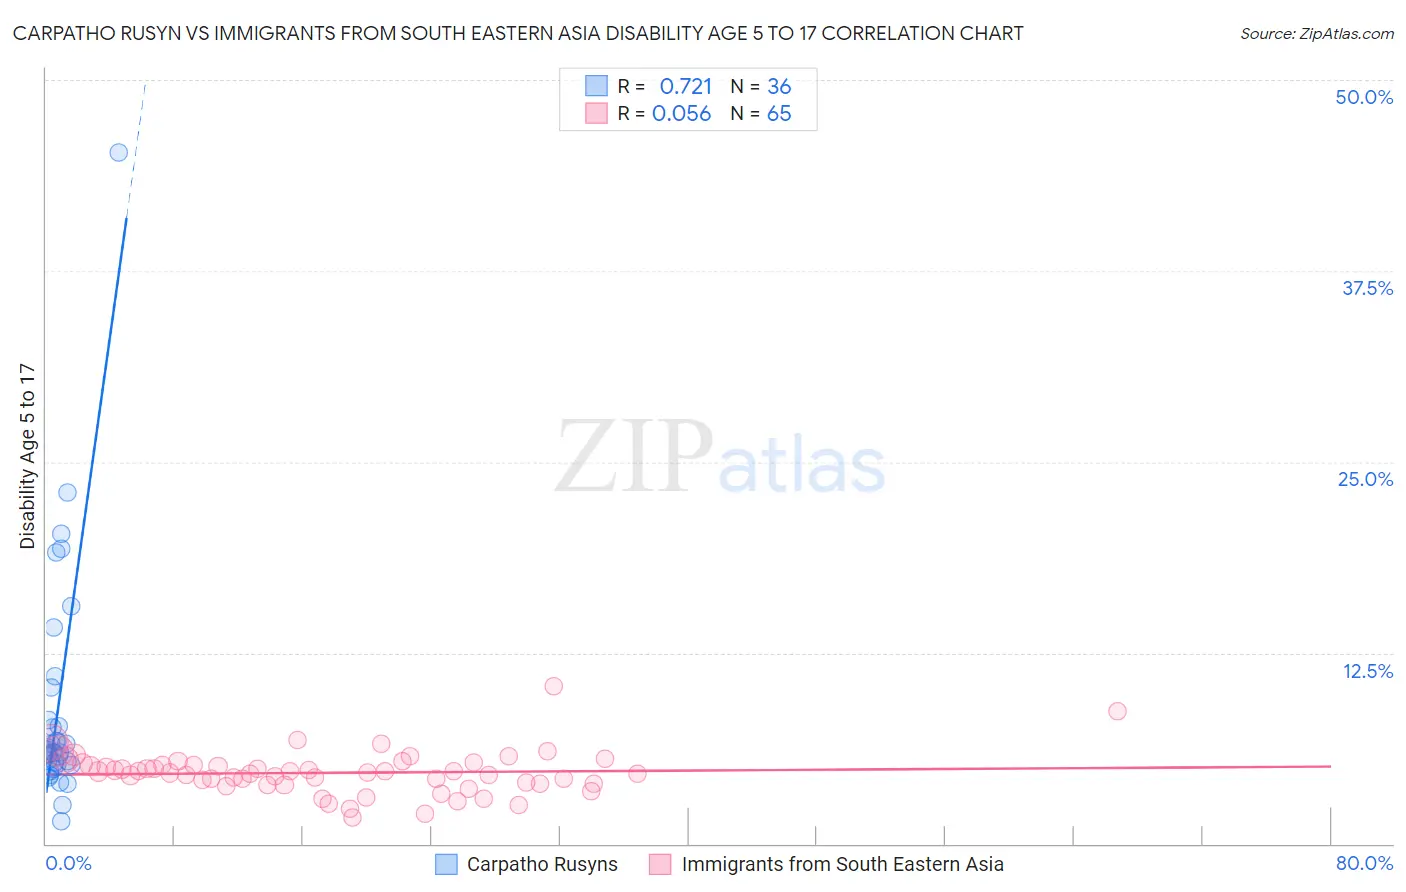
Carpatho Rusyn vs Immigrants from South Eastern Asia Disability Age 5 to 17 Correlation Chart
The statistical analysis conducted on geographies consisting of 58,826,840 people shows a strong positive correlation between the proportion of Carpatho Rusyns and percentage of population with a disability between the ages 5 and 17 in the United States with a correlation coefficient (R) of 0.721 and weighted average of 6.3%. Similarly, the statistical analysis conducted on geographies consisting of 505,803,855 people shows a slight positive correlation between the proportion of Immigrants from South Eastern Asia and percentage of population with a disability between the ages 5 and 17 in the United States with a correlation coefficient (R) of 0.056 and weighted average of 5.2%, a difference of 21.0%.
Disability Age 5 to 17 Correlation Summary
| Measurement | Carpatho Rusyn | Immigrants from South Eastern Asia |
| Minimum | 1.5% | 1.7% |
| Maximum | 45.2% | 10.3% |
| Range | 43.8% | 8.6% |
| Mean | 9.1% | 4.6% |
| Median | 6.1% | 4.6% |
| Interquartile 25% (IQ1) | 5.2% | 3.9% |
| Interquartile 75% (IQ3) | 9.1% | 5.2% |
| Interquartile Range (IQR) | 4.0% | 1.3% |
| Standard Deviation (Sample) | 8.1% | 1.4% |
| Standard Deviation (Population) | 8.0% | 1.4% |
Similar Demographics by Disability Age 5 to 17
Demographics Similar to Carpatho Rusyns by Disability Age 5 to 17
In terms of disability age 5 to 17, the demographic groups most similar to Carpatho Rusyns are U.S. Virgin Islander (6.3%, a difference of 0.020%), Welsh (6.3%, a difference of 0.12%), Lumbee (6.2%, a difference of 0.27%), Immigrants from Bahamas (6.2%, a difference of 0.34%), and Celtic (6.3%, a difference of 0.35%).
| Demographics | Rating | Rank | Disability Age 5 to 17 |
| Central American Indians | 0.0 /100 | #293 | Tragic 6.2% |
| Irish | 0.0 /100 | #294 | Tragic 6.2% |
| Cree | 0.0 /100 | #295 | Tragic 6.2% |
| Spanish Americans | 0.0 /100 | #296 | Tragic 6.2% |
| Immigrants | Bahamas | 0.0 /100 | #297 | Tragic 6.2% |
| Lumbee | 0.0 /100 | #298 | Tragic 6.2% |
| Welsh | 0.0 /100 | #299 | Tragic 6.3% |
| Carpatho Rusyns | 0.0 /100 | #300 | Tragic 6.3% |
| U.S. Virgin Islanders | 0.0 /100 | #301 | Tragic 6.3% |
| Celtics | 0.0 /100 | #302 | Tragic 6.3% |
| Yakama | 0.0 /100 | #303 | Tragic 6.3% |
| Senegalese | 0.0 /100 | #304 | Tragic 6.3% |
| Natives/Alaskans | 0.0 /100 | #305 | Tragic 6.3% |
| Immigrants | Nonimmigrants | 0.0 /100 | #306 | Tragic 6.3% |
| Bahamians | 0.0 /100 | #307 | Tragic 6.3% |
Demographics Similar to Immigrants from South Eastern Asia by Disability Age 5 to 17
In terms of disability age 5 to 17, the demographic groups most similar to Immigrants from South Eastern Asia are Immigrants from Greece (5.2%, a difference of 0.010%), Immigrants from Bangladesh (5.2%, a difference of 0.030%), Palestinian (5.2%, a difference of 0.060%), Macedonian (5.2%, a difference of 0.080%), and Immigrants from Ireland (5.2%, a difference of 0.14%).
| Demographics | Rating | Rank | Disability Age 5 to 17 |
| Immigrants | Poland | 99.9 /100 | #57 | Exceptional 5.1% |
| Immigrants | Ukraine | 99.9 /100 | #58 | Exceptional 5.1% |
| Immigrants | North Macedonia | 99.9 /100 | #59 | Exceptional 5.1% |
| Immigrants | Eastern Europe | 99.9 /100 | #60 | Exceptional 5.1% |
| Immigrants | Switzerland | 99.8 /100 | #61 | Exceptional 5.2% |
| Immigrants | Ireland | 99.8 /100 | #62 | Exceptional 5.2% |
| Immigrants | Bangladesh | 99.8 /100 | #63 | Exceptional 5.2% |
| Immigrants | South Eastern Asia | 99.8 /100 | #64 | Exceptional 5.2% |
| Immigrants | Greece | 99.8 /100 | #65 | Exceptional 5.2% |
| Palestinians | 99.8 /100 | #66 | Exceptional 5.2% |
| Macedonians | 99.8 /100 | #67 | Exceptional 5.2% |
| Immigrants | Syria | 99.7 /100 | #68 | Exceptional 5.2% |
| Guyanese | 99.7 /100 | #69 | Exceptional 5.2% |
| Immigrants | Belgium | 99.7 /100 | #70 | Exceptional 5.2% |
| Jordanians | 99.7 /100 | #71 | Exceptional 5.2% |