Canadian vs Scandinavian Disability Age 5 to 17
COMPARE
Canadian
Scandinavian
Disability Age 5 to 17
Disability Age 5 to 17 Comparison
Canadians
Scandinavians
6.0%
DISABILITY AGE 5 TO 17
0.6/ 100
METRIC RATING
264th/ 347
METRIC RANK
5.9%
DISABILITY AGE 5 TO 17
1.4/ 100
METRIC RATING
253rd/ 347
METRIC RANK
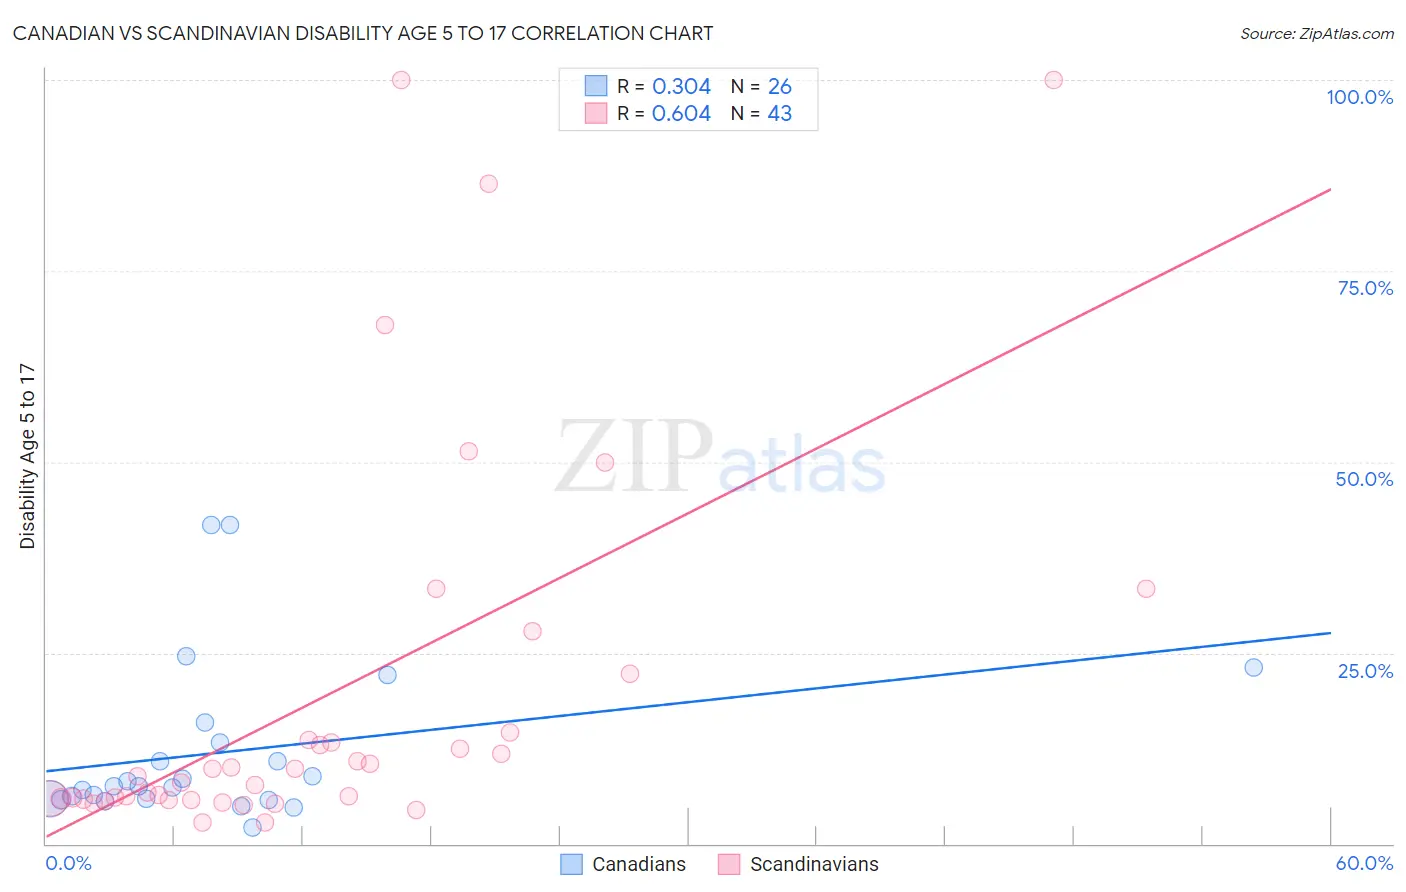
Canadian vs Scandinavian Disability Age 5 to 17 Correlation Chart
The statistical analysis conducted on geographies consisting of 432,656,335 people shows a mild positive correlation between the proportion of Canadians and percentage of population with a disability between the ages 5 and 17 in the United States with a correlation coefficient (R) of 0.304 and weighted average of 6.0%. Similarly, the statistical analysis conducted on geographies consisting of 465,927,365 people shows a significant positive correlation between the proportion of Scandinavians and percentage of population with a disability between the ages 5 and 17 in the United States with a correlation coefficient (R) of 0.604 and weighted average of 5.9%, a difference of 0.99%.
Disability Age 5 to 17 Correlation Summary
| Measurement | Canadian | Scandinavian |
| Minimum | 2.1% | 2.7% |
| Maximum | 41.8% | 100.0% |
| Range | 39.7% | 97.3% |
| Mean | 12.0% | 19.3% |
| Median | 7.5% | 8.8% |
| Interquartile 25% (IQ1) | 5.8% | 5.8% |
| Interquartile 75% (IQ3) | 13.2% | 14.5% |
| Interquartile Range (IQR) | 7.4% | 8.7% |
| Standard Deviation (Sample) | 10.5% | 25.4% |
| Standard Deviation (Population) | 10.3% | 25.1% |
Demographics Similar to Canadians and Scandinavians by Disability Age 5 to 17
In terms of disability age 5 to 17, the demographic groups most similar to Canadians are Panamanian (6.0%, a difference of 0.070%), Slovene (6.0%, a difference of 0.10%), Czechoslovakian (5.9%, a difference of 0.12%), Immigrants from Western Africa (5.9%, a difference of 0.20%), and Spanish (6.0%, a difference of 0.21%). Similarly, the demographic groups most similar to Scandinavians are Honduran (5.9%, a difference of 0.070%), Immigrants from Cambodia (5.9%, a difference of 0.090%), Barbadian (5.9%, a difference of 0.10%), Polish (5.9%, a difference of 0.11%), and Italian (5.9%, a difference of 0.17%).
| Demographics | Rating | Rank | Disability Age 5 to 17 |
| British | 1.7 /100 | #248 | Tragic 5.9% |
| Immigrants | Ghana | 1.7 /100 | #249 | Tragic 5.9% |
| Poles | 1.5 /100 | #250 | Tragic 5.9% |
| Immigrants | Cambodia | 1.5 /100 | #251 | Tragic 5.9% |
| Hondurans | 1.5 /100 | #252 | Tragic 5.9% |
| Scandinavians | 1.4 /100 | #253 | Tragic 5.9% |
| Barbadians | 1.3 /100 | #254 | Tragic 5.9% |
| Italians | 1.2 /100 | #255 | Tragic 5.9% |
| Hopi | 1.0 /100 | #256 | Tragic 5.9% |
| Hispanics or Latinos | 1.0 /100 | #257 | Tragic 5.9% |
| Brazilians | 0.9 /100 | #258 | Tragic 5.9% |
| Slavs | 0.9 /100 | #259 | Tragic 5.9% |
| Somalis | 0.8 /100 | #260 | Tragic 5.9% |
| Immigrants | Middle Africa | 0.7 /100 | #261 | Tragic 5.9% |
| Immigrants | Western Africa | 0.7 /100 | #262 | Tragic 5.9% |
| Czechoslovakians | 0.7 /100 | #263 | Tragic 5.9% |
| Canadians | 0.6 /100 | #264 | Tragic 6.0% |
| Panamanians | 0.6 /100 | #265 | Tragic 6.0% |
| Slovenes | 0.6 /100 | #266 | Tragic 6.0% |
| Spanish | 0.5 /100 | #267 | Tragic 6.0% |
| Sioux | 0.4 /100 | #268 | Tragic 6.0% |