Canadian vs Nepalese Disability Age 5 to 17
COMPARE
Canadian
Nepalese
Disability Age 5 to 17
Disability Age 5 to 17 Comparison
Canadians
Nepalese
6.0%
DISABILITY AGE 5 TO 17
0.6/ 100
METRIC RATING
264th/ 347
METRIC RANK
5.3%
DISABILITY AGE 5 TO 17
98.7/ 100
METRIC RATING
100th/ 347
METRIC RANK
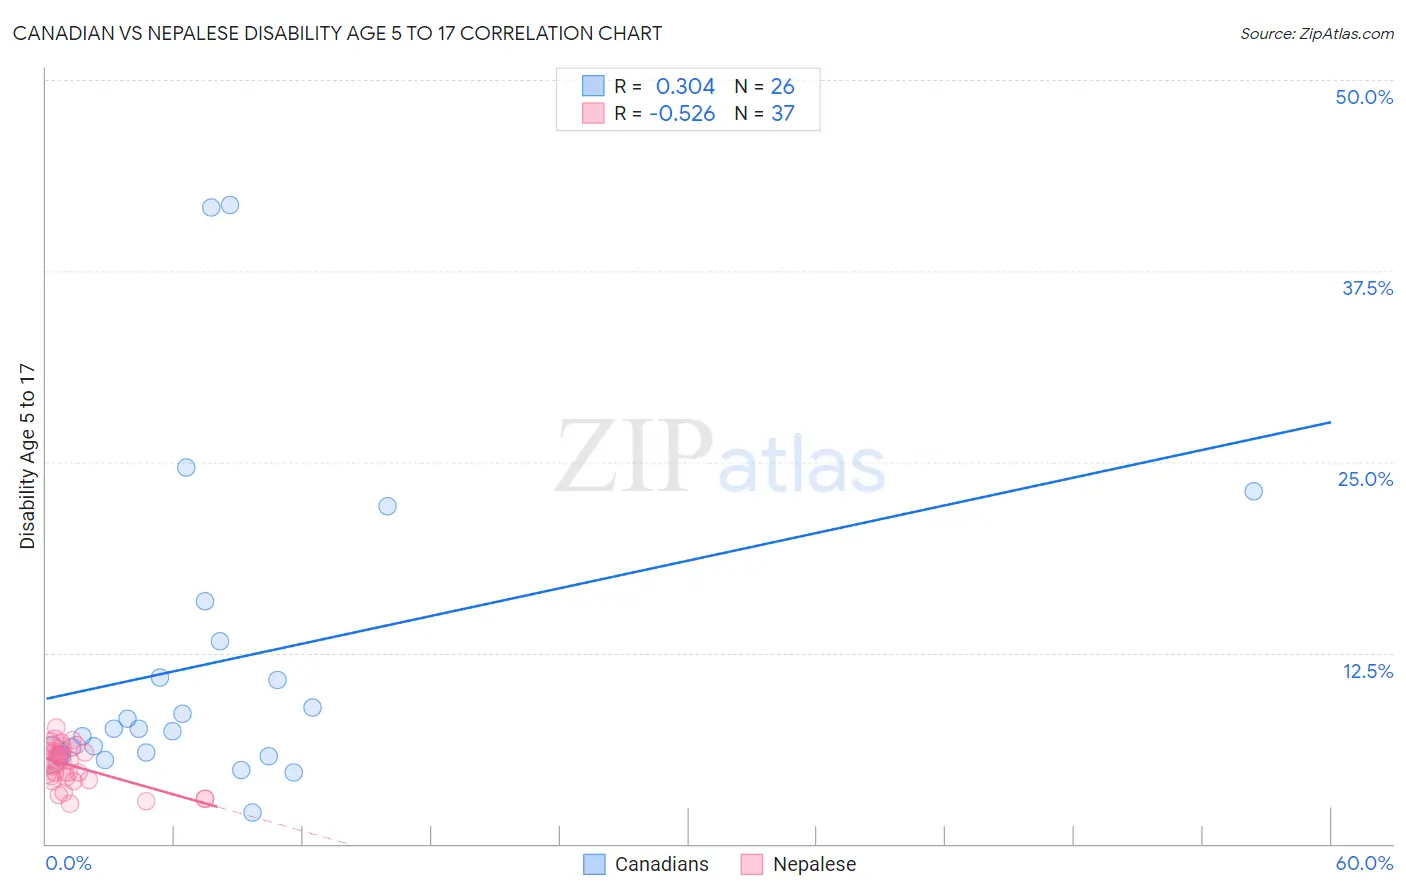
Canadian vs Nepalese Disability Age 5 to 17 Correlation Chart
The statistical analysis conducted on geographies consisting of 432,656,335 people shows a mild positive correlation between the proportion of Canadians and percentage of population with a disability between the ages 5 and 17 in the United States with a correlation coefficient (R) of 0.304 and weighted average of 6.0%. Similarly, the statistical analysis conducted on geographies consisting of 24,514,017 people shows a substantial negative correlation between the proportion of Nepalese and percentage of population with a disability between the ages 5 and 17 in the United States with a correlation coefficient (R) of -0.526 and weighted average of 5.3%, a difference of 12.3%.
Disability Age 5 to 17 Correlation Summary
| Measurement | Canadian | Nepalese |
| Minimum | 2.1% | 2.7% |
| Maximum | 41.8% | 7.6% |
| Range | 39.7% | 4.9% |
| Mean | 12.0% | 5.1% |
| Median | 7.5% | 5.3% |
| Interquartile 25% (IQ1) | 5.8% | 4.2% |
| Interquartile 75% (IQ3) | 13.2% | 6.0% |
| Interquartile Range (IQR) | 7.4% | 1.8% |
| Standard Deviation (Sample) | 10.5% | 1.3% |
| Standard Deviation (Population) | 10.3% | 1.3% |
Similar Demographics by Disability Age 5 to 17
Demographics Similar to Canadians by Disability Age 5 to 17
In terms of disability age 5 to 17, the demographic groups most similar to Canadians are Panamanian (6.0%, a difference of 0.070%), Slovene (6.0%, a difference of 0.10%), Czechoslovakian (5.9%, a difference of 0.12%), Immigrants from Western Africa (5.9%, a difference of 0.20%), and Spanish (6.0%, a difference of 0.21%).
| Demographics | Rating | Rank | Disability Age 5 to 17 |
| Hispanics or Latinos | 1.0 /100 | #257 | Tragic 5.9% |
| Brazilians | 0.9 /100 | #258 | Tragic 5.9% |
| Slavs | 0.9 /100 | #259 | Tragic 5.9% |
| Somalis | 0.8 /100 | #260 | Tragic 5.9% |
| Immigrants | Middle Africa | 0.7 /100 | #261 | Tragic 5.9% |
| Immigrants | Western Africa | 0.7 /100 | #262 | Tragic 5.9% |
| Czechoslovakians | 0.7 /100 | #263 | Tragic 5.9% |
| Canadians | 0.6 /100 | #264 | Tragic 6.0% |
| Panamanians | 0.6 /100 | #265 | Tragic 6.0% |
| Slovenes | 0.6 /100 | #266 | Tragic 6.0% |
| Spanish | 0.5 /100 | #267 | Tragic 6.0% |
| Sioux | 0.4 /100 | #268 | Tragic 6.0% |
| Liberians | 0.4 /100 | #269 | Tragic 6.0% |
| Immigrants | Somalia | 0.4 /100 | #270 | Tragic 6.0% |
| Immigrants | Zaire | 0.2 /100 | #271 | Tragic 6.0% |
Demographics Similar to Nepalese by Disability Age 5 to 17
In terms of disability age 5 to 17, the demographic groups most similar to Nepalese are Menominee (5.3%, a difference of 0.020%), Nicaraguan (5.3%, a difference of 0.10%), Salvadoran (5.3%, a difference of 0.13%), Cambodian (5.3%, a difference of 0.16%), and Peruvian (5.3%, a difference of 0.20%).
| Demographics | Rating | Rank | Disability Age 5 to 17 |
| Immigrants | Peru | 99.1 /100 | #93 | Exceptional 5.3% |
| Immigrants | Jordan | 99.1 /100 | #94 | Exceptional 5.3% |
| Immigrants | Grenada | 99.1 /100 | #95 | Exceptional 5.3% |
| Immigrants | El Salvador | 99.0 /100 | #96 | Exceptional 5.3% |
| Immigrants | Europe | 99.0 /100 | #97 | Exceptional 5.3% |
| Immigrants | Austria | 98.9 /100 | #98 | Exceptional 5.3% |
| Cambodians | 98.8 /100 | #99 | Exceptional 5.3% |
| Nepalese | 98.7 /100 | #100 | Exceptional 5.3% |
| Menominee | 98.7 /100 | #101 | Exceptional 5.3% |
| Nicaraguans | 98.6 /100 | #102 | Exceptional 5.3% |
| Salvadorans | 98.6 /100 | #103 | Exceptional 5.3% |
| Peruvians | 98.5 /100 | #104 | Exceptional 5.3% |
| Immigrants | Italy | 98.4 /100 | #105 | Exceptional 5.3% |
| Immigrants | Yemen | 98.2 /100 | #106 | Exceptional 5.3% |
| Russians | 98.2 /100 | #107 | Exceptional 5.3% |