Welsh vs Scandinavian Disability Age 5 to 17
COMPARE
Welsh
Scandinavian
Disability Age 5 to 17
Disability Age 5 to 17 Comparison
Welsh
Scandinavians
6.3%
DISABILITY AGE 5 TO 17
0.0/ 100
METRIC RATING
299th/ 347
METRIC RANK
5.9%
DISABILITY AGE 5 TO 17
1.4/ 100
METRIC RATING
253rd/ 347
METRIC RANK
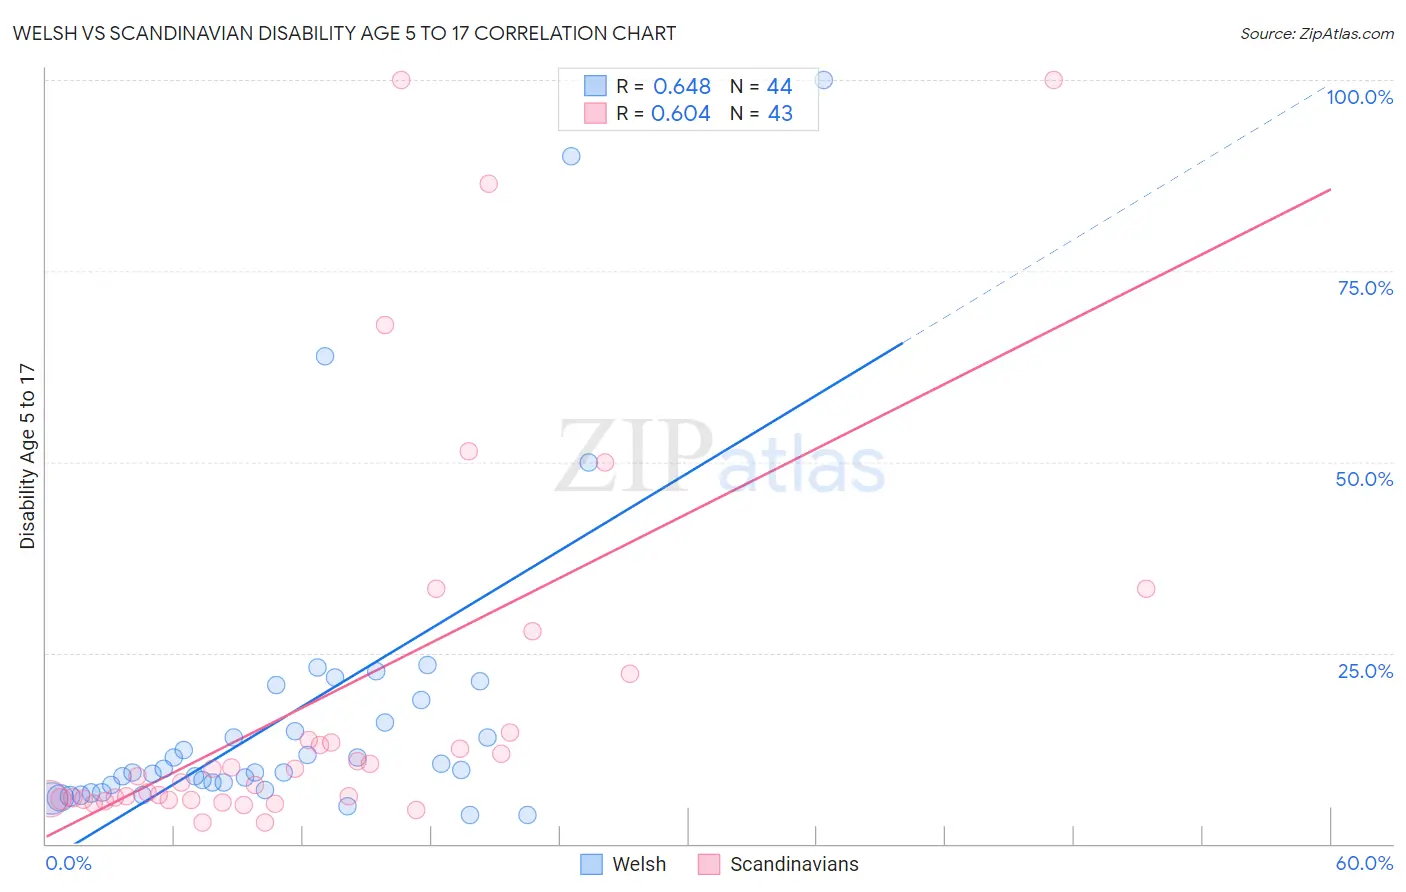
Welsh vs Scandinavian Disability Age 5 to 17 Correlation Chart
The statistical analysis conducted on geographies consisting of 518,817,158 people shows a significant positive correlation between the proportion of Welsh and percentage of population with a disability between the ages 5 and 17 in the United States with a correlation coefficient (R) of 0.648 and weighted average of 6.3%. Similarly, the statistical analysis conducted on geographies consisting of 465,927,365 people shows a significant positive correlation between the proportion of Scandinavians and percentage of population with a disability between the ages 5 and 17 in the United States with a correlation coefficient (R) of 0.604 and weighted average of 5.9%, a difference of 6.1%.
Disability Age 5 to 17 Correlation Summary
| Measurement | Welsh | Scandinavian |
| Minimum | 3.7% | 2.7% |
| Maximum | 100.0% | 100.0% |
| Range | 96.3% | 97.3% |
| Mean | 17.0% | 19.3% |
| Median | 9.5% | 8.8% |
| Interquartile 25% (IQ1) | 7.4% | 5.8% |
| Interquartile 75% (IQ3) | 17.4% | 14.5% |
| Interquartile Range (IQR) | 9.9% | 8.7% |
| Standard Deviation (Sample) | 20.5% | 25.4% |
| Standard Deviation (Population) | 20.3% | 25.1% |
Similar Demographics by Disability Age 5 to 17
Demographics Similar to Welsh by Disability Age 5 to 17
In terms of disability age 5 to 17, the demographic groups most similar to Welsh are Carpatho Rusyn (6.3%, a difference of 0.12%), U.S. Virgin Islander (6.3%, a difference of 0.14%), Lumbee (6.2%, a difference of 0.15%), Immigrants from Bahamas (6.2%, a difference of 0.22%), and Spanish American (6.2%, a difference of 0.35%).
| Demographics | Rating | Rank | Disability Age 5 to 17 |
| Immigrants | Senegal | 0.0 /100 | #292 | Tragic 6.2% |
| Central American Indians | 0.0 /100 | #293 | Tragic 6.2% |
| Irish | 0.0 /100 | #294 | Tragic 6.2% |
| Cree | 0.0 /100 | #295 | Tragic 6.2% |
| Spanish Americans | 0.0 /100 | #296 | Tragic 6.2% |
| Immigrants | Bahamas | 0.0 /100 | #297 | Tragic 6.2% |
| Lumbee | 0.0 /100 | #298 | Tragic 6.2% |
| Welsh | 0.0 /100 | #299 | Tragic 6.3% |
| Carpatho Rusyns | 0.0 /100 | #300 | Tragic 6.3% |
| U.S. Virgin Islanders | 0.0 /100 | #301 | Tragic 6.3% |
| Celtics | 0.0 /100 | #302 | Tragic 6.3% |
| Yakama | 0.0 /100 | #303 | Tragic 6.3% |
| Senegalese | 0.0 /100 | #304 | Tragic 6.3% |
| Natives/Alaskans | 0.0 /100 | #305 | Tragic 6.3% |
| Immigrants | Nonimmigrants | 0.0 /100 | #306 | Tragic 6.3% |
Demographics Similar to Scandinavians by Disability Age 5 to 17
In terms of disability age 5 to 17, the demographic groups most similar to Scandinavians are Honduran (5.9%, a difference of 0.070%), Immigrants from Cambodia (5.9%, a difference of 0.090%), Barbadian (5.9%, a difference of 0.10%), Polish (5.9%, a difference of 0.11%), and Italian (5.9%, a difference of 0.17%).
| Demographics | Rating | Rank | Disability Age 5 to 17 |
| Tlingit-Haida | 1.9 /100 | #246 | Tragic 5.9% |
| Immigrants | Honduras | 1.8 /100 | #247 | Tragic 5.9% |
| British | 1.7 /100 | #248 | Tragic 5.9% |
| Immigrants | Ghana | 1.7 /100 | #249 | Tragic 5.9% |
| Poles | 1.5 /100 | #250 | Tragic 5.9% |
| Immigrants | Cambodia | 1.5 /100 | #251 | Tragic 5.9% |
| Hondurans | 1.5 /100 | #252 | Tragic 5.9% |
| Scandinavians | 1.4 /100 | #253 | Tragic 5.9% |
| Barbadians | 1.3 /100 | #254 | Tragic 5.9% |
| Italians | 1.2 /100 | #255 | Tragic 5.9% |
| Hopi | 1.0 /100 | #256 | Tragic 5.9% |
| Hispanics or Latinos | 1.0 /100 | #257 | Tragic 5.9% |
| Brazilians | 0.9 /100 | #258 | Tragic 5.9% |
| Slavs | 0.9 /100 | #259 | Tragic 5.9% |
| Somalis | 0.8 /100 | #260 | Tragic 5.9% |