Canadian vs Immigrants from Trinidad and Tobago Disability Age 5 to 17
COMPARE
Canadian
Immigrants from Trinidad and Tobago
Disability Age 5 to 17
Disability Age 5 to 17 Comparison
Canadians
Immigrants from Trinidad and Tobago
6.0%
DISABILITY AGE 5 TO 17
0.6/ 100
METRIC RATING
264th/ 347
METRIC RANK
5.6%
DISABILITY AGE 5 TO 17
47.6/ 100
METRIC RATING
178th/ 347
METRIC RANK
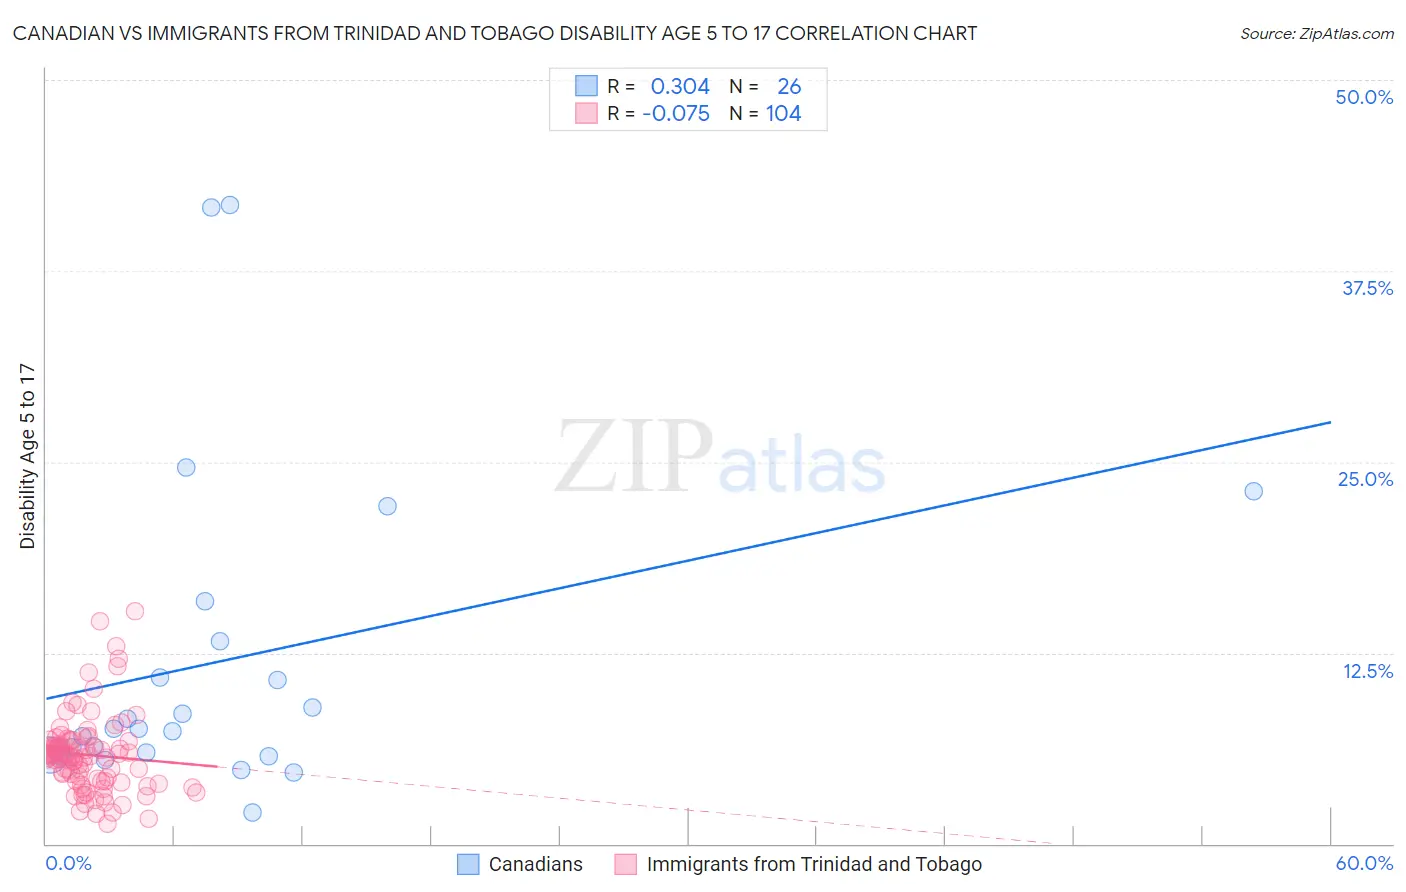
Canadian vs Immigrants from Trinidad and Tobago Disability Age 5 to 17 Correlation Chart
The statistical analysis conducted on geographies consisting of 432,656,335 people shows a mild positive correlation between the proportion of Canadians and percentage of population with a disability between the ages 5 and 17 in the United States with a correlation coefficient (R) of 0.304 and weighted average of 6.0%. Similarly, the statistical analysis conducted on geographies consisting of 222,636,548 people shows a slight negative correlation between the proportion of Immigrants from Trinidad and Tobago and percentage of population with a disability between the ages 5 and 17 in the United States with a correlation coefficient (R) of -0.075 and weighted average of 5.6%, a difference of 6.2%.
Disability Age 5 to 17 Correlation Summary
| Measurement | Canadian | Immigrants from Trinidad and Tobago |
| Minimum | 2.1% | 1.3% |
| Maximum | 41.8% | 15.2% |
| Range | 39.7% | 13.9% |
| Mean | 12.0% | 5.8% |
| Median | 7.5% | 5.8% |
| Interquartile 25% (IQ1) | 5.8% | 4.2% |
| Interquartile 75% (IQ3) | 13.2% | 6.6% |
| Interquartile Range (IQR) | 7.4% | 2.4% |
| Standard Deviation (Sample) | 10.5% | 2.5% |
| Standard Deviation (Population) | 10.3% | 2.5% |
Similar Demographics by Disability Age 5 to 17
Demographics Similar to Canadians by Disability Age 5 to 17
In terms of disability age 5 to 17, the demographic groups most similar to Canadians are Panamanian (6.0%, a difference of 0.070%), Slovene (6.0%, a difference of 0.10%), Czechoslovakian (5.9%, a difference of 0.12%), Immigrants from Western Africa (5.9%, a difference of 0.20%), and Spanish (6.0%, a difference of 0.21%).
| Demographics | Rating | Rank | Disability Age 5 to 17 |
| Hispanics or Latinos | 1.0 /100 | #257 | Tragic 5.9% |
| Brazilians | 0.9 /100 | #258 | Tragic 5.9% |
| Slavs | 0.9 /100 | #259 | Tragic 5.9% |
| Somalis | 0.8 /100 | #260 | Tragic 5.9% |
| Immigrants | Middle Africa | 0.7 /100 | #261 | Tragic 5.9% |
| Immigrants | Western Africa | 0.7 /100 | #262 | Tragic 5.9% |
| Czechoslovakians | 0.7 /100 | #263 | Tragic 5.9% |
| Canadians | 0.6 /100 | #264 | Tragic 6.0% |
| Panamanians | 0.6 /100 | #265 | Tragic 6.0% |
| Slovenes | 0.6 /100 | #266 | Tragic 6.0% |
| Spanish | 0.5 /100 | #267 | Tragic 6.0% |
| Sioux | 0.4 /100 | #268 | Tragic 6.0% |
| Liberians | 0.4 /100 | #269 | Tragic 6.0% |
| Immigrants | Somalia | 0.4 /100 | #270 | Tragic 6.0% |
| Immigrants | Zaire | 0.2 /100 | #271 | Tragic 6.0% |
Demographics Similar to Immigrants from Trinidad and Tobago by Disability Age 5 to 17
In terms of disability age 5 to 17, the demographic groups most similar to Immigrants from Trinidad and Tobago are Immigrants from Western Europe (5.6%, a difference of 0.010%), Shoshone (5.6%, a difference of 0.090%), Immigrants from Central America (5.6%, a difference of 0.090%), Costa Rican (5.6%, a difference of 0.12%), and Uruguayan (5.6%, a difference of 0.17%).
| Demographics | Rating | Rank | Disability Age 5 to 17 |
| Immigrants | Iraq | 53.9 /100 | #171 | Average 5.6% |
| Ukrainians | 51.5 /100 | #172 | Average 5.6% |
| Uruguayans | 51.0 /100 | #173 | Average 5.6% |
| Costa Ricans | 50.0 /100 | #174 | Average 5.6% |
| Shoshone | 49.4 /100 | #175 | Average 5.6% |
| Immigrants | Central America | 49.4 /100 | #176 | Average 5.6% |
| Immigrants | Western Europe | 47.8 /100 | #177 | Average 5.6% |
| Immigrants | Trinidad and Tobago | 47.6 /100 | #178 | Average 5.6% |
| Immigrants | Barbados | 40.5 /100 | #179 | Average 5.6% |
| Immigrants | Uruguay | 37.7 /100 | #180 | Fair 5.6% |
| Immigrants | England | 36.4 /100 | #181 | Fair 5.6% |
| Mexican American Indians | 35.2 /100 | #182 | Fair 5.6% |
| Immigrants | Latin America | 34.3 /100 | #183 | Fair 5.6% |
| Syrians | 33.8 /100 | #184 | Fair 5.6% |
| Immigrants | Mexico | 33.7 /100 | #185 | Fair 5.6% |