Canadian vs Immigrants from Korea Disability Age 5 to 17
COMPARE
Canadian
Immigrants from Korea
Disability Age 5 to 17
Disability Age 5 to 17 Comparison
Canadians
Immigrants from Korea
6.0%
DISABILITY AGE 5 TO 17
0.6/ 100
METRIC RATING
264th/ 347
METRIC RANK
4.7%
DISABILITY AGE 5 TO 17
100.0/ 100
METRIC RATING
14th/ 347
METRIC RANK
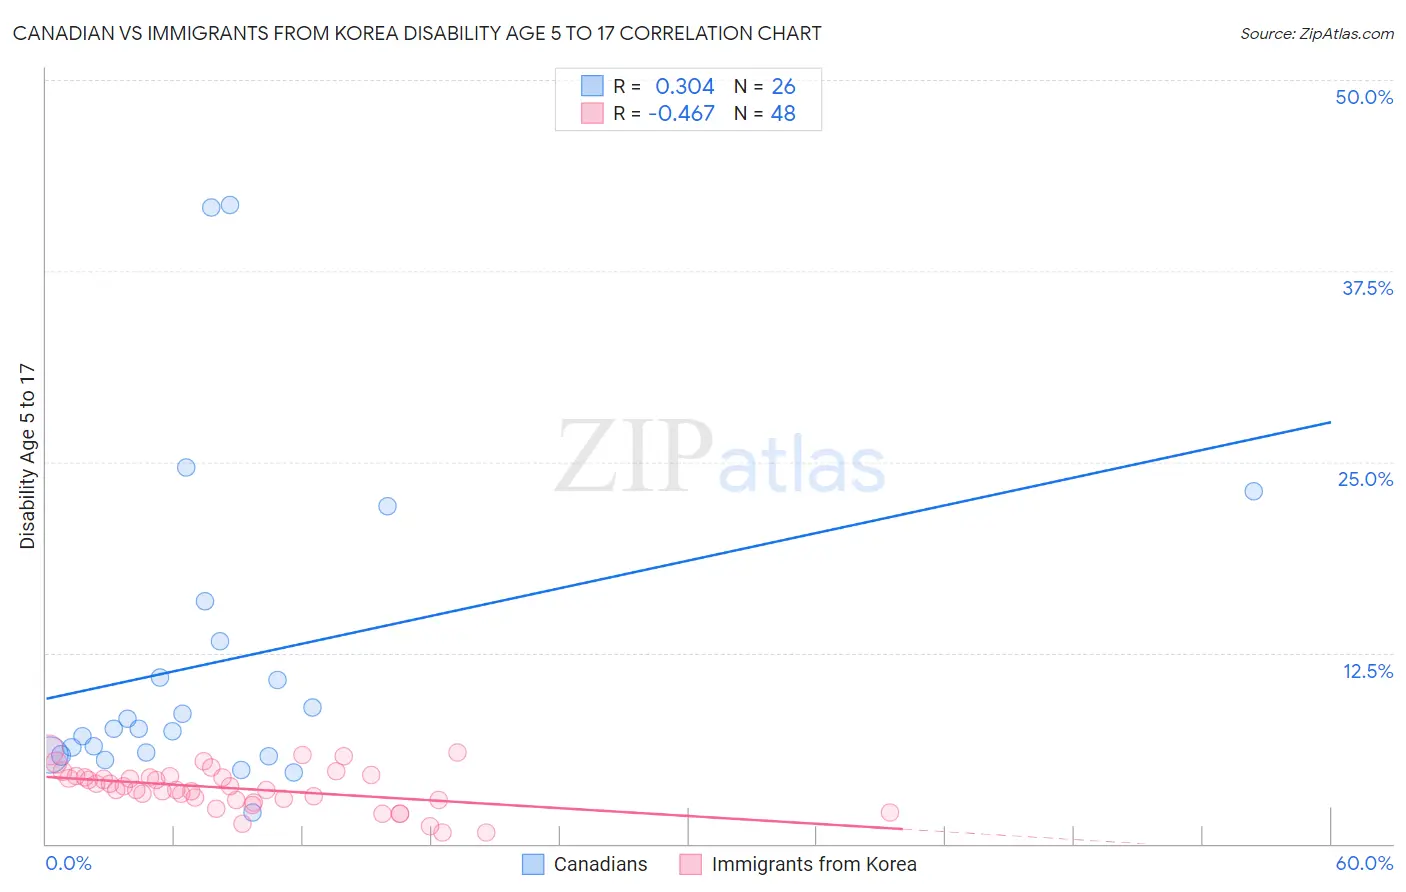
Canadian vs Immigrants from Korea Disability Age 5 to 17 Correlation Chart
The statistical analysis conducted on geographies consisting of 432,656,335 people shows a mild positive correlation between the proportion of Canadians and percentage of population with a disability between the ages 5 and 17 in the United States with a correlation coefficient (R) of 0.304 and weighted average of 6.0%. Similarly, the statistical analysis conducted on geographies consisting of 412,408,030 people shows a moderate negative correlation between the proportion of Immigrants from Korea and percentage of population with a disability between the ages 5 and 17 in the United States with a correlation coefficient (R) of -0.467 and weighted average of 4.7%, a difference of 27.0%.
Disability Age 5 to 17 Correlation Summary
| Measurement | Canadian | Immigrants from Korea |
| Minimum | 2.1% | 0.73% |
| Maximum | 41.8% | 6.2% |
| Range | 39.7% | 5.4% |
| Mean | 12.0% | 3.6% |
| Median | 7.5% | 3.6% |
| Interquartile 25% (IQ1) | 5.8% | 2.9% |
| Interquartile 75% (IQ3) | 13.2% | 4.4% |
| Interquartile Range (IQR) | 7.4% | 1.5% |
| Standard Deviation (Sample) | 10.5% | 1.3% |
| Standard Deviation (Population) | 10.3% | 1.3% |
Similar Demographics by Disability Age 5 to 17
Demographics Similar to Canadians by Disability Age 5 to 17
In terms of disability age 5 to 17, the demographic groups most similar to Canadians are Panamanian (6.0%, a difference of 0.070%), Slovene (6.0%, a difference of 0.10%), Czechoslovakian (5.9%, a difference of 0.12%), Immigrants from Western Africa (5.9%, a difference of 0.20%), and Spanish (6.0%, a difference of 0.21%).
| Demographics | Rating | Rank | Disability Age 5 to 17 |
| Hispanics or Latinos | 1.0 /100 | #257 | Tragic 5.9% |
| Brazilians | 0.9 /100 | #258 | Tragic 5.9% |
| Slavs | 0.9 /100 | #259 | Tragic 5.9% |
| Somalis | 0.8 /100 | #260 | Tragic 5.9% |
| Immigrants | Middle Africa | 0.7 /100 | #261 | Tragic 5.9% |
| Immigrants | Western Africa | 0.7 /100 | #262 | Tragic 5.9% |
| Czechoslovakians | 0.7 /100 | #263 | Tragic 5.9% |
| Canadians | 0.6 /100 | #264 | Tragic 6.0% |
| Panamanians | 0.6 /100 | #265 | Tragic 6.0% |
| Slovenes | 0.6 /100 | #266 | Tragic 6.0% |
| Spanish | 0.5 /100 | #267 | Tragic 6.0% |
| Sioux | 0.4 /100 | #268 | Tragic 6.0% |
| Liberians | 0.4 /100 | #269 | Tragic 6.0% |
| Immigrants | Somalia | 0.4 /100 | #270 | Tragic 6.0% |
| Immigrants | Zaire | 0.2 /100 | #271 | Tragic 6.0% |
Demographics Similar to Immigrants from Korea by Disability Age 5 to 17
In terms of disability age 5 to 17, the demographic groups most similar to Immigrants from Korea are Chinese (4.7%, a difference of 0.20%), Immigrants from Singapore (4.7%, a difference of 0.63%), Thai (4.7%, a difference of 0.70%), Arapaho (4.7%, a difference of 1.1%), and Immigrants from South Central Asia (4.7%, a difference of 1.1%).
| Demographics | Rating | Rank | Disability Age 5 to 17 |
| Immigrants | China | 100.0 /100 | #7 | Exceptional 4.5% |
| Indians (Asian) | 100.0 /100 | #8 | Exceptional 4.6% |
| Immigrants | Eastern Asia | 100.0 /100 | #9 | Exceptional 4.6% |
| Immigrants | India | 100.0 /100 | #10 | Exceptional 4.6% |
| Armenians | 100.0 /100 | #11 | Exceptional 4.6% |
| Iranians | 100.0 /100 | #12 | Exceptional 4.6% |
| Thais | 100.0 /100 | #13 | Exceptional 4.7% |
| Immigrants | Korea | 100.0 /100 | #14 | Exceptional 4.7% |
| Chinese | 100.0 /100 | #15 | Exceptional 4.7% |
| Immigrants | Singapore | 100.0 /100 | #16 | Exceptional 4.7% |
| Arapaho | 100.0 /100 | #17 | Exceptional 4.7% |
| Immigrants | South Central Asia | 100.0 /100 | #18 | Exceptional 4.7% |
| Immigrants | Uzbekistan | 100.0 /100 | #19 | Exceptional 4.8% |
| Burmese | 100.0 /100 | #20 | Exceptional 4.8% |
| Yup'ik | 100.0 /100 | #21 | Exceptional 4.8% |