Canadian vs Scandinavian College, 1 year or more
COMPARE
Canadian
Scandinavian
College, 1 year or more
College, 1 year or more Comparison
Canadians
Scandinavians
60.6%
COLLEGE, 1 YEAR OR MORE
82.7/ 100
METRIC RATING
143rd/ 347
METRIC RANK
61.0%
COLLEGE, 1 YEAR OR MORE
88.2/ 100
METRIC RATING
132nd/ 347
METRIC RANK
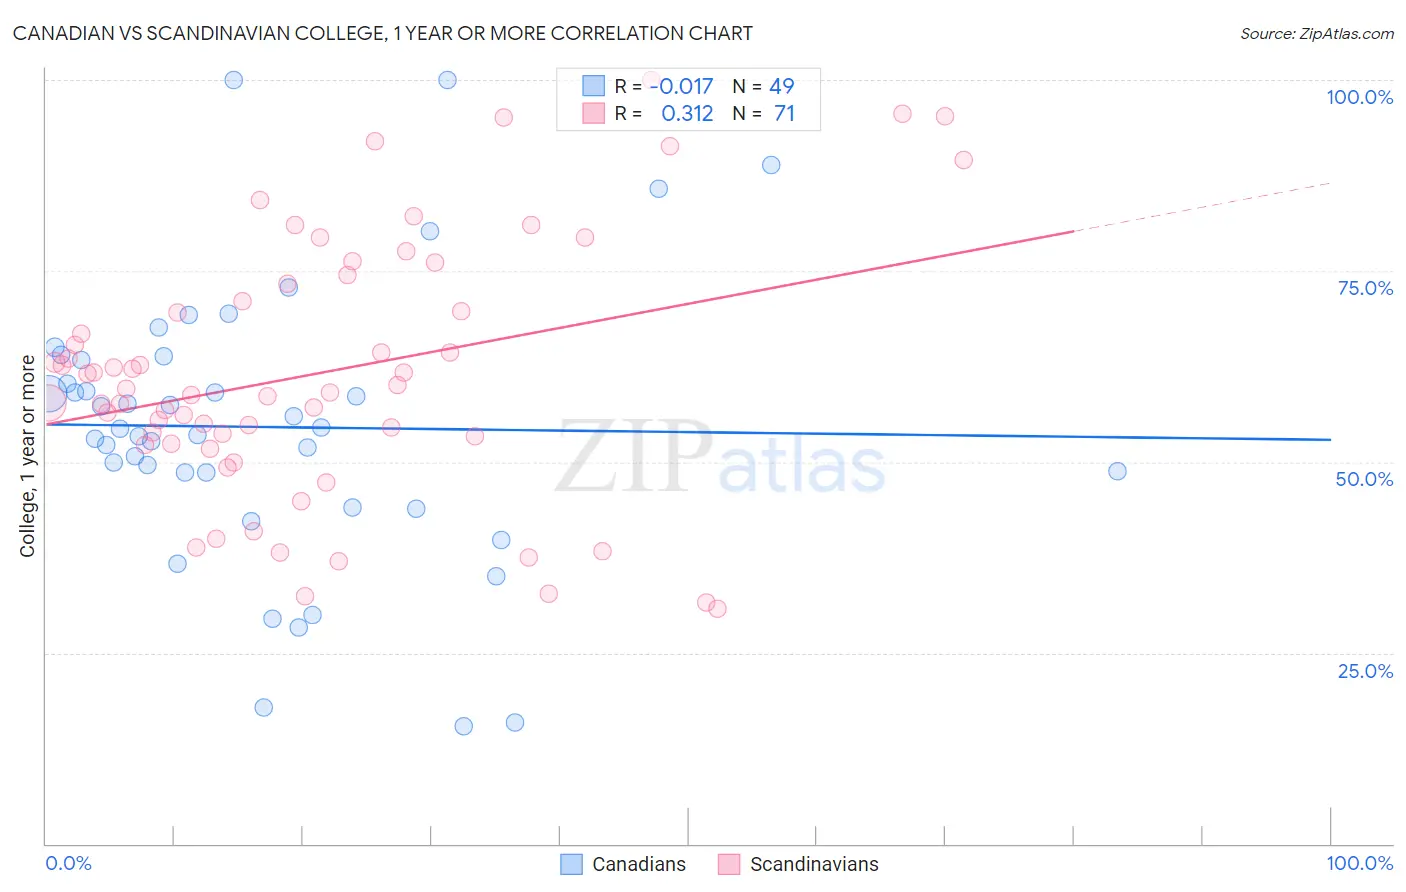
Canadian vs Scandinavian College, 1 year or more Correlation Chart
The statistical analysis conducted on geographies consisting of 437,551,933 people shows no correlation between the proportion of Canadians and percentage of population with at least college, 1 year or more education in the United States with a correlation coefficient (R) of -0.017 and weighted average of 60.6%. Similarly, the statistical analysis conducted on geographies consisting of 472,656,557 people shows a mild positive correlation between the proportion of Scandinavians and percentage of population with at least college, 1 year or more education in the United States with a correlation coefficient (R) of 0.312 and weighted average of 61.0%, a difference of 0.58%.
College, 1 year or more Correlation Summary
| Measurement | Canadian | Scandinavian |
| Minimum | 15.4% | 30.8% |
| Maximum | 100.0% | 100.0% |
| Range | 84.6% | 69.2% |
| Mean | 54.6% | 61.7% |
| Median | 54.3% | 59.5% |
| Interquartile 25% (IQ1) | 46.3% | 52.4% |
| Interquartile 75% (IQ3) | 63.6% | 73.2% |
| Interquartile Range (IQR) | 17.4% | 20.8% |
| Standard Deviation (Sample) | 18.4% | 16.9% |
| Standard Deviation (Population) | 18.2% | 16.7% |
Demographics Similar to Canadians and Scandinavians by College, 1 year or more
In terms of college, 1 year or more, the demographic groups most similar to Canadians are Polish (60.7%, a difference of 0.010%), Immigrants from Afghanistan (60.7%, a difference of 0.040%), Iraqi (60.7%, a difference of 0.050%), Czech (60.6%, a difference of 0.080%), and Slavic (60.6%, a difference of 0.14%). Similarly, the demographic groups most similar to Scandinavians are Immigrants from Uzbekistan (61.0%, a difference of 0.030%), Immigrants from Venezuela (61.0%, a difference of 0.040%), Immigrants from Uganda (60.9%, a difference of 0.10%), Basque (60.9%, a difference of 0.12%), and Immigrants from Morocco (61.1%, a difference of 0.16%).
| Demographics | Rating | Rank | College, 1 year or more |
| Immigrants | Eastern Africa | 91.1 /100 | #127 | Exceptional 61.2% |
| Immigrants | Italy | 91.1 /100 | #128 | Exceptional 61.2% |
| Ugandans | 90.7 /100 | #129 | Exceptional 61.2% |
| Italians | 89.5 /100 | #130 | Excellent 61.1% |
| Immigrants | Morocco | 89.5 /100 | #131 | Excellent 61.1% |
| Scandinavians | 88.2 /100 | #132 | Excellent 61.0% |
| Immigrants | Uzbekistan | 88.0 /100 | #133 | Excellent 61.0% |
| Immigrants | Venezuela | 87.9 /100 | #134 | Excellent 61.0% |
| Immigrants | Uganda | 87.4 /100 | #135 | Excellent 60.9% |
| Basques | 87.2 /100 | #136 | Excellent 60.9% |
| Slovenes | 86.5 /100 | #137 | Excellent 60.9% |
| Taiwanese | 84.3 /100 | #138 | Excellent 60.7% |
| Immigrants | Eritrea | 84.3 /100 | #139 | Excellent 60.7% |
| Iraqis | 83.3 /100 | #140 | Excellent 60.7% |
| Immigrants | Afghanistan | 83.1 /100 | #141 | Excellent 60.7% |
| Poles | 82.8 /100 | #142 | Excellent 60.7% |
| Canadians | 82.7 /100 | #143 | Excellent 60.6% |
| Czechs | 81.9 /100 | #144 | Excellent 60.6% |
| Slavs | 81.1 /100 | #145 | Excellent 60.6% |
| Scottish | 80.2 /100 | #146 | Excellent 60.5% |
| Immigrants | Kenya | 79.1 /100 | #147 | Good 60.5% |