Canadian vs Croatian Disability Age 5 to 17
COMPARE
Canadian
Croatian
Disability Age 5 to 17
Disability Age 5 to 17 Comparison
Canadians
Croatians
6.0%
DISABILITY AGE 5 TO 17
0.6/ 100
METRIC RATING
264th/ 347
METRIC RANK
5.7%
DISABILITY AGE 5 TO 17
23.6/ 100
METRIC RATING
194th/ 347
METRIC RANK
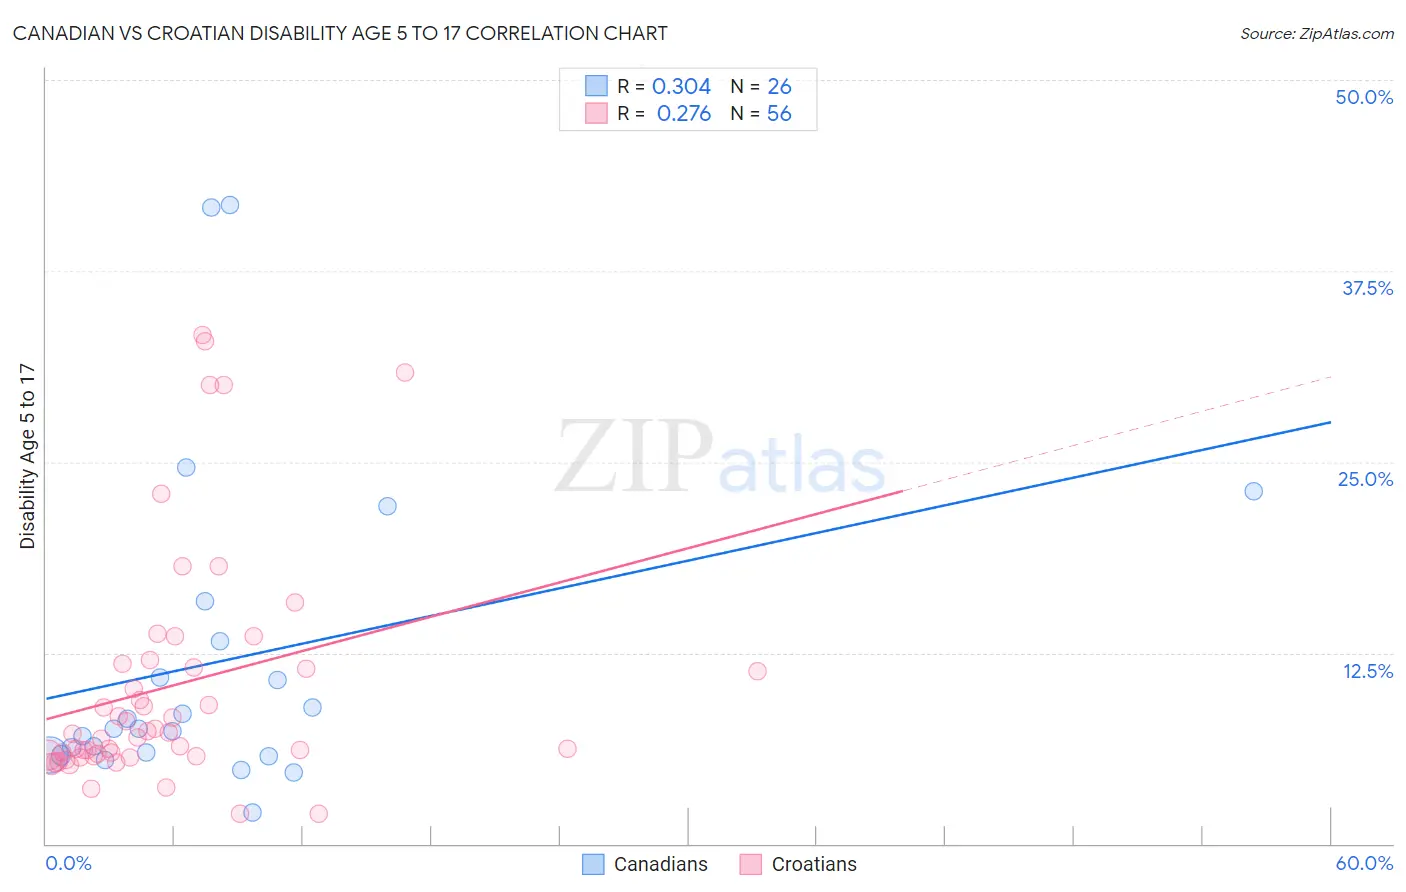
Canadian vs Croatian Disability Age 5 to 17 Correlation Chart
The statistical analysis conducted on geographies consisting of 432,656,335 people shows a mild positive correlation between the proportion of Canadians and percentage of population with a disability between the ages 5 and 17 in the United States with a correlation coefficient (R) of 0.304 and weighted average of 6.0%. Similarly, the statistical analysis conducted on geographies consisting of 372,001,330 people shows a weak positive correlation between the proportion of Croatians and percentage of population with a disability between the ages 5 and 17 in the United States with a correlation coefficient (R) of 0.276 and weighted average of 5.7%, a difference of 4.8%.
Disability Age 5 to 17 Correlation Summary
| Measurement | Canadian | Croatian |
| Minimum | 2.1% | 2.0% |
| Maximum | 41.8% | 33.3% |
| Range | 39.7% | 31.3% |
| Mean | 12.0% | 10.3% |
| Median | 7.5% | 7.2% |
| Interquartile 25% (IQ1) | 5.8% | 5.8% |
| Interquartile 75% (IQ3) | 13.2% | 11.6% |
| Interquartile Range (IQR) | 7.4% | 5.9% |
| Standard Deviation (Sample) | 10.5% | 7.8% |
| Standard Deviation (Population) | 10.3% | 7.7% |
Similar Demographics by Disability Age 5 to 17
Demographics Similar to Canadians by Disability Age 5 to 17
In terms of disability age 5 to 17, the demographic groups most similar to Canadians are Panamanian (6.0%, a difference of 0.070%), Slovene (6.0%, a difference of 0.10%), Czechoslovakian (5.9%, a difference of 0.12%), Immigrants from Western Africa (5.9%, a difference of 0.20%), and Spanish (6.0%, a difference of 0.21%).
| Demographics | Rating | Rank | Disability Age 5 to 17 |
| Hispanics or Latinos | 1.0 /100 | #257 | Tragic 5.9% |
| Brazilians | 0.9 /100 | #258 | Tragic 5.9% |
| Slavs | 0.9 /100 | #259 | Tragic 5.9% |
| Somalis | 0.8 /100 | #260 | Tragic 5.9% |
| Immigrants | Middle Africa | 0.7 /100 | #261 | Tragic 5.9% |
| Immigrants | Western Africa | 0.7 /100 | #262 | Tragic 5.9% |
| Czechoslovakians | 0.7 /100 | #263 | Tragic 5.9% |
| Canadians | 0.6 /100 | #264 | Tragic 6.0% |
| Panamanians | 0.6 /100 | #265 | Tragic 6.0% |
| Slovenes | 0.6 /100 | #266 | Tragic 6.0% |
| Spanish | 0.5 /100 | #267 | Tragic 6.0% |
| Sioux | 0.4 /100 | #268 | Tragic 6.0% |
| Liberians | 0.4 /100 | #269 | Tragic 6.0% |
| Immigrants | Somalia | 0.4 /100 | #270 | Tragic 6.0% |
| Immigrants | Zaire | 0.2 /100 | #271 | Tragic 6.0% |
Demographics Similar to Croatians by Disability Age 5 to 17
In terms of disability age 5 to 17, the demographic groups most similar to Croatians are Immigrants from Nigeria (5.7%, a difference of 0.010%), Inupiat (5.7%, a difference of 0.020%), Immigrants from North America (5.7%, a difference of 0.030%), Immigrants from Canada (5.7%, a difference of 0.16%), and Immigrants from Bosnia and Herzegovina (5.7%, a difference of 0.17%).
| Demographics | Rating | Rank | Disability Age 5 to 17 |
| Immigrants | Thailand | 30.2 /100 | #187 | Fair 5.7% |
| Marshallese | 28.1 /100 | #188 | Fair 5.7% |
| Pueblo | 27.5 /100 | #189 | Fair 5.7% |
| Immigrants | Eastern Africa | 27.3 /100 | #190 | Fair 5.7% |
| Danes | 26.5 /100 | #191 | Fair 5.7% |
| Immigrants | Bosnia and Herzegovina | 26.3 /100 | #192 | Fair 5.7% |
| Immigrants | Canada | 26.1 /100 | #193 | Fair 5.7% |
| Croatians | 23.6 /100 | #194 | Fair 5.7% |
| Immigrants | Nigeria | 23.4 /100 | #195 | Fair 5.7% |
| Inupiat | 23.3 /100 | #196 | Fair 5.7% |
| Immigrants | North America | 23.1 /100 | #197 | Fair 5.7% |
| Norwegians | 20.9 /100 | #198 | Fair 5.7% |
| Northern Europeans | 15.2 /100 | #199 | Poor 5.7% |
| Icelanders | 14.6 /100 | #200 | Poor 5.7% |
| Basques | 13.7 /100 | #201 | Poor 5.7% |