Canadian vs Scandinavian Female Unemployment
COMPARE
Canadian
Scandinavian
Female Unemployment
Female Unemployment Comparison
Canadians
Scandinavians
5.0%
FEMALE UNEMPLOYMENT
97.2/ 100
METRIC RATING
84th/ 347
METRIC RANK
4.6%
FEMALE UNEMPLOYMENT
100.0/ 100
METRIC RATING
11th/ 347
METRIC RANK
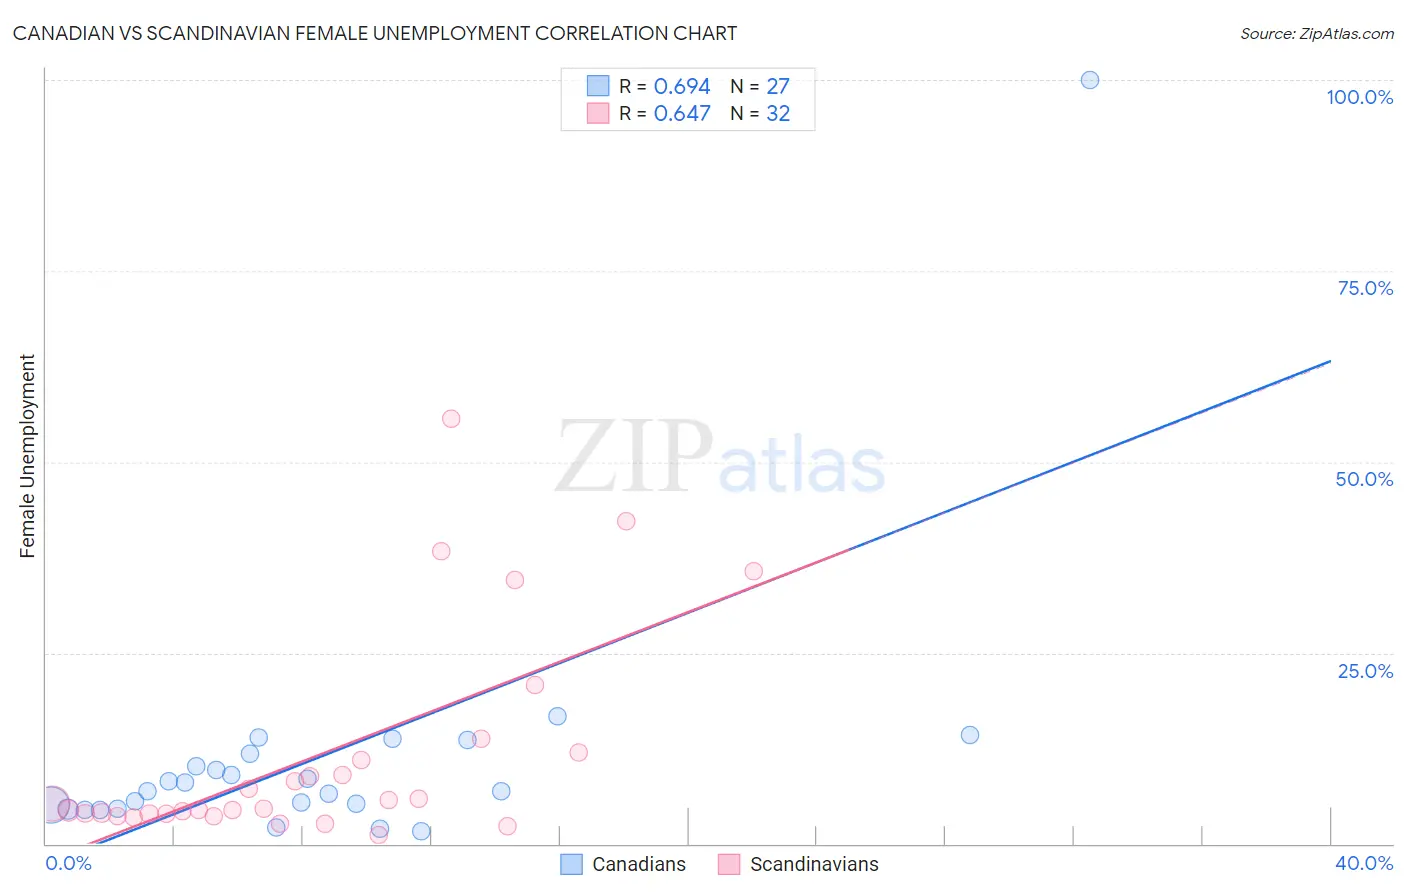
Canadian vs Scandinavian Female Unemployment Correlation Chart
The statistical analysis conducted on geographies consisting of 433,816,677 people shows a significant positive correlation between the proportion of Canadians and unemploymnet rate among females in the United States with a correlation coefficient (R) of 0.694 and weighted average of 5.0%. Similarly, the statistical analysis conducted on geographies consisting of 466,355,469 people shows a significant positive correlation between the proportion of Scandinavians and unemploymnet rate among females in the United States with a correlation coefficient (R) of 0.647 and weighted average of 4.6%, a difference of 9.1%.
Female Unemployment Correlation Summary
| Measurement | Canadian | Scandinavian |
| Minimum | 1.7% | 1.2% |
| Maximum | 100.0% | 55.6% |
| Range | 98.3% | 54.4% |
| Mean | 11.2% | 11.6% |
| Median | 6.9% | 4.9% |
| Interquartile 25% (IQ1) | 4.5% | 3.9% |
| Interquartile 75% (IQ3) | 11.8% | 11.5% |
| Interquartile Range (IQR) | 7.2% | 7.6% |
| Standard Deviation (Sample) | 18.2% | 13.9% |
| Standard Deviation (Population) | 17.9% | 13.7% |
Similar Demographics by Female Unemployment
Demographics Similar to Canadians by Female Unemployment
In terms of female unemployment, the demographic groups most similar to Canadians are Immigrants from Serbia (5.0%, a difference of 0.040%), Ukrainian (5.0%, a difference of 0.040%), Immigrants from Australia (5.0%, a difference of 0.050%), Bolivian (5.0%, a difference of 0.050%), and Filipino (5.0%, a difference of 0.10%).
| Demographics | Rating | Rank | Female Unemployment |
| Mongolians | 97.8 /100 | #77 | Exceptional 5.0% |
| Immigrants | Netherlands | 97.8 /100 | #78 | Exceptional 5.0% |
| Turks | 97.6 /100 | #79 | Exceptional 5.0% |
| New Zealanders | 97.4 /100 | #80 | Exceptional 5.0% |
| Filipinos | 97.3 /100 | #81 | Exceptional 5.0% |
| Immigrants | Australia | 97.3 /100 | #82 | Exceptional 5.0% |
| Immigrants | Serbia | 97.2 /100 | #83 | Exceptional 5.0% |
| Canadians | 97.2 /100 | #84 | Exceptional 5.0% |
| Ukrainians | 97.1 /100 | #85 | Exceptional 5.0% |
| Bolivians | 97.1 /100 | #86 | Exceptional 5.0% |
| Venezuelans | 96.9 /100 | #87 | Exceptional 5.0% |
| Immigrants | Sudan | 96.7 /100 | #88 | Exceptional 5.0% |
| Immigrants | Taiwan | 96.6 /100 | #89 | Exceptional 5.0% |
| Immigrants | Sweden | 96.3 /100 | #90 | Exceptional 5.0% |
| Immigrants | Japan | 96.0 /100 | #91 | Exceptional 5.0% |
Demographics Similar to Scandinavians by Female Unemployment
In terms of female unemployment, the demographic groups most similar to Scandinavians are Swiss (4.6%, a difference of 0.11%), Dutch (4.6%, a difference of 0.59%), Belgian (4.6%, a difference of 0.75%), Finnish (4.6%, a difference of 1.3%), and Slovene (4.5%, a difference of 1.4%).
| Demographics | Rating | Rank | Female Unemployment |
| Danes | 100.0 /100 | #4 | Exceptional 4.4% |
| Hmong | 100.0 /100 | #5 | Exceptional 4.4% |
| Swedes | 100.0 /100 | #6 | Exceptional 4.4% |
| Chinese | 100.0 /100 | #7 | Exceptional 4.5% |
| Germans | 100.0 /100 | #8 | Exceptional 4.5% |
| Slovenes | 100.0 /100 | #9 | Exceptional 4.5% |
| Swiss | 100.0 /100 | #10 | Exceptional 4.6% |
| Scandinavians | 100.0 /100 | #11 | Exceptional 4.6% |
| Dutch | 100.0 /100 | #12 | Exceptional 4.6% |
| Belgians | 100.0 /100 | #13 | Exceptional 4.6% |
| Finns | 100.0 /100 | #14 | Exceptional 4.6% |
| English | 100.0 /100 | #15 | Exceptional 4.6% |
| Carpatho Rusyns | 99.9 /100 | #16 | Exceptional 4.7% |
| Croatians | 99.9 /100 | #17 | Exceptional 4.7% |
| Latvians | 99.9 /100 | #18 | Exceptional 4.7% |