Crow vs Scandinavian Disability Age 5 to 17
COMPARE
Crow
Scandinavian
Disability Age 5 to 17
Disability Age 5 to 17 Comparison
Crow
Scandinavians
5.4%
DISABILITY AGE 5 TO 17
95.0/ 100
METRIC RATING
124th/ 347
METRIC RANK
5.9%
DISABILITY AGE 5 TO 17
1.4/ 100
METRIC RATING
253rd/ 347
METRIC RANK
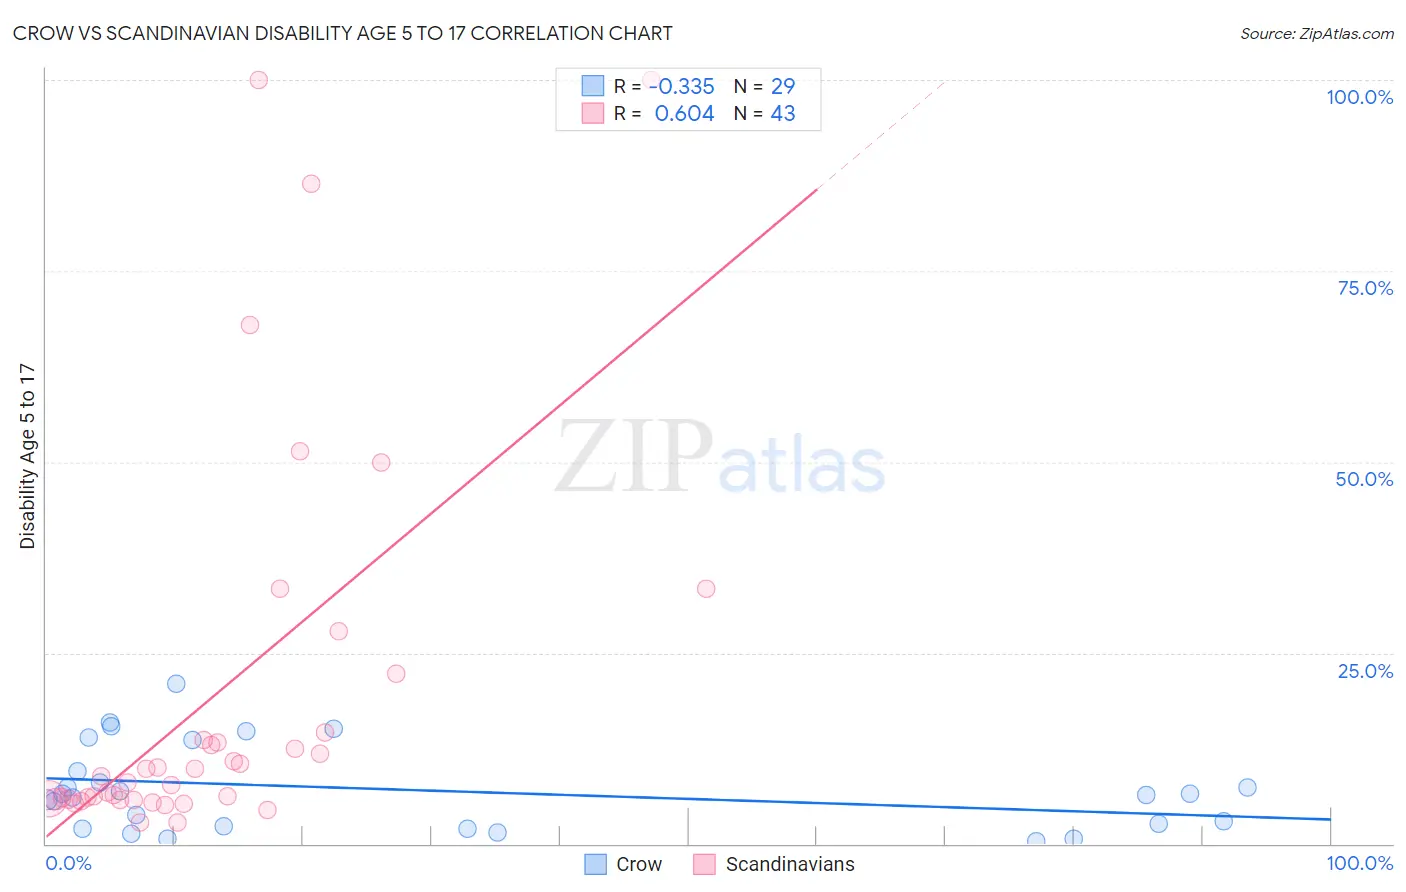
Crow vs Scandinavian Disability Age 5 to 17 Correlation Chart
The statistical analysis conducted on geographies consisting of 59,063,912 people shows a mild negative correlation between the proportion of Crow and percentage of population with a disability between the ages 5 and 17 in the United States with a correlation coefficient (R) of -0.335 and weighted average of 5.4%. Similarly, the statistical analysis conducted on geographies consisting of 465,927,365 people shows a significant positive correlation between the proportion of Scandinavians and percentage of population with a disability between the ages 5 and 17 in the United States with a correlation coefficient (R) of 0.604 and weighted average of 5.9%, a difference of 9.2%.
Disability Age 5 to 17 Correlation Summary
| Measurement | Crow | Scandinavian |
| Minimum | 0.26% | 2.7% |
| Maximum | 20.9% | 100.0% |
| Range | 20.6% | 97.3% |
| Mean | 7.1% | 19.3% |
| Median | 6.4% | 8.8% |
| Interquartile 25% (IQ1) | 2.1% | 5.8% |
| Interquartile 75% (IQ3) | 11.6% | 14.5% |
| Interquartile Range (IQR) | 9.4% | 8.7% |
| Standard Deviation (Sample) | 5.6% | 25.4% |
| Standard Deviation (Population) | 5.5% | 25.1% |
Similar Demographics by Disability Age 5 to 17
Demographics Similar to Crow by Disability Age 5 to 17
In terms of disability age 5 to 17, the demographic groups most similar to Crow are Immigrants from Chile (5.4%, a difference of 0.010%), New Zealander (5.4%, a difference of 0.020%), Latvian (5.4%, a difference of 0.030%), Immigrants from Ethiopia (5.4%, a difference of 0.13%), and Immigrants from Venezuela (5.4%, a difference of 0.14%).
| Demographics | Rating | Rank | Disability Age 5 to 17 |
| Immigrants | Afghanistan | 97.4 /100 | #117 | Exceptional 5.3% |
| South Americans | 97.1 /100 | #118 | Exceptional 5.4% |
| Immigrants | South America | 97.1 /100 | #119 | Exceptional 5.4% |
| Immigrants | Immigrants | 97.0 /100 | #120 | Exceptional 5.4% |
| Maltese | 96.0 /100 | #121 | Exceptional 5.4% |
| Chileans | 95.8 /100 | #122 | Exceptional 5.4% |
| Immigrants | Ethiopia | 95.5 /100 | #123 | Exceptional 5.4% |
| Crow | 95.0 /100 | #124 | Exceptional 5.4% |
| Immigrants | Chile | 95.0 /100 | #125 | Exceptional 5.4% |
| New Zealanders | 95.0 /100 | #126 | Exceptional 5.4% |
| Latvians | 95.0 /100 | #127 | Exceptional 5.4% |
| Immigrants | Venezuela | 94.5 /100 | #128 | Exceptional 5.4% |
| Romanians | 94.1 /100 | #129 | Exceptional 5.4% |
| Immigrants | Bulgaria | 94.0 /100 | #130 | Exceptional 5.4% |
| Arabs | 92.9 /100 | #131 | Exceptional 5.4% |
Demographics Similar to Scandinavians by Disability Age 5 to 17
In terms of disability age 5 to 17, the demographic groups most similar to Scandinavians are Honduran (5.9%, a difference of 0.070%), Immigrants from Cambodia (5.9%, a difference of 0.090%), Barbadian (5.9%, a difference of 0.10%), Polish (5.9%, a difference of 0.11%), and Italian (5.9%, a difference of 0.17%).
| Demographics | Rating | Rank | Disability Age 5 to 17 |
| Tlingit-Haida | 1.9 /100 | #246 | Tragic 5.9% |
| Immigrants | Honduras | 1.8 /100 | #247 | Tragic 5.9% |
| British | 1.7 /100 | #248 | Tragic 5.9% |
| Immigrants | Ghana | 1.7 /100 | #249 | Tragic 5.9% |
| Poles | 1.5 /100 | #250 | Tragic 5.9% |
| Immigrants | Cambodia | 1.5 /100 | #251 | Tragic 5.9% |
| Hondurans | 1.5 /100 | #252 | Tragic 5.9% |
| Scandinavians | 1.4 /100 | #253 | Tragic 5.9% |
| Barbadians | 1.3 /100 | #254 | Tragic 5.9% |
| Italians | 1.2 /100 | #255 | Tragic 5.9% |
| Hopi | 1.0 /100 | #256 | Tragic 5.9% |
| Hispanics or Latinos | 1.0 /100 | #257 | Tragic 5.9% |
| Brazilians | 0.9 /100 | #258 | Tragic 5.9% |
| Slavs | 0.9 /100 | #259 | Tragic 5.9% |
| Somalis | 0.8 /100 | #260 | Tragic 5.9% |