Bolivian vs Dutch West Indian Disability
COMPARE
Bolivian
Dutch West Indian
Disability
Disability Comparison
Bolivians
Dutch West Indians
10.0%
DISABILITY
100.0/ 100
METRIC RATING
8th/ 347
METRIC RANK
14.9%
DISABILITY
0.0/ 100
METRIC RATING
338th/ 347
METRIC RANK
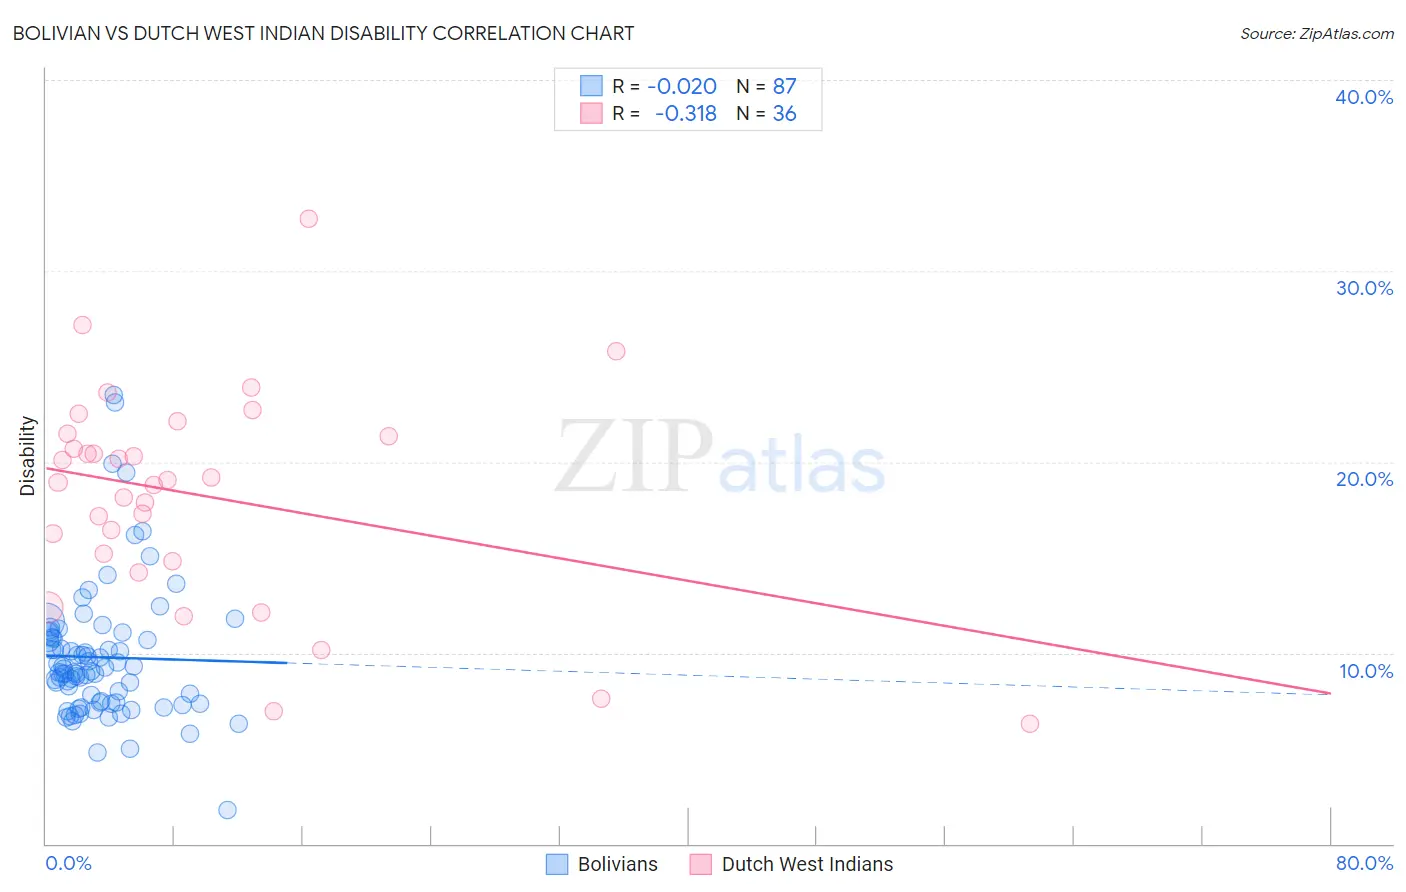
Bolivian vs Dutch West Indian Disability Correlation Chart
The statistical analysis conducted on geographies consisting of 184,660,652 people shows no correlation between the proportion of Bolivians and percentage of population with a disability in the United States with a correlation coefficient (R) of -0.020 and weighted average of 10.0%. Similarly, the statistical analysis conducted on geographies consisting of 85,770,416 people shows a mild negative correlation between the proportion of Dutch West Indians and percentage of population with a disability in the United States with a correlation coefficient (R) of -0.318 and weighted average of 14.9%, a difference of 49.0%.
Disability Correlation Summary
| Measurement | Bolivian | Dutch West Indian |
| Minimum | 1.7% | 6.3% |
| Maximum | 23.5% | 32.7% |
| Range | 21.8% | 26.4% |
| Mean | 9.8% | 18.2% |
| Median | 9.1% | 19.0% |
| Interquartile 25% (IQ1) | 7.4% | 15.0% |
| Interquartile 75% (IQ3) | 10.8% | 21.4% |
| Interquartile Range (IQR) | 3.4% | 6.4% |
| Standard Deviation (Sample) | 3.6% | 5.7% |
| Standard Deviation (Population) | 3.5% | 5.6% |
Similar Demographics by Disability
Demographics Similar to Bolivians by Disability
In terms of disability, the demographic groups most similar to Bolivians are Immigrants from Singapore (10.0%, a difference of 0.23%), Immigrants from Hong Kong (10.0%, a difference of 0.30%), Immigrants from South Central Asia (9.9%, a difference of 0.54%), Immigrants from China (10.1%, a difference of 1.1%), and Iranian (10.1%, a difference of 1.1%).
| Demographics | Rating | Rank | Disability |
| Immigrants | India | 100.0 /100 | #1 | Exceptional 9.5% |
| Filipinos | 100.0 /100 | #2 | Exceptional 9.6% |
| Immigrants | Taiwan | 100.0 /100 | #3 | Exceptional 9.6% |
| Thais | 100.0 /100 | #4 | Exceptional 9.7% |
| Immigrants | Bolivia | 100.0 /100 | #5 | Exceptional 9.9% |
| Immigrants | South Central Asia | 100.0 /100 | #6 | Exceptional 9.9% |
| Immigrants | Singapore | 100.0 /100 | #7 | Exceptional 10.0% |
| Bolivians | 100.0 /100 | #8 | Exceptional 10.0% |
| Immigrants | Hong Kong | 100.0 /100 | #9 | Exceptional 10.0% |
| Immigrants | China | 100.0 /100 | #10 | Exceptional 10.1% |
| Iranians | 100.0 /100 | #11 | Exceptional 10.1% |
| Immigrants | Israel | 100.0 /100 | #12 | Exceptional 10.1% |
| Immigrants | Eastern Asia | 100.0 /100 | #13 | Exceptional 10.2% |
| Immigrants | Korea | 100.0 /100 | #14 | Exceptional 10.2% |
| Okinawans | 100.0 /100 | #15 | Exceptional 10.3% |
Demographics Similar to Dutch West Indians by Disability
In terms of disability, the demographic groups most similar to Dutch West Indians are Seminole (14.9%, a difference of 0.30%), Cherokee (14.8%, a difference of 0.39%), Tohono O'odham (14.8%, a difference of 0.91%), Chickasaw (15.2%, a difference of 1.8%), and Yuman (14.6%, a difference of 1.9%).
| Demographics | Rating | Rank | Disability |
| Alaskan Athabascans | 0.0 /100 | #331 | Tragic 14.4% |
| Pueblo | 0.0 /100 | #332 | Tragic 14.4% |
| Cajuns | 0.0 /100 | #333 | Tragic 14.6% |
| Yuman | 0.0 /100 | #334 | Tragic 14.6% |
| Tohono O'odham | 0.0 /100 | #335 | Tragic 14.8% |
| Cherokee | 0.0 /100 | #336 | Tragic 14.8% |
| Seminole | 0.0 /100 | #337 | Tragic 14.9% |
| Dutch West Indians | 0.0 /100 | #338 | Tragic 14.9% |
| Chickasaw | 0.0 /100 | #339 | Tragic 15.2% |
| Choctaw | 0.0 /100 | #340 | Tragic 15.4% |
| Lumbee | 0.0 /100 | #341 | Tragic 15.5% |
| Kiowa | 0.0 /100 | #342 | Tragic 15.6% |
| Creek | 0.0 /100 | #343 | Tragic 15.6% |
| Colville | 0.0 /100 | #344 | Tragic 15.8% |
| Puerto Ricans | 0.0 /100 | #345 | Tragic 16.1% |