Bolivian vs Czechoslovakian Disability
COMPARE
Bolivian
Czechoslovakian
Disability
Disability Comparison
Bolivians
Czechoslovakians
10.0%
DISABILITY
100.0/ 100
METRIC RATING
8th/ 347
METRIC RANK
12.5%
DISABILITY
0.2/ 100
METRIC RATING
266th/ 347
METRIC RANK
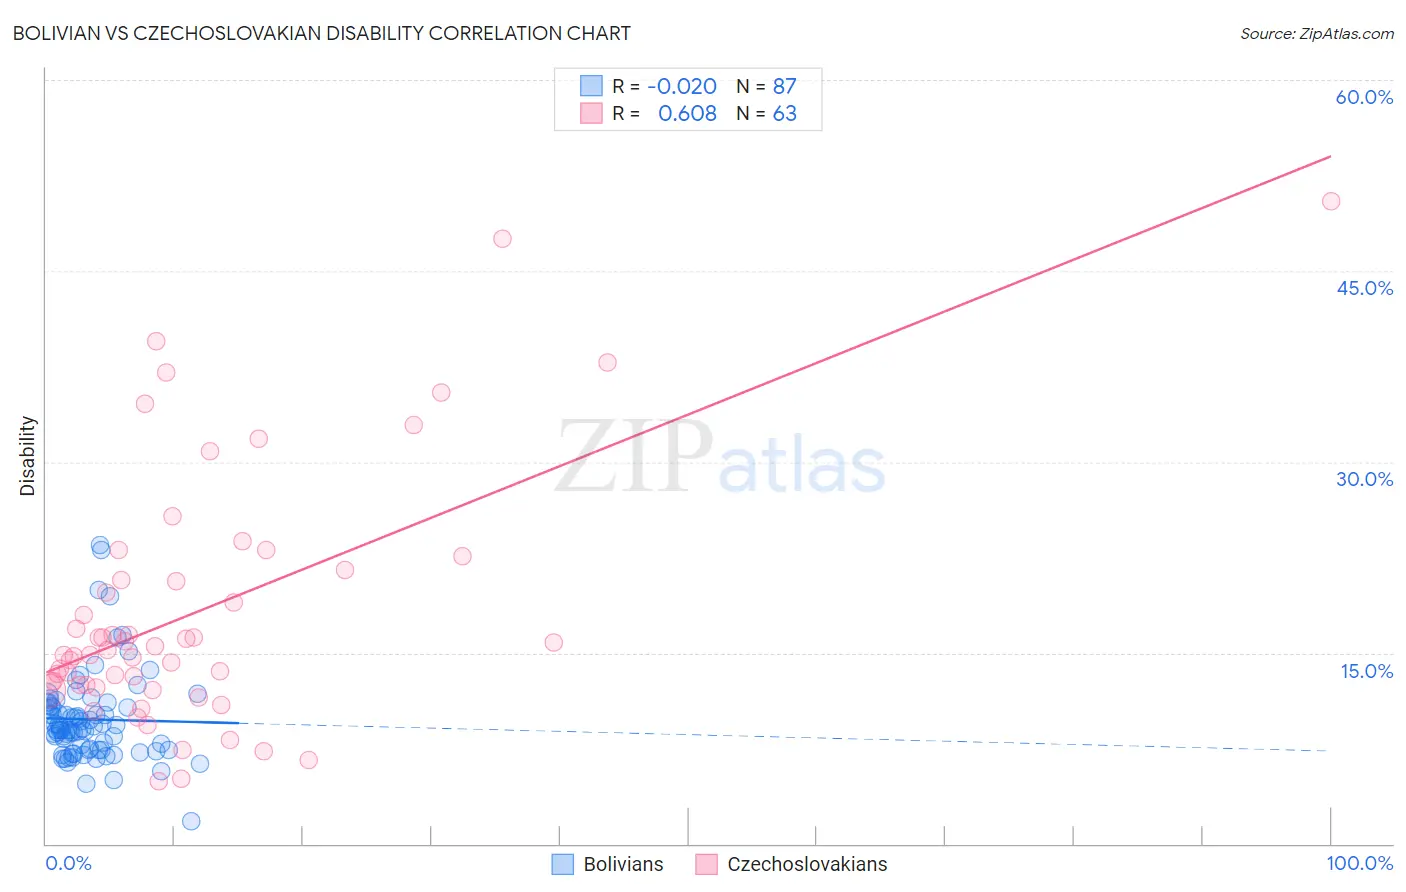
Bolivian vs Czechoslovakian Disability Correlation Chart
The statistical analysis conducted on geographies consisting of 184,660,652 people shows no correlation between the proportion of Bolivians and percentage of population with a disability in the United States with a correlation coefficient (R) of -0.020 and weighted average of 10.0%. Similarly, the statistical analysis conducted on geographies consisting of 368,659,957 people shows a significant positive correlation between the proportion of Czechoslovakians and percentage of population with a disability in the United States with a correlation coefficient (R) of 0.608 and weighted average of 12.5%, a difference of 25.1%.
Disability Correlation Summary
| Measurement | Bolivian | Czechoslovakian |
| Minimum | 1.7% | 5.0% |
| Maximum | 23.5% | 50.5% |
| Range | 21.8% | 45.5% |
| Mean | 9.8% | 18.3% |
| Median | 9.1% | 15.2% |
| Interquartile 25% (IQ1) | 7.4% | 12.5% |
| Interquartile 75% (IQ3) | 10.8% | 21.6% |
| Interquartile Range (IQR) | 3.4% | 9.0% |
| Standard Deviation (Sample) | 3.6% | 9.9% |
| Standard Deviation (Population) | 3.5% | 9.8% |
Similar Demographics by Disability
Demographics Similar to Bolivians by Disability
In terms of disability, the demographic groups most similar to Bolivians are Immigrants from Singapore (10.0%, a difference of 0.23%), Immigrants from Hong Kong (10.0%, a difference of 0.30%), Immigrants from South Central Asia (9.9%, a difference of 0.54%), Immigrants from China (10.1%, a difference of 1.1%), and Iranian (10.1%, a difference of 1.1%).
| Demographics | Rating | Rank | Disability |
| Immigrants | India | 100.0 /100 | #1 | Exceptional 9.5% |
| Filipinos | 100.0 /100 | #2 | Exceptional 9.6% |
| Immigrants | Taiwan | 100.0 /100 | #3 | Exceptional 9.6% |
| Thais | 100.0 /100 | #4 | Exceptional 9.7% |
| Immigrants | Bolivia | 100.0 /100 | #5 | Exceptional 9.9% |
| Immigrants | South Central Asia | 100.0 /100 | #6 | Exceptional 9.9% |
| Immigrants | Singapore | 100.0 /100 | #7 | Exceptional 10.0% |
| Bolivians | 100.0 /100 | #8 | Exceptional 10.0% |
| Immigrants | Hong Kong | 100.0 /100 | #9 | Exceptional 10.0% |
| Immigrants | China | 100.0 /100 | #10 | Exceptional 10.1% |
| Iranians | 100.0 /100 | #11 | Exceptional 10.1% |
| Immigrants | Israel | 100.0 /100 | #12 | Exceptional 10.1% |
| Immigrants | Eastern Asia | 100.0 /100 | #13 | Exceptional 10.2% |
| Immigrants | Korea | 100.0 /100 | #14 | Exceptional 10.2% |
| Okinawans | 100.0 /100 | #15 | Exceptional 10.3% |
Demographics Similar to Czechoslovakians by Disability
In terms of disability, the demographic groups most similar to Czechoslovakians are Spaniard (12.5%, a difference of 0.070%), U.S. Virgin Islander (12.5%, a difference of 0.16%), Immigrants from Germany (12.5%, a difference of 0.18%), Hawaiian (12.5%, a difference of 0.29%), and Bangladeshi (12.6%, a difference of 0.40%).
| Demographics | Rating | Rank | Disability |
| Canadians | 0.4 /100 | #259 | Tragic 12.4% |
| Immigrants | Liberia | 0.4 /100 | #260 | Tragic 12.4% |
| Scandinavians | 0.4 /100 | #261 | Tragic 12.4% |
| Native Hawaiians | 0.3 /100 | #262 | Tragic 12.5% |
| Hawaiians | 0.2 /100 | #263 | Tragic 12.5% |
| Immigrants | Germany | 0.2 /100 | #264 | Tragic 12.5% |
| U.S. Virgin Islanders | 0.2 /100 | #265 | Tragic 12.5% |
| Czechoslovakians | 0.2 /100 | #266 | Tragic 12.5% |
| Spaniards | 0.2 /100 | #267 | Tragic 12.5% |
| Bangladeshis | 0.1 /100 | #268 | Tragic 12.6% |
| Immigrants | Dominican Republic | 0.1 /100 | #269 | Tragic 12.6% |
| Portuguese | 0.1 /100 | #270 | Tragic 12.6% |
| Immigrants | Yemen | 0.1 /100 | #271 | Tragic 12.6% |
| Dominicans | 0.0 /100 | #272 | Tragic 12.7% |
| Finns | 0.0 /100 | #273 | Tragic 12.7% |