Trinidadian and Tobagonian vs Dutch West Indian Disability
COMPARE
Trinidadian and Tobagonian
Dutch West Indian
Disability
Disability Comparison
Trinidadians and Tobagonians
Dutch West Indians
11.7%
DISABILITY
52.7/ 100
METRIC RATING
172nd/ 347
METRIC RANK
14.9%
DISABILITY
0.0/ 100
METRIC RATING
338th/ 347
METRIC RANK
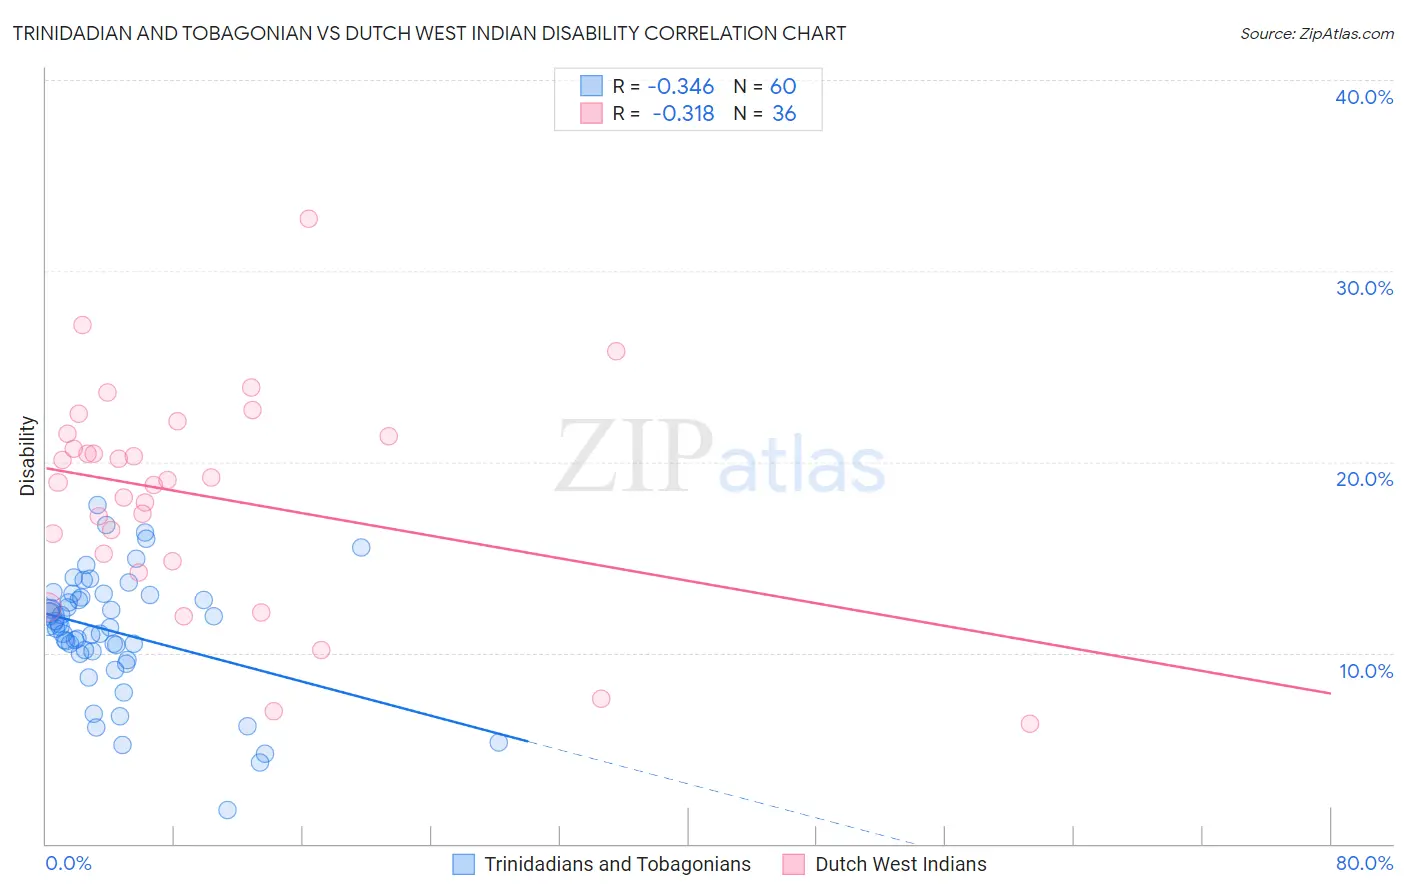
Trinidadian and Tobagonian vs Dutch West Indian Disability Correlation Chart
The statistical analysis conducted on geographies consisting of 219,849,540 people shows a mild negative correlation between the proportion of Trinidadians and Tobagonians and percentage of population with a disability in the United States with a correlation coefficient (R) of -0.346 and weighted average of 11.7%. Similarly, the statistical analysis conducted on geographies consisting of 85,770,416 people shows a mild negative correlation between the proportion of Dutch West Indians and percentage of population with a disability in the United States with a correlation coefficient (R) of -0.318 and weighted average of 14.9%, a difference of 27.5%.
Disability Correlation Summary
| Measurement | Trinidadian and Tobagonian | Dutch West Indian |
| Minimum | 1.7% | 6.3% |
| Maximum | 17.7% | 32.7% |
| Range | 16.0% | 26.4% |
| Mean | 11.1% | 18.2% |
| Median | 11.4% | 19.0% |
| Interquartile 25% (IQ1) | 10.0% | 15.0% |
| Interquartile 75% (IQ3) | 13.0% | 21.4% |
| Interquartile Range (IQR) | 2.9% | 6.4% |
| Standard Deviation (Sample) | 3.2% | 5.7% |
| Standard Deviation (Population) | 3.2% | 5.6% |
Similar Demographics by Disability
Demographics Similar to Trinidadians and Tobagonians by Disability
In terms of disability, the demographic groups most similar to Trinidadians and Tobagonians are Immigrants from Albania (11.7%, a difference of 0.010%), Immigrants from Southern Europe (11.7%, a difference of 0.010%), Immigrants from Austria (11.7%, a difference of 0.030%), Immigrants from Latin America (11.7%, a difference of 0.060%), and Estonian (11.7%, a difference of 0.080%).
| Demographics | Rating | Rank | Disability |
| Cubans | 56.7 /100 | #165 | Average 11.7% |
| Pakistanis | 54.7 /100 | #166 | Average 11.7% |
| Estonians | 54.4 /100 | #167 | Average 11.7% |
| Immigrants | Latin America | 54.1 /100 | #168 | Average 11.7% |
| Immigrants | Austria | 53.4 /100 | #169 | Average 11.7% |
| Immigrants | Albania | 52.8 /100 | #170 | Average 11.7% |
| Immigrants | Southern Europe | 52.8 /100 | #171 | Average 11.7% |
| Trinidadians and Tobagonians | 52.7 /100 | #172 | Average 11.7% |
| Maltese | 50.6 /100 | #173 | Average 11.7% |
| Albanians | 50.0 /100 | #174 | Average 11.7% |
| Haitians | 48.6 /100 | #175 | Average 11.7% |
| Immigrants | Western Africa | 47.5 /100 | #176 | Average 11.7% |
| Immigrants | Central America | 46.6 /100 | #177 | Average 11.7% |
| Greeks | 46.2 /100 | #178 | Average 11.7% |
| Immigrants | Armenia | 41.9 /100 | #179 | Average 11.7% |
Demographics Similar to Dutch West Indians by Disability
In terms of disability, the demographic groups most similar to Dutch West Indians are Seminole (14.9%, a difference of 0.30%), Cherokee (14.8%, a difference of 0.39%), Tohono O'odham (14.8%, a difference of 0.91%), Chickasaw (15.2%, a difference of 1.8%), and Yuman (14.6%, a difference of 1.9%).
| Demographics | Rating | Rank | Disability |
| Alaskan Athabascans | 0.0 /100 | #331 | Tragic 14.4% |
| Pueblo | 0.0 /100 | #332 | Tragic 14.4% |
| Cajuns | 0.0 /100 | #333 | Tragic 14.6% |
| Yuman | 0.0 /100 | #334 | Tragic 14.6% |
| Tohono O'odham | 0.0 /100 | #335 | Tragic 14.8% |
| Cherokee | 0.0 /100 | #336 | Tragic 14.8% |
| Seminole | 0.0 /100 | #337 | Tragic 14.9% |
| Dutch West Indians | 0.0 /100 | #338 | Tragic 14.9% |
| Chickasaw | 0.0 /100 | #339 | Tragic 15.2% |
| Choctaw | 0.0 /100 | #340 | Tragic 15.4% |
| Lumbee | 0.0 /100 | #341 | Tragic 15.5% |
| Kiowa | 0.0 /100 | #342 | Tragic 15.6% |
| Creek | 0.0 /100 | #343 | Tragic 15.6% |
| Colville | 0.0 /100 | #344 | Tragic 15.8% |
| Puerto Ricans | 0.0 /100 | #345 | Tragic 16.1% |