Bolivian vs Northern European Disability
COMPARE
Bolivian
Northern European
Disability
Disability Comparison
Bolivians
Northern Europeans
10.0%
DISABILITY
100.0/ 100
METRIC RATING
8th/ 347
METRIC RANK
12.1%
DISABILITY
4.2/ 100
METRIC RATING
221st/ 347
METRIC RANK
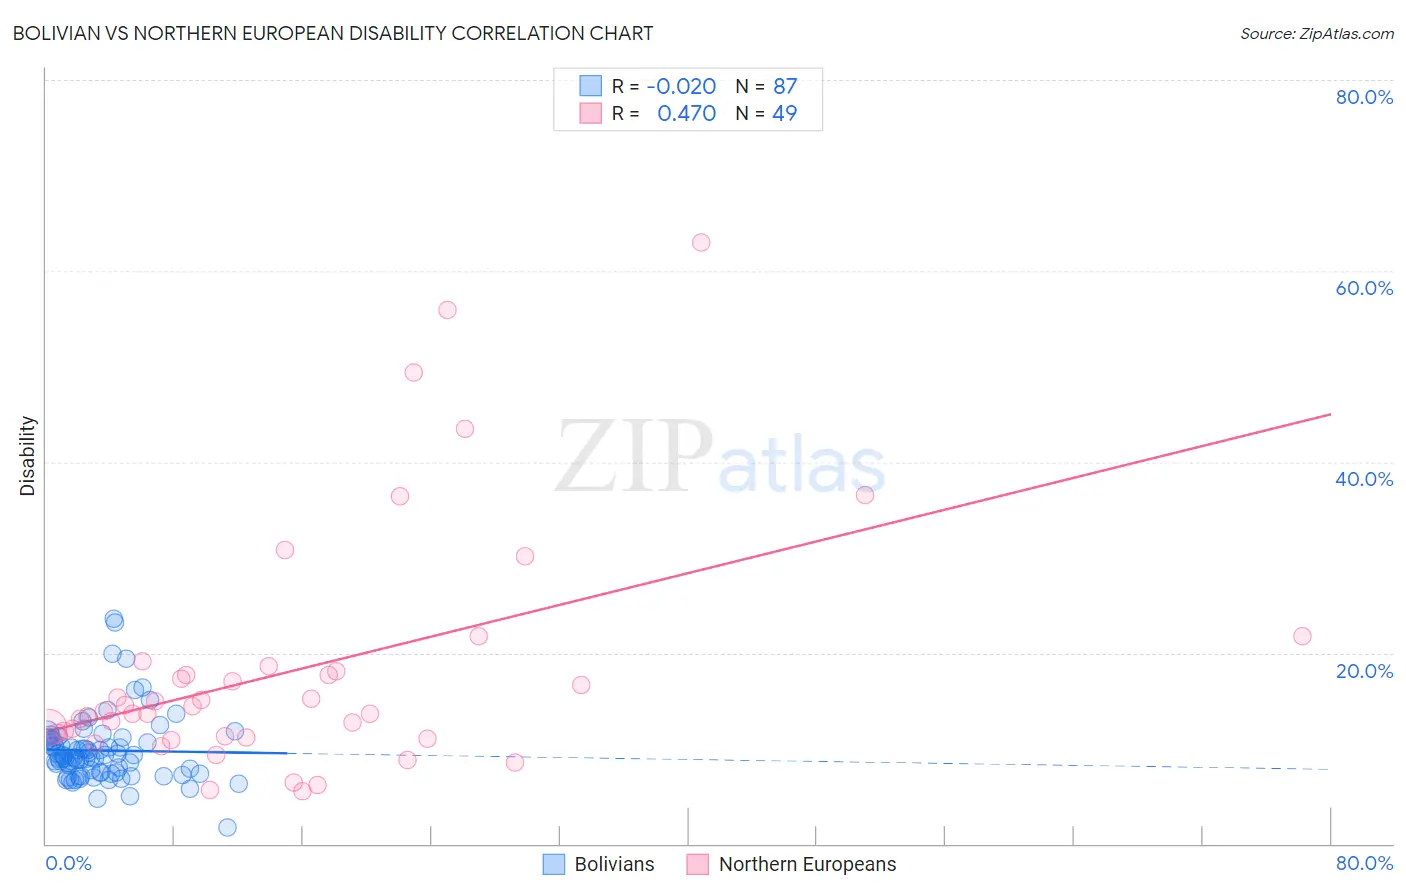
Bolivian vs Northern European Disability Correlation Chart
The statistical analysis conducted on geographies consisting of 184,660,652 people shows no correlation between the proportion of Bolivians and percentage of population with a disability in the United States with a correlation coefficient (R) of -0.020 and weighted average of 10.0%. Similarly, the statistical analysis conducted on geographies consisting of 406,050,412 people shows a moderate positive correlation between the proportion of Northern Europeans and percentage of population with a disability in the United States with a correlation coefficient (R) of 0.470 and weighted average of 12.1%, a difference of 21.0%.
Disability Correlation Summary
| Measurement | Bolivian | Northern European |
| Minimum | 1.7% | 5.4% |
| Maximum | 23.5% | 63.0% |
| Range | 21.8% | 57.5% |
| Mean | 9.8% | 18.2% |
| Median | 9.1% | 13.8% |
| Interquartile 25% (IQ1) | 7.4% | 11.2% |
| Interquartile 75% (IQ3) | 10.8% | 18.3% |
| Interquartile Range (IQR) | 3.4% | 7.1% |
| Standard Deviation (Sample) | 3.6% | 12.6% |
| Standard Deviation (Population) | 3.5% | 12.5% |
Similar Demographics by Disability
Demographics Similar to Bolivians by Disability
In terms of disability, the demographic groups most similar to Bolivians are Immigrants from Singapore (10.0%, a difference of 0.23%), Immigrants from Hong Kong (10.0%, a difference of 0.30%), Immigrants from South Central Asia (9.9%, a difference of 0.54%), Immigrants from China (10.1%, a difference of 1.1%), and Iranian (10.1%, a difference of 1.1%).
| Demographics | Rating | Rank | Disability |
| Immigrants | India | 100.0 /100 | #1 | Exceptional 9.5% |
| Filipinos | 100.0 /100 | #2 | Exceptional 9.6% |
| Immigrants | Taiwan | 100.0 /100 | #3 | Exceptional 9.6% |
| Thais | 100.0 /100 | #4 | Exceptional 9.7% |
| Immigrants | Bolivia | 100.0 /100 | #5 | Exceptional 9.9% |
| Immigrants | South Central Asia | 100.0 /100 | #6 | Exceptional 9.9% |
| Immigrants | Singapore | 100.0 /100 | #7 | Exceptional 10.0% |
| Bolivians | 100.0 /100 | #8 | Exceptional 10.0% |
| Immigrants | Hong Kong | 100.0 /100 | #9 | Exceptional 10.0% |
| Immigrants | China | 100.0 /100 | #10 | Exceptional 10.1% |
| Iranians | 100.0 /100 | #11 | Exceptional 10.1% |
| Immigrants | Israel | 100.0 /100 | #12 | Exceptional 10.1% |
| Immigrants | Eastern Asia | 100.0 /100 | #13 | Exceptional 10.2% |
| Immigrants | Korea | 100.0 /100 | #14 | Exceptional 10.2% |
| Okinawans | 100.0 /100 | #15 | Exceptional 10.3% |
Demographics Similar to Northern Europeans by Disability
In terms of disability, the demographic groups most similar to Northern Europeans are Spanish American Indian (12.1%, a difference of 0.040%), Hispanic or Latino (12.1%, a difference of 0.070%), Immigrants from Bahamas (12.1%, a difference of 0.12%), Mexican (12.1%, a difference of 0.14%), and Croatian (12.1%, a difference of 0.16%).
| Demographics | Rating | Rank | Disability |
| Immigrants | Somalia | 6.8 /100 | #214 | Tragic 12.0% |
| Immigrants | Canada | 6.1 /100 | #215 | Tragic 12.1% |
| Panamanians | 5.4 /100 | #216 | Tragic 12.1% |
| Immigrants | North America | 5.3 /100 | #217 | Tragic 12.1% |
| Immigrants | Jamaica | 5.0 /100 | #218 | Tragic 12.1% |
| Croatians | 4.9 /100 | #219 | Tragic 12.1% |
| Immigrants | Bahamas | 4.7 /100 | #220 | Tragic 12.1% |
| Northern Europeans | 4.2 /100 | #221 | Tragic 12.1% |
| Spanish American Indians | 4.1 /100 | #222 | Tragic 12.1% |
| Hispanics or Latinos | 3.9 /100 | #223 | Tragic 12.1% |
| Mexicans | 3.7 /100 | #224 | Tragic 12.1% |
| Senegalese | 3.5 /100 | #225 | Tragic 12.1% |
| Jamaicans | 3.3 /100 | #226 | Tragic 12.1% |
| Alsatians | 3.3 /100 | #227 | Tragic 12.1% |
| West Indians | 2.9 /100 | #228 | Tragic 12.2% |