Immigrants from Costa Rica vs Dutch West Indian Disability
COMPARE
Immigrants from Costa Rica
Dutch West Indian
Disability
Disability Comparison
Immigrants from Costa Rica
Dutch West Indians
11.4%
DISABILITY
93.4/ 100
METRIC RATING
121st/ 347
METRIC RANK
14.9%
DISABILITY
0.0/ 100
METRIC RATING
338th/ 347
METRIC RANK
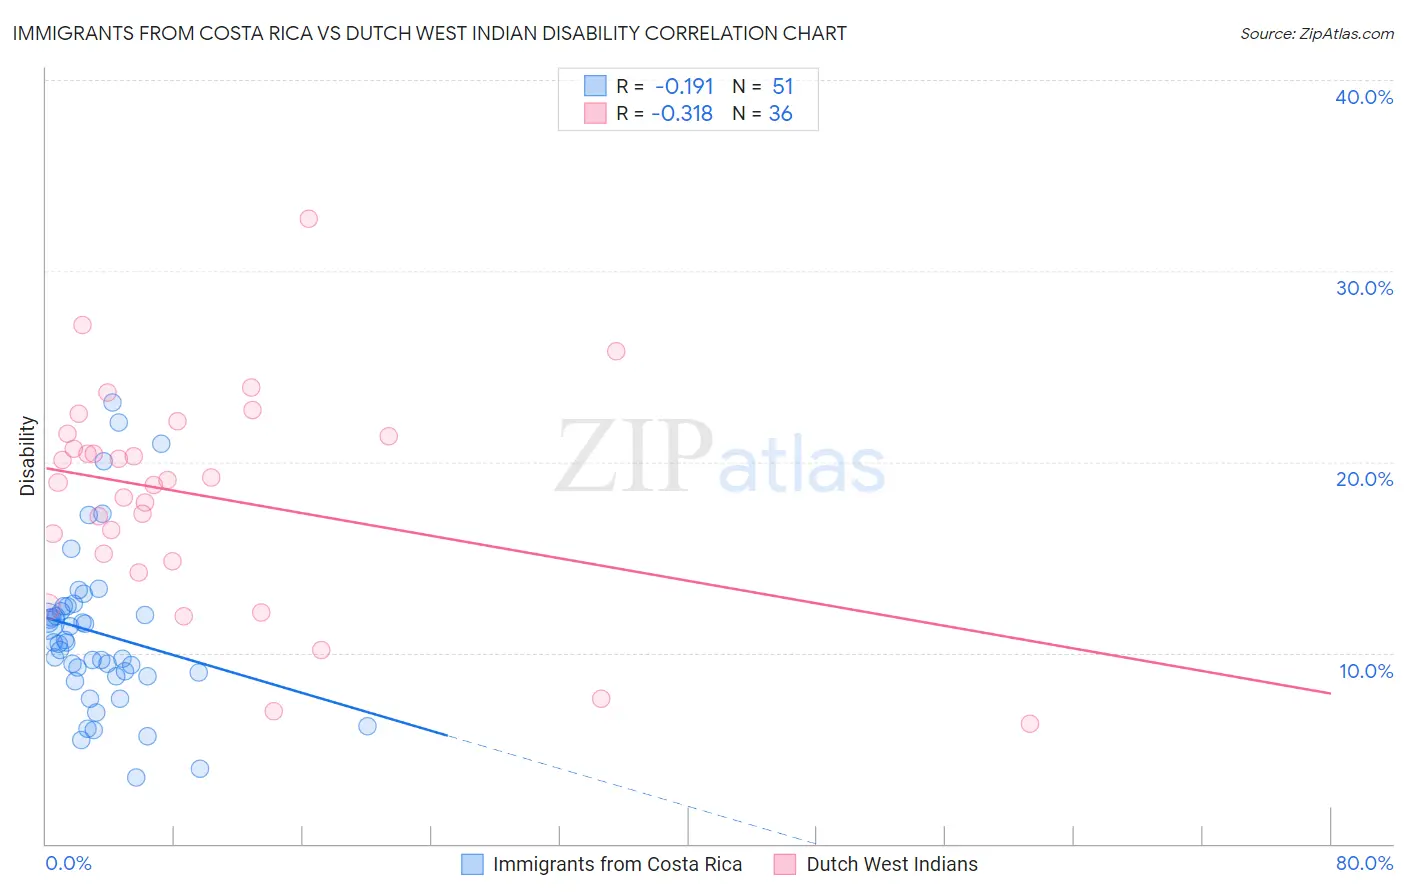
Immigrants from Costa Rica vs Dutch West Indian Disability Correlation Chart
The statistical analysis conducted on geographies consisting of 204,275,653 people shows a poor negative correlation between the proportion of Immigrants from Costa Rica and percentage of population with a disability in the United States with a correlation coefficient (R) of -0.191 and weighted average of 11.4%. Similarly, the statistical analysis conducted on geographies consisting of 85,770,416 people shows a mild negative correlation between the proportion of Dutch West Indians and percentage of population with a disability in the United States with a correlation coefficient (R) of -0.318 and weighted average of 14.9%, a difference of 31.2%.
Disability Correlation Summary
| Measurement | Immigrants from Costa Rica | Dutch West Indian |
| Minimum | 3.5% | 6.3% |
| Maximum | 23.1% | 32.7% |
| Range | 19.6% | 26.4% |
| Mean | 11.0% | 18.2% |
| Median | 10.5% | 19.0% |
| Interquartile 25% (IQ1) | 8.8% | 15.0% |
| Interquartile 75% (IQ3) | 12.4% | 21.4% |
| Interquartile Range (IQR) | 3.6% | 6.4% |
| Standard Deviation (Sample) | 4.2% | 5.7% |
| Standard Deviation (Population) | 4.2% | 5.6% |
Similar Demographics by Disability
Demographics Similar to Immigrants from Costa Rica by Disability
In terms of disability, the demographic groups most similar to Immigrants from Costa Rica are Central American (11.4%, a difference of 0.010%), Immigrants from North Macedonia (11.4%, a difference of 0.010%), Brazilian (11.4%, a difference of 0.020%), Korean (11.3%, a difference of 0.070%), and Luxembourger (11.3%, a difference of 0.080%).
| Demographics | Rating | Rank | Disability |
| Immigrants | Syria | 94.7 /100 | #114 | Exceptional 11.3% |
| Immigrants | Philippines | 94.6 /100 | #115 | Exceptional 11.3% |
| Immigrants | Northern Europe | 94.1 /100 | #116 | Exceptional 11.3% |
| Luxembourgers | 93.9 /100 | #117 | Exceptional 11.3% |
| Koreans | 93.8 /100 | #118 | Exceptional 11.3% |
| Central Americans | 93.5 /100 | #119 | Exceptional 11.4% |
| Immigrants | North Macedonia | 93.5 /100 | #120 | Exceptional 11.4% |
| Immigrants | Costa Rica | 93.4 /100 | #121 | Exceptional 11.4% |
| Brazilians | 93.3 /100 | #122 | Exceptional 11.4% |
| South Africans | 92.3 /100 | #123 | Exceptional 11.4% |
| South American Indians | 92.2 /100 | #124 | Exceptional 11.4% |
| Costa Ricans | 91.9 /100 | #125 | Exceptional 11.4% |
| Immigrants | Latvia | 90.9 /100 | #126 | Exceptional 11.4% |
| Immigrants | Italy | 90.4 /100 | #127 | Exceptional 11.4% |
| Immigrants | Europe | 90.4 /100 | #128 | Exceptional 11.4% |
Demographics Similar to Dutch West Indians by Disability
In terms of disability, the demographic groups most similar to Dutch West Indians are Seminole (14.9%, a difference of 0.30%), Cherokee (14.8%, a difference of 0.39%), Tohono O'odham (14.8%, a difference of 0.91%), Chickasaw (15.2%, a difference of 1.8%), and Yuman (14.6%, a difference of 1.9%).
| Demographics | Rating | Rank | Disability |
| Alaskan Athabascans | 0.0 /100 | #331 | Tragic 14.4% |
| Pueblo | 0.0 /100 | #332 | Tragic 14.4% |
| Cajuns | 0.0 /100 | #333 | Tragic 14.6% |
| Yuman | 0.0 /100 | #334 | Tragic 14.6% |
| Tohono O'odham | 0.0 /100 | #335 | Tragic 14.8% |
| Cherokee | 0.0 /100 | #336 | Tragic 14.8% |
| Seminole | 0.0 /100 | #337 | Tragic 14.9% |
| Dutch West Indians | 0.0 /100 | #338 | Tragic 14.9% |
| Chickasaw | 0.0 /100 | #339 | Tragic 15.2% |
| Choctaw | 0.0 /100 | #340 | Tragic 15.4% |
| Lumbee | 0.0 /100 | #341 | Tragic 15.5% |
| Kiowa | 0.0 /100 | #342 | Tragic 15.6% |
| Creek | 0.0 /100 | #343 | Tragic 15.6% |
| Colville | 0.0 /100 | #344 | Tragic 15.8% |
| Puerto Ricans | 0.0 /100 | #345 | Tragic 16.1% |