White/Caucasian vs Dutch West Indian Disability
COMPARE
White/Caucasian
Dutch West Indian
Disability
Disability Comparison
Whites/Caucasians
Dutch West Indians
13.0%
DISABILITY
0.0/ 100
METRIC RATING
288th/ 347
METRIC RANK
14.9%
DISABILITY
0.0/ 100
METRIC RATING
338th/ 347
METRIC RANK
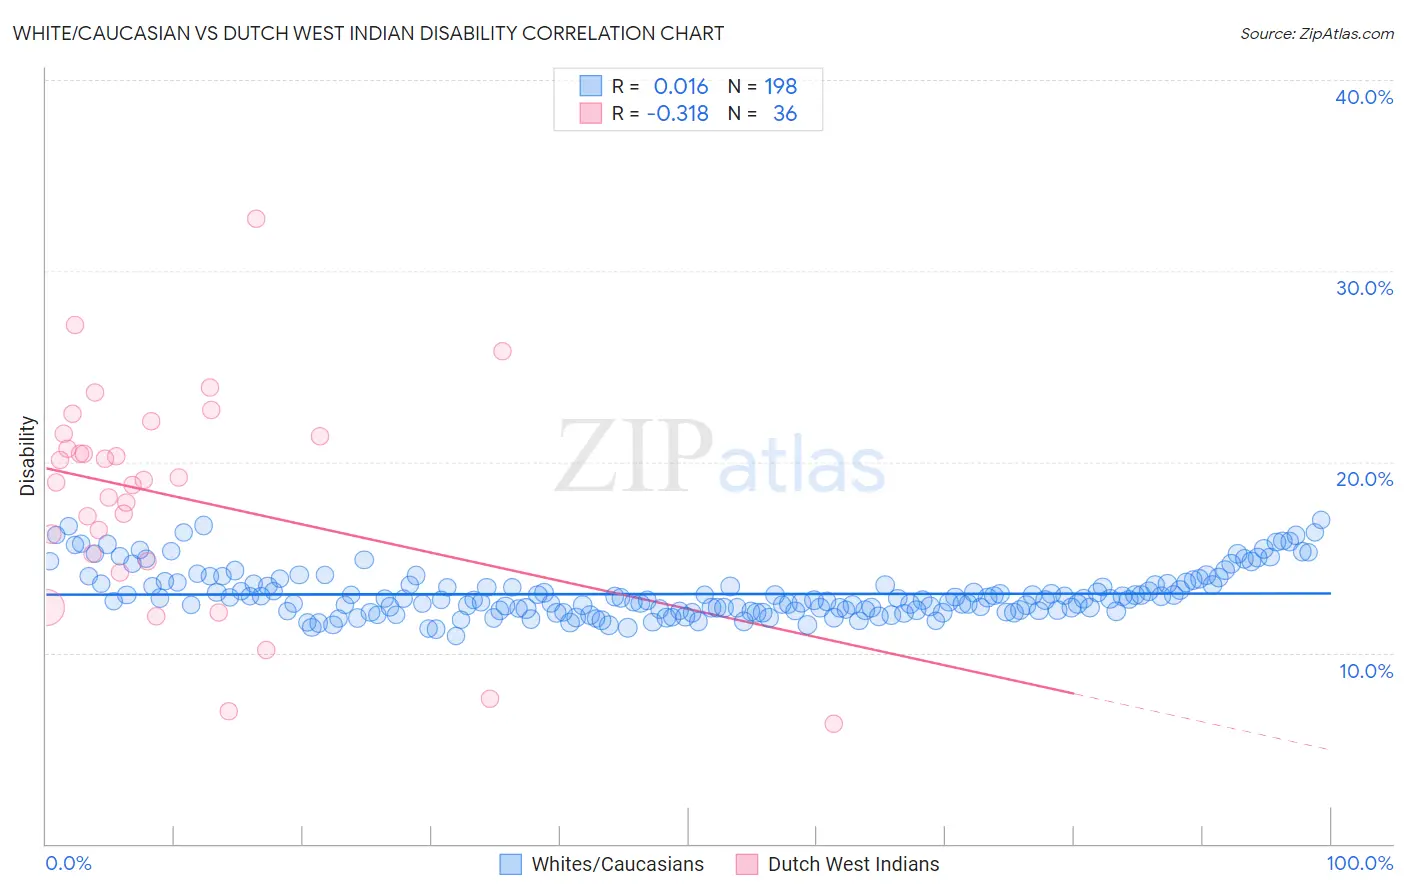
White/Caucasian vs Dutch West Indian Disability Correlation Chart
The statistical analysis conducted on geographies consisting of 583,070,894 people shows no correlation between the proportion of Whites/Caucasians and percentage of population with a disability in the United States with a correlation coefficient (R) of 0.016 and weighted average of 13.0%. Similarly, the statistical analysis conducted on geographies consisting of 85,770,416 people shows a mild negative correlation between the proportion of Dutch West Indians and percentage of population with a disability in the United States with a correlation coefficient (R) of -0.318 and weighted average of 14.9%, a difference of 14.5%.
Disability Correlation Summary
| Measurement | White/Caucasian | Dutch West Indian |
| Minimum | 10.9% | 6.3% |
| Maximum | 16.9% | 32.7% |
| Range | 6.1% | 26.4% |
| Mean | 13.1% | 18.2% |
| Median | 12.8% | 19.0% |
| Interquartile 25% (IQ1) | 12.2% | 15.0% |
| Interquartile 75% (IQ3) | 13.6% | 21.4% |
| Interquartile Range (IQR) | 1.4% | 6.4% |
| Standard Deviation (Sample) | 1.3% | 5.7% |
| Standard Deviation (Population) | 1.3% | 5.6% |
Similar Demographics by Disability
Demographics Similar to Whites/Caucasians by Disability
In terms of disability, the demographic groups most similar to Whites/Caucasians are Slovak (13.0%, a difference of 0.0%), African (13.0%, a difference of 0.020%), Cheyenne (13.0%, a difference of 0.060%), Yaqui (13.1%, a difference of 0.29%), and English (13.0%, a difference of 0.43%).
| Demographics | Rating | Rank | Disability |
| Immigrants | Portugal | 0.0 /100 | #281 | Tragic 12.9% |
| Scottish | 0.0 /100 | #282 | Tragic 12.9% |
| Irish | 0.0 /100 | #283 | Tragic 12.9% |
| Welsh | 0.0 /100 | #284 | Tragic 12.9% |
| Crow | 0.0 /100 | #285 | Tragic 12.9% |
| English | 0.0 /100 | #286 | Tragic 13.0% |
| Africans | 0.0 /100 | #287 | Tragic 13.0% |
| Whites/Caucasians | 0.0 /100 | #288 | Tragic 13.0% |
| Slovaks | 0.0 /100 | #289 | Tragic 13.0% |
| Cheyenne | 0.0 /100 | #290 | Tragic 13.0% |
| Yaqui | 0.0 /100 | #291 | Tragic 13.1% |
| Aleuts | 0.0 /100 | #292 | Tragic 13.1% |
| Marshallese | 0.0 /100 | #293 | Tragic 13.1% |
| Celtics | 0.0 /100 | #294 | Tragic 13.1% |
| Immigrants | Nonimmigrants | 0.0 /100 | #295 | Tragic 13.2% |
Demographics Similar to Dutch West Indians by Disability
In terms of disability, the demographic groups most similar to Dutch West Indians are Seminole (14.9%, a difference of 0.30%), Cherokee (14.8%, a difference of 0.39%), Tohono O'odham (14.8%, a difference of 0.91%), Chickasaw (15.2%, a difference of 1.8%), and Yuman (14.6%, a difference of 1.9%).
| Demographics | Rating | Rank | Disability |
| Alaskan Athabascans | 0.0 /100 | #331 | Tragic 14.4% |
| Pueblo | 0.0 /100 | #332 | Tragic 14.4% |
| Cajuns | 0.0 /100 | #333 | Tragic 14.6% |
| Yuman | 0.0 /100 | #334 | Tragic 14.6% |
| Tohono O'odham | 0.0 /100 | #335 | Tragic 14.8% |
| Cherokee | 0.0 /100 | #336 | Tragic 14.8% |
| Seminole | 0.0 /100 | #337 | Tragic 14.9% |
| Dutch West Indians | 0.0 /100 | #338 | Tragic 14.9% |
| Chickasaw | 0.0 /100 | #339 | Tragic 15.2% |
| Choctaw | 0.0 /100 | #340 | Tragic 15.4% |
| Lumbee | 0.0 /100 | #341 | Tragic 15.5% |
| Kiowa | 0.0 /100 | #342 | Tragic 15.6% |
| Creek | 0.0 /100 | #343 | Tragic 15.6% |
| Colville | 0.0 /100 | #344 | Tragic 15.8% |
| Puerto Ricans | 0.0 /100 | #345 | Tragic 16.1% |