Bolivian vs Central American Indian Disability
COMPARE
Bolivian
Central American Indian
Disability
Disability Comparison
Bolivians
Central American Indians
10.0%
DISABILITY
100.0/ 100
METRIC RATING
8th/ 347
METRIC RANK
13.2%
DISABILITY
0.0/ 100
METRIC RATING
296th/ 347
METRIC RANK
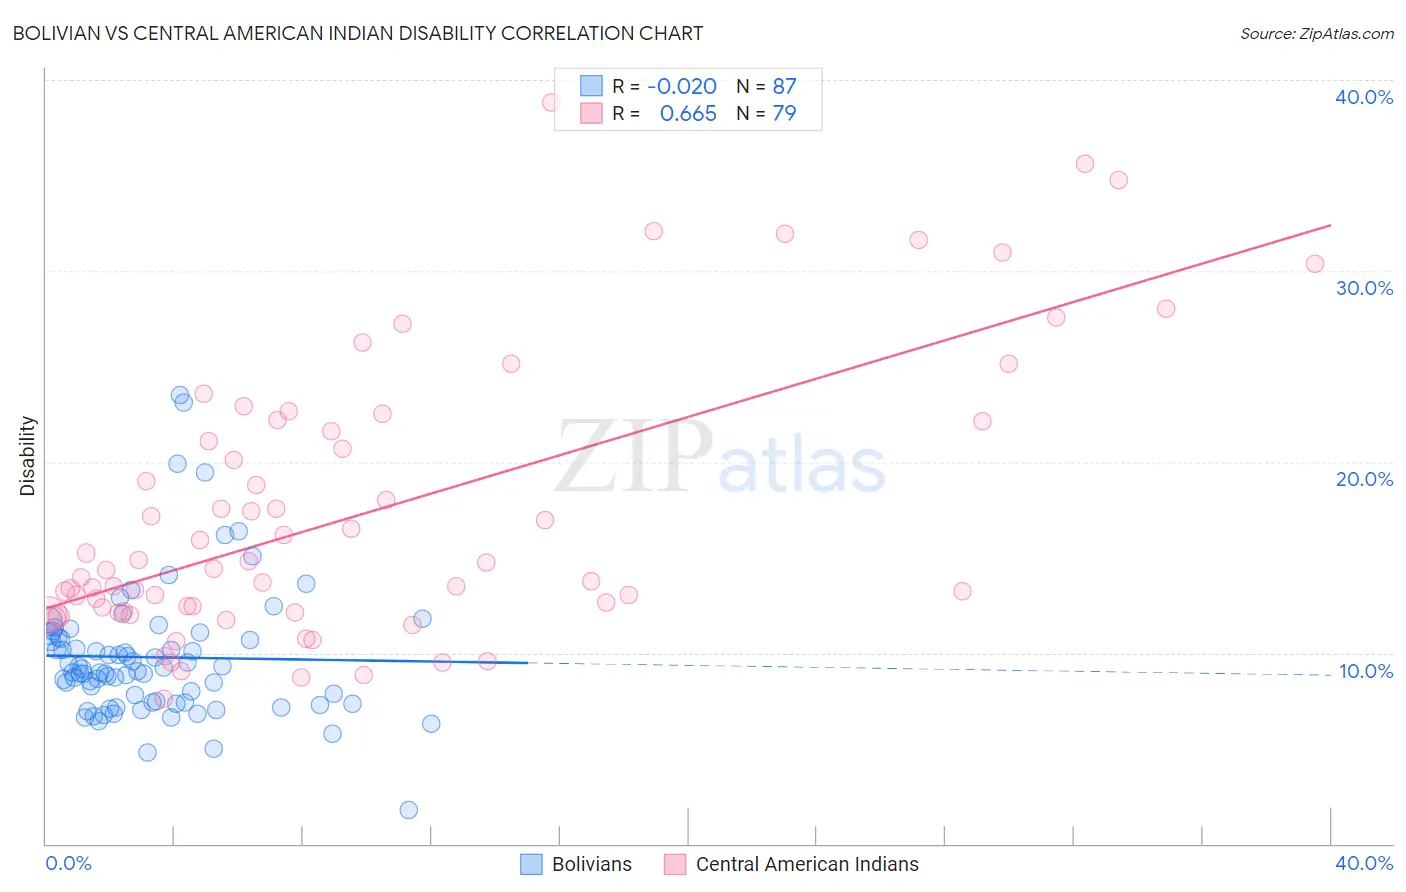
Bolivian vs Central American Indian Disability Correlation Chart
The statistical analysis conducted on geographies consisting of 184,660,652 people shows no correlation between the proportion of Bolivians and percentage of population with a disability in the United States with a correlation coefficient (R) of -0.020 and weighted average of 10.0%. Similarly, the statistical analysis conducted on geographies consisting of 326,115,118 people shows a significant positive correlation between the proportion of Central American Indians and percentage of population with a disability in the United States with a correlation coefficient (R) of 0.665 and weighted average of 13.2%, a difference of 31.6%.
Disability Correlation Summary
| Measurement | Bolivian | Central American Indian |
| Minimum | 1.7% | 7.6% |
| Maximum | 23.5% | 38.8% |
| Range | 21.8% | 31.2% |
| Mean | 9.8% | 17.4% |
| Median | 9.1% | 14.4% |
| Interquartile 25% (IQ1) | 7.4% | 12.2% |
| Interquartile 75% (IQ3) | 10.8% | 22.1% |
| Interquartile Range (IQR) | 3.4% | 9.9% |
| Standard Deviation (Sample) | 3.6% | 7.3% |
| Standard Deviation (Population) | 3.5% | 7.3% |
Similar Demographics by Disability
Demographics Similar to Bolivians by Disability
In terms of disability, the demographic groups most similar to Bolivians are Immigrants from Singapore (10.0%, a difference of 0.23%), Immigrants from Hong Kong (10.0%, a difference of 0.30%), Immigrants from South Central Asia (9.9%, a difference of 0.54%), Immigrants from China (10.1%, a difference of 1.1%), and Iranian (10.1%, a difference of 1.1%).
| Demographics | Rating | Rank | Disability |
| Immigrants | India | 100.0 /100 | #1 | Exceptional 9.5% |
| Filipinos | 100.0 /100 | #2 | Exceptional 9.6% |
| Immigrants | Taiwan | 100.0 /100 | #3 | Exceptional 9.6% |
| Thais | 100.0 /100 | #4 | Exceptional 9.7% |
| Immigrants | Bolivia | 100.0 /100 | #5 | Exceptional 9.9% |
| Immigrants | South Central Asia | 100.0 /100 | #6 | Exceptional 9.9% |
| Immigrants | Singapore | 100.0 /100 | #7 | Exceptional 10.0% |
| Bolivians | 100.0 /100 | #8 | Exceptional 10.0% |
| Immigrants | Hong Kong | 100.0 /100 | #9 | Exceptional 10.0% |
| Immigrants | China | 100.0 /100 | #10 | Exceptional 10.1% |
| Iranians | 100.0 /100 | #11 | Exceptional 10.1% |
| Immigrants | Israel | 100.0 /100 | #12 | Exceptional 10.1% |
| Immigrants | Eastern Asia | 100.0 /100 | #13 | Exceptional 10.2% |
| Immigrants | Korea | 100.0 /100 | #14 | Exceptional 10.2% |
| Okinawans | 100.0 /100 | #15 | Exceptional 10.3% |
Demographics Similar to Central American Indians by Disability
In terms of disability, the demographic groups most similar to Central American Indians are Nonimmigrants (13.2%, a difference of 0.040%), Hopi (13.2%, a difference of 0.060%), Alaska Native (13.2%, a difference of 0.070%), French (13.2%, a difference of 0.080%), and Pennsylvania German (13.2%, a difference of 0.13%).
| Demographics | Rating | Rank | Disability |
| Slovaks | 0.0 /100 | #289 | Tragic 13.0% |
| Cheyenne | 0.0 /100 | #290 | Tragic 13.0% |
| Yaqui | 0.0 /100 | #291 | Tragic 13.1% |
| Aleuts | 0.0 /100 | #292 | Tragic 13.1% |
| Marshallese | 0.0 /100 | #293 | Tragic 13.1% |
| Celtics | 0.0 /100 | #294 | Tragic 13.1% |
| Immigrants | Nonimmigrants | 0.0 /100 | #295 | Tragic 13.2% |
| Central American Indians | 0.0 /100 | #296 | Tragic 13.2% |
| Hopi | 0.0 /100 | #297 | Tragic 13.2% |
| Alaska Natives | 0.0 /100 | #298 | Tragic 13.2% |
| French | 0.0 /100 | #299 | Tragic 13.2% |
| Pennsylvania Germans | 0.0 /100 | #300 | Tragic 13.2% |
| Immigrants | Micronesia | 0.0 /100 | #301 | Tragic 13.2% |
| Arapaho | 0.0 /100 | #302 | Tragic 13.2% |
| Scotch-Irish | 0.0 /100 | #303 | Tragic 13.3% |