Bolivian vs Immigrants from Northern Europe Disability
COMPARE
Bolivian
Immigrants from Northern Europe
Disability
Disability Comparison
Bolivians
Immigrants from Northern Europe
10.0%
DISABILITY
100.0/ 100
METRIC RATING
8th/ 347
METRIC RANK
11.3%
DISABILITY
94.1/ 100
METRIC RATING
116th/ 347
METRIC RANK
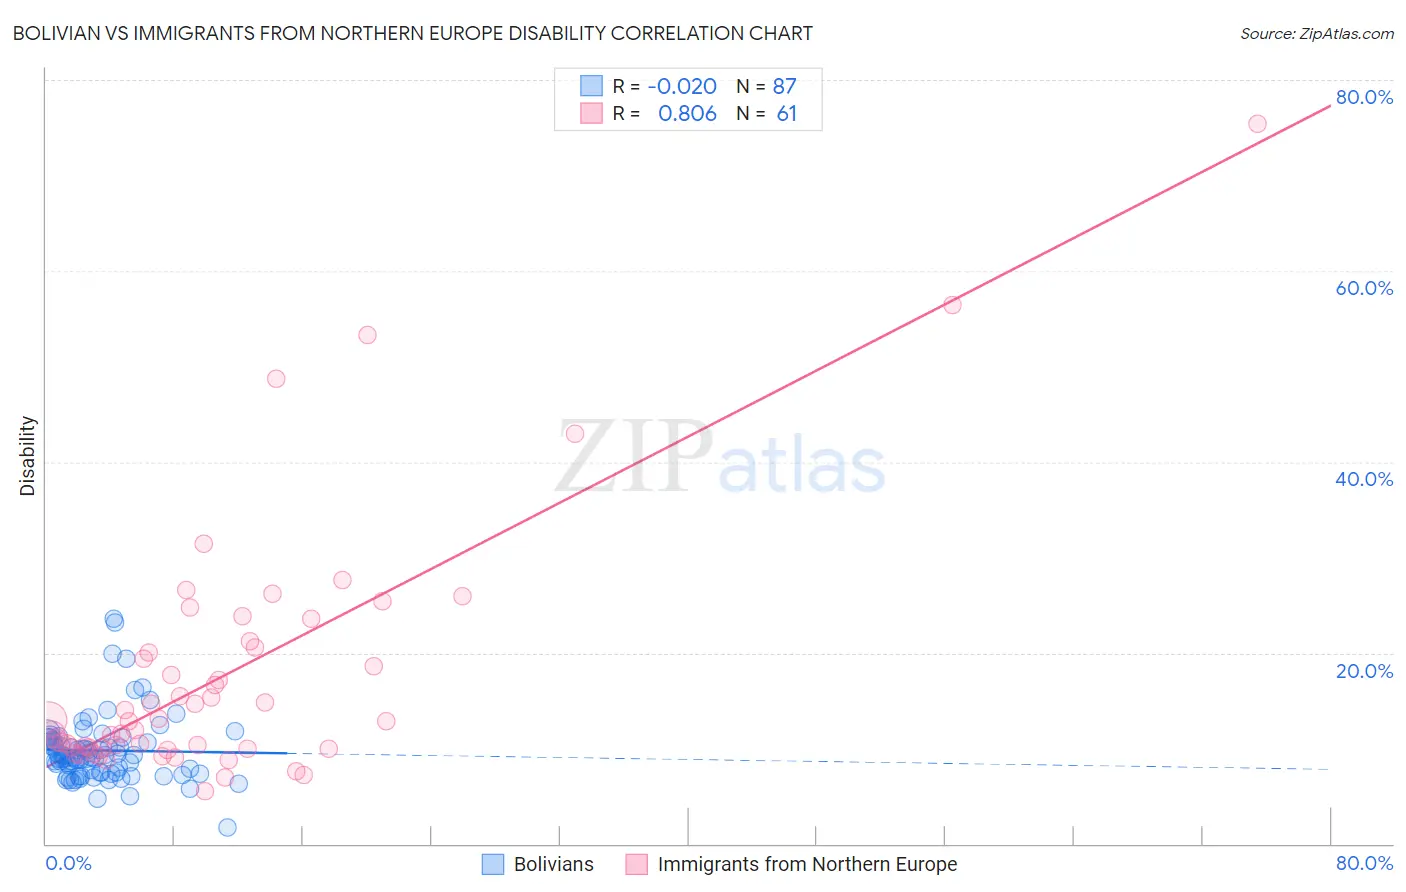
Bolivian vs Immigrants from Northern Europe Disability Correlation Chart
The statistical analysis conducted on geographies consisting of 184,660,652 people shows no correlation between the proportion of Bolivians and percentage of population with a disability in the United States with a correlation coefficient (R) of -0.020 and weighted average of 10.0%. Similarly, the statistical analysis conducted on geographies consisting of 477,212,072 people shows a very strong positive correlation between the proportion of Immigrants from Northern Europe and percentage of population with a disability in the United States with a correlation coefficient (R) of 0.806 and weighted average of 11.3%, a difference of 13.4%.
Disability Correlation Summary
| Measurement | Bolivian | Immigrants from Northern Europe |
| Minimum | 1.7% | 5.5% |
| Maximum | 23.5% | 75.4% |
| Range | 21.8% | 69.9% |
| Mean | 9.8% | 17.8% |
| Median | 9.1% | 12.9% |
| Interquartile 25% (IQ1) | 7.4% | 10.0% |
| Interquartile 75% (IQ3) | 10.8% | 20.9% |
| Interquartile Range (IQR) | 3.4% | 10.9% |
| Standard Deviation (Sample) | 3.6% | 13.2% |
| Standard Deviation (Population) | 3.5% | 13.1% |
Similar Demographics by Disability
Demographics Similar to Bolivians by Disability
In terms of disability, the demographic groups most similar to Bolivians are Immigrants from Singapore (10.0%, a difference of 0.23%), Immigrants from Hong Kong (10.0%, a difference of 0.30%), Immigrants from South Central Asia (9.9%, a difference of 0.54%), Immigrants from China (10.1%, a difference of 1.1%), and Iranian (10.1%, a difference of 1.1%).
| Demographics | Rating | Rank | Disability |
| Immigrants | India | 100.0 /100 | #1 | Exceptional 9.5% |
| Filipinos | 100.0 /100 | #2 | Exceptional 9.6% |
| Immigrants | Taiwan | 100.0 /100 | #3 | Exceptional 9.6% |
| Thais | 100.0 /100 | #4 | Exceptional 9.7% |
| Immigrants | Bolivia | 100.0 /100 | #5 | Exceptional 9.9% |
| Immigrants | South Central Asia | 100.0 /100 | #6 | Exceptional 9.9% |
| Immigrants | Singapore | 100.0 /100 | #7 | Exceptional 10.0% |
| Bolivians | 100.0 /100 | #8 | Exceptional 10.0% |
| Immigrants | Hong Kong | 100.0 /100 | #9 | Exceptional 10.0% |
| Immigrants | China | 100.0 /100 | #10 | Exceptional 10.1% |
| Iranians | 100.0 /100 | #11 | Exceptional 10.1% |
| Immigrants | Israel | 100.0 /100 | #12 | Exceptional 10.1% |
| Immigrants | Eastern Asia | 100.0 /100 | #13 | Exceptional 10.2% |
| Immigrants | Korea | 100.0 /100 | #14 | Exceptional 10.2% |
| Okinawans | 100.0 /100 | #15 | Exceptional 10.3% |
Demographics Similar to Immigrants from Northern Europe by Disability
In terms of disability, the demographic groups most similar to Immigrants from Northern Europe are Luxembourger (11.3%, a difference of 0.060%), Korean (11.3%, a difference of 0.070%), Immigrants from Philippines (11.3%, a difference of 0.11%), Central American (11.4%, a difference of 0.12%), and Immigrants from North Macedonia (11.4%, a difference of 0.12%).
| Demographics | Rating | Rank | Disability |
| Immigrants | Uganda | 95.7 /100 | #109 | Exceptional 11.3% |
| Immigrants | Denmark | 95.6 /100 | #110 | Exceptional 11.3% |
| Immigrants | South Eastern Asia | 95.4 /100 | #111 | Exceptional 11.3% |
| Immigrants | Uzbekistan | 94.9 /100 | #112 | Exceptional 11.3% |
| Guyanese | 94.7 /100 | #113 | Exceptional 11.3% |
| Immigrants | Syria | 94.7 /100 | #114 | Exceptional 11.3% |
| Immigrants | Philippines | 94.6 /100 | #115 | Exceptional 11.3% |
| Immigrants | Northern Europe | 94.1 /100 | #116 | Exceptional 11.3% |
| Luxembourgers | 93.9 /100 | #117 | Exceptional 11.3% |
| Koreans | 93.8 /100 | #118 | Exceptional 11.3% |
| Central Americans | 93.5 /100 | #119 | Exceptional 11.4% |
| Immigrants | North Macedonia | 93.5 /100 | #120 | Exceptional 11.4% |
| Immigrants | Costa Rica | 93.4 /100 | #121 | Exceptional 11.4% |
| Brazilians | 93.3 /100 | #122 | Exceptional 11.4% |
| South Africans | 92.3 /100 | #123 | Exceptional 11.4% |