Immigrants from Chile vs Dutch West Indian Disability
COMPARE
Immigrants from Chile
Dutch West Indian
Disability
Disability Comparison
Immigrants from Chile
Dutch West Indians
11.0%
DISABILITY
99.4/ 100
METRIC RATING
72nd/ 347
METRIC RANK
14.9%
DISABILITY
0.0/ 100
METRIC RATING
338th/ 347
METRIC RANK
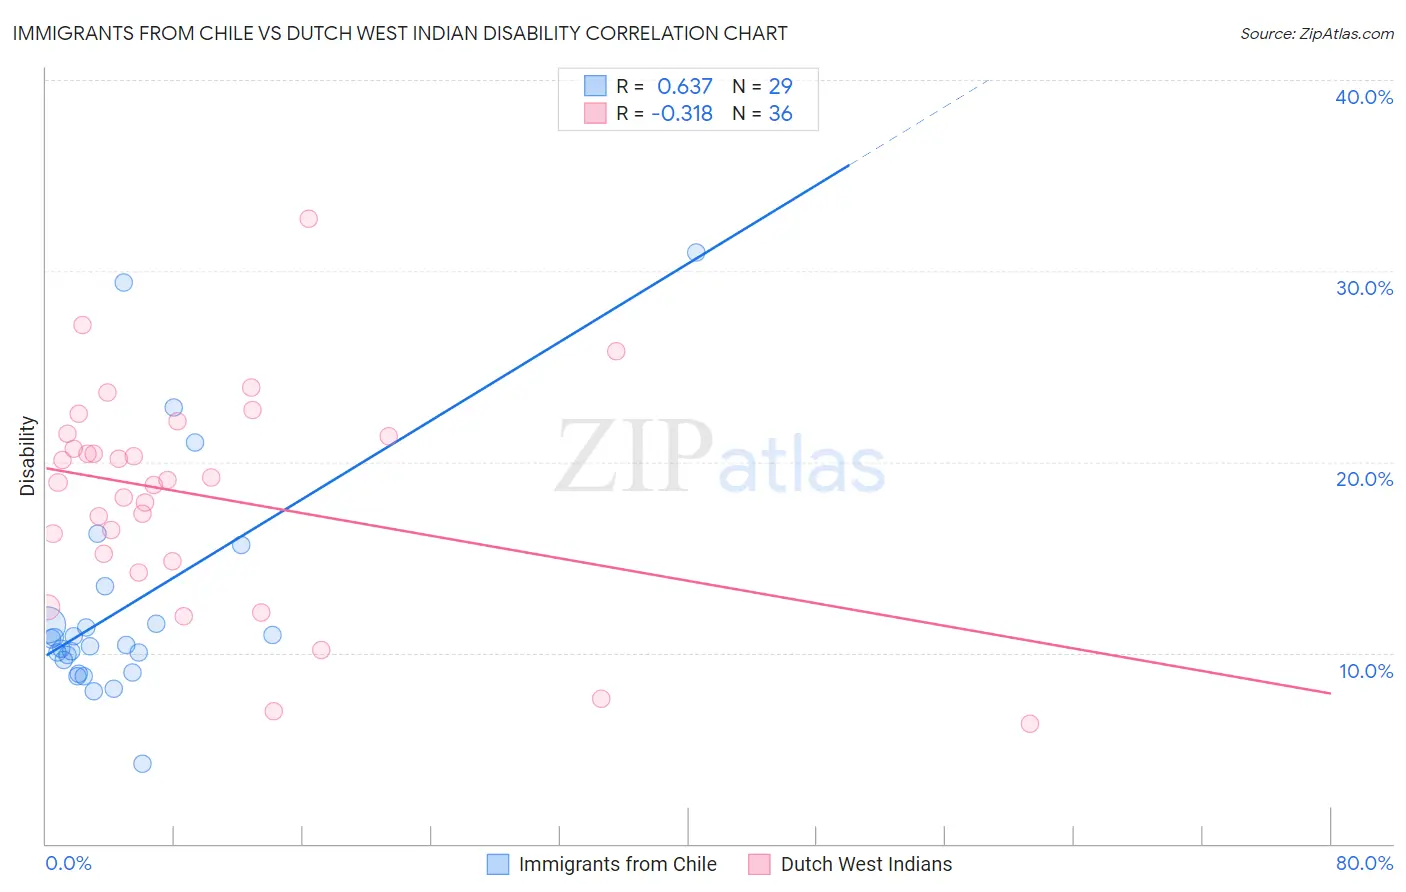
Immigrants from Chile vs Dutch West Indian Disability Correlation Chart
The statistical analysis conducted on geographies consisting of 218,638,436 people shows a significant positive correlation between the proportion of Immigrants from Chile and percentage of population with a disability in the United States with a correlation coefficient (R) of 0.637 and weighted average of 11.0%. Similarly, the statistical analysis conducted on geographies consisting of 85,770,416 people shows a mild negative correlation between the proportion of Dutch West Indians and percentage of population with a disability in the United States with a correlation coefficient (R) of -0.318 and weighted average of 14.9%, a difference of 35.0%.
Disability Correlation Summary
| Measurement | Immigrants from Chile | Dutch West Indian |
| Minimum | 4.2% | 6.3% |
| Maximum | 31.0% | 32.7% |
| Range | 26.8% | 26.4% |
| Mean | 12.5% | 18.2% |
| Median | 10.4% | 19.0% |
| Interquartile 25% (IQ1) | 9.3% | 15.0% |
| Interquartile 75% (IQ3) | 12.5% | 21.4% |
| Interquartile Range (IQR) | 3.2% | 6.4% |
| Standard Deviation (Sample) | 6.1% | 5.7% |
| Standard Deviation (Population) | 6.0% | 5.6% |
Similar Demographics by Disability
Demographics Similar to Immigrants from Chile by Disability
In terms of disability, the demographic groups most similar to Immigrants from Chile are Immigrants from Bangladesh (11.0%, a difference of 0.030%), Immigrants from Serbia (11.0%, a difference of 0.040%), Immigrants from Vietnam (11.0%, a difference of 0.070%), Immigrants from Lebanon (11.0%, a difference of 0.090%), and Sierra Leonean (11.0%, a difference of 0.090%).
| Demographics | Rating | Rank | Disability |
| Bulgarians | 99.6 /100 | #65 | Exceptional 11.0% |
| Laotians | 99.6 /100 | #66 | Exceptional 11.0% |
| Colombians | 99.6 /100 | #67 | Exceptional 11.0% |
| Immigrants | Afghanistan | 99.6 /100 | #68 | Exceptional 11.0% |
| Sri Lankans | 99.5 /100 | #69 | Exceptional 11.0% |
| Immigrants | France | 99.4 /100 | #70 | Exceptional 11.0% |
| Immigrants | Lebanon | 99.4 /100 | #71 | Exceptional 11.0% |
| Immigrants | Chile | 99.4 /100 | #72 | Exceptional 11.0% |
| Immigrants | Bangladesh | 99.4 /100 | #73 | Exceptional 11.0% |
| Immigrants | Serbia | 99.4 /100 | #74 | Exceptional 11.0% |
| Immigrants | Vietnam | 99.4 /100 | #75 | Exceptional 11.0% |
| Sierra Leoneans | 99.3 /100 | #76 | Exceptional 11.0% |
| Immigrants | Belgium | 99.3 /100 | #77 | Exceptional 11.0% |
| Immigrants | Cameroon | 99.3 /100 | #78 | Exceptional 11.1% |
| Immigrants | Jordan | 99.3 /100 | #79 | Exceptional 11.1% |
Demographics Similar to Dutch West Indians by Disability
In terms of disability, the demographic groups most similar to Dutch West Indians are Seminole (14.9%, a difference of 0.30%), Cherokee (14.8%, a difference of 0.39%), Tohono O'odham (14.8%, a difference of 0.91%), Chickasaw (15.2%, a difference of 1.8%), and Yuman (14.6%, a difference of 1.9%).
| Demographics | Rating | Rank | Disability |
| Alaskan Athabascans | 0.0 /100 | #331 | Tragic 14.4% |
| Pueblo | 0.0 /100 | #332 | Tragic 14.4% |
| Cajuns | 0.0 /100 | #333 | Tragic 14.6% |
| Yuman | 0.0 /100 | #334 | Tragic 14.6% |
| Tohono O'odham | 0.0 /100 | #335 | Tragic 14.8% |
| Cherokee | 0.0 /100 | #336 | Tragic 14.8% |
| Seminole | 0.0 /100 | #337 | Tragic 14.9% |
| Dutch West Indians | 0.0 /100 | #338 | Tragic 14.9% |
| Chickasaw | 0.0 /100 | #339 | Tragic 15.2% |
| Choctaw | 0.0 /100 | #340 | Tragic 15.4% |
| Lumbee | 0.0 /100 | #341 | Tragic 15.5% |
| Kiowa | 0.0 /100 | #342 | Tragic 15.6% |
| Creek | 0.0 /100 | #343 | Tragic 15.6% |
| Colville | 0.0 /100 | #344 | Tragic 15.8% |
| Puerto Ricans | 0.0 /100 | #345 | Tragic 16.1% |