Bolivian vs Immigrants from Kenya Disability
COMPARE
Bolivian
Immigrants from Kenya
Disability
Disability Comparison
Bolivians
Immigrants from Kenya
10.0%
DISABILITY
100.0/ 100
METRIC RATING
8th/ 347
METRIC RANK
11.6%
DISABILITY
72.1/ 100
METRIC RATING
151st/ 347
METRIC RANK
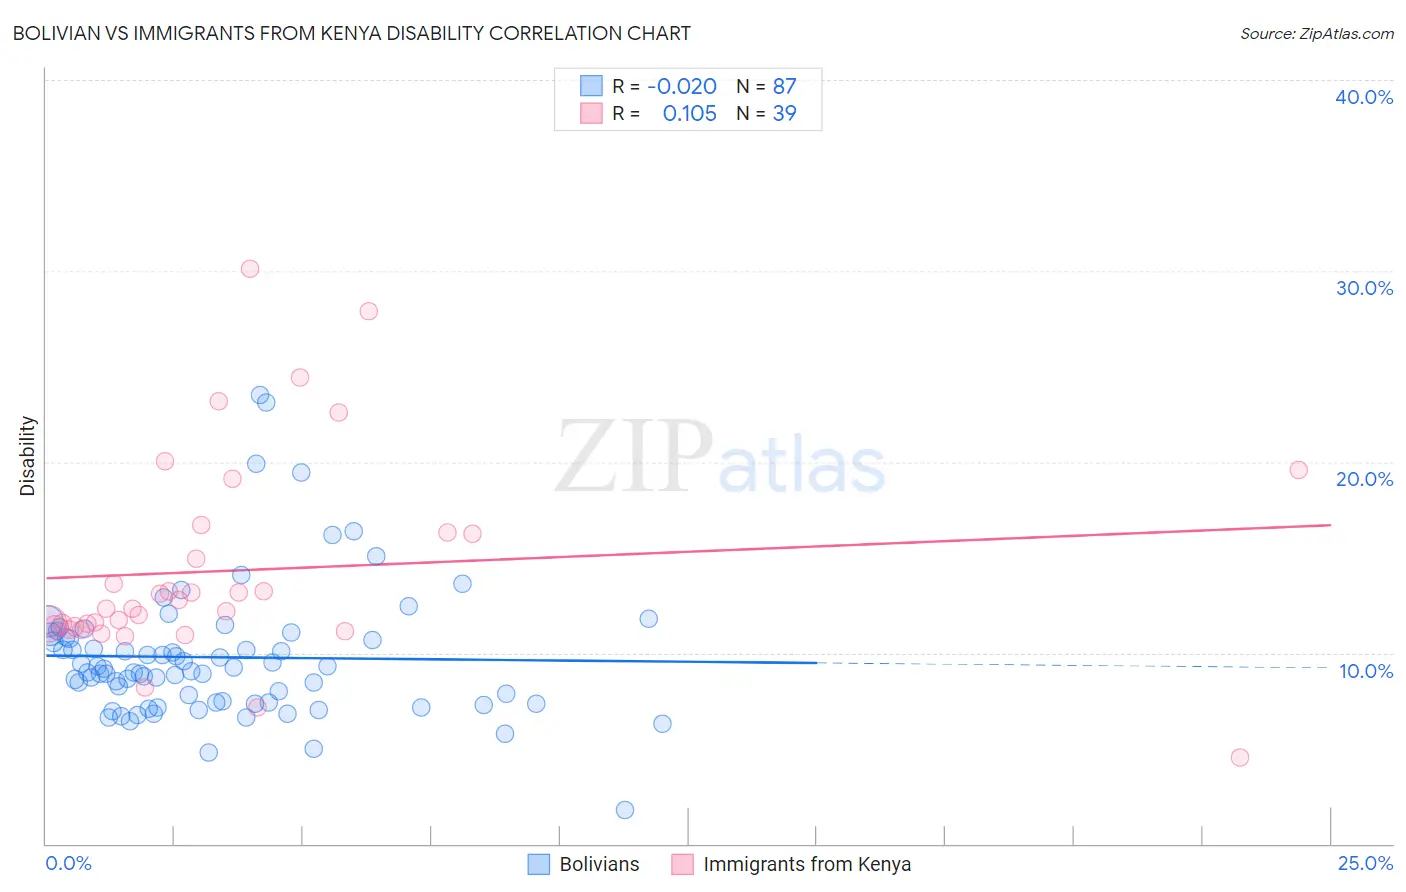
Bolivian vs Immigrants from Kenya Disability Correlation Chart
The statistical analysis conducted on geographies consisting of 184,660,652 people shows no correlation between the proportion of Bolivians and percentage of population with a disability in the United States with a correlation coefficient (R) of -0.020 and weighted average of 10.0%. Similarly, the statistical analysis conducted on geographies consisting of 218,058,395 people shows a poor positive correlation between the proportion of Immigrants from Kenya and percentage of population with a disability in the United States with a correlation coefficient (R) of 0.105 and weighted average of 11.6%, a difference of 15.7%.
Disability Correlation Summary
| Measurement | Bolivian | Immigrants from Kenya |
| Minimum | 1.7% | 4.5% |
| Maximum | 23.5% | 30.1% |
| Range | 21.8% | 25.6% |
| Mean | 9.8% | 14.3% |
| Median | 9.1% | 12.3% |
| Interquartile 25% (IQ1) | 7.4% | 11.4% |
| Interquartile 75% (IQ3) | 10.8% | 16.3% |
| Interquartile Range (IQR) | 3.4% | 4.9% |
| Standard Deviation (Sample) | 3.6% | 5.4% |
| Standard Deviation (Population) | 3.5% | 5.3% |
Similar Demographics by Disability
Demographics Similar to Bolivians by Disability
In terms of disability, the demographic groups most similar to Bolivians are Immigrants from Singapore (10.0%, a difference of 0.23%), Immigrants from Hong Kong (10.0%, a difference of 0.30%), Immigrants from South Central Asia (9.9%, a difference of 0.54%), Immigrants from China (10.1%, a difference of 1.1%), and Iranian (10.1%, a difference of 1.1%).
| Demographics | Rating | Rank | Disability |
| Immigrants | India | 100.0 /100 | #1 | Exceptional 9.5% |
| Filipinos | 100.0 /100 | #2 | Exceptional 9.6% |
| Immigrants | Taiwan | 100.0 /100 | #3 | Exceptional 9.6% |
| Thais | 100.0 /100 | #4 | Exceptional 9.7% |
| Immigrants | Bolivia | 100.0 /100 | #5 | Exceptional 9.9% |
| Immigrants | South Central Asia | 100.0 /100 | #6 | Exceptional 9.9% |
| Immigrants | Singapore | 100.0 /100 | #7 | Exceptional 10.0% |
| Bolivians | 100.0 /100 | #8 | Exceptional 10.0% |
| Immigrants | Hong Kong | 100.0 /100 | #9 | Exceptional 10.0% |
| Immigrants | China | 100.0 /100 | #10 | Exceptional 10.1% |
| Iranians | 100.0 /100 | #11 | Exceptional 10.1% |
| Immigrants | Israel | 100.0 /100 | #12 | Exceptional 10.1% |
| Immigrants | Eastern Asia | 100.0 /100 | #13 | Exceptional 10.2% |
| Immigrants | Korea | 100.0 /100 | #14 | Exceptional 10.2% |
| Okinawans | 100.0 /100 | #15 | Exceptional 10.3% |
Demographics Similar to Immigrants from Kenya by Disability
In terms of disability, the demographic groups most similar to Immigrants from Kenya are Immigrants from Moldova (11.6%, a difference of 0.0%), Romanian (11.6%, a difference of 0.030%), Immigrants from Ghana (11.6%, a difference of 0.050%), Immigrants from Guatemala (11.6%, a difference of 0.050%), and Immigrants from Norway (11.6%, a difference of 0.060%).
| Demographics | Rating | Rank | Disability |
| Australians | 82.5 /100 | #144 | Excellent 11.5% |
| Nigerians | 81.3 /100 | #145 | Excellent 11.5% |
| Immigrants | Hungary | 79.0 /100 | #146 | Good 11.5% |
| Immigrants | Ukraine | 77.6 /100 | #147 | Good 11.5% |
| Sudanese | 77.1 /100 | #148 | Good 11.5% |
| Immigrants | Norway | 73.2 /100 | #149 | Good 11.6% |
| Romanians | 72.7 /100 | #150 | Good 11.6% |
| Immigrants | Kenya | 72.1 /100 | #151 | Good 11.6% |
| Immigrants | Moldova | 72.0 /100 | #152 | Good 11.6% |
| Immigrants | Ghana | 71.2 /100 | #153 | Good 11.6% |
| Immigrants | Guatemala | 71.1 /100 | #154 | Good 11.6% |
| Immigrants | Netherlands | 69.8 /100 | #155 | Good 11.6% |
| Immigrants | Fiji | 69.5 /100 | #156 | Good 11.6% |
| Immigrants | Middle Africa | 69.5 /100 | #157 | Good 11.6% |
| Armenians | 65.9 /100 | #158 | Good 11.6% |