Bolivian vs French American Indian Disability
COMPARE
Bolivian
French American Indian
Disability
Disability Comparison
Bolivians
French American Indians
10.0%
DISABILITY
100.0/ 100
METRIC RATING
8th/ 347
METRIC RANK
13.5%
DISABILITY
0.0/ 100
METRIC RATING
308th/ 347
METRIC RANK
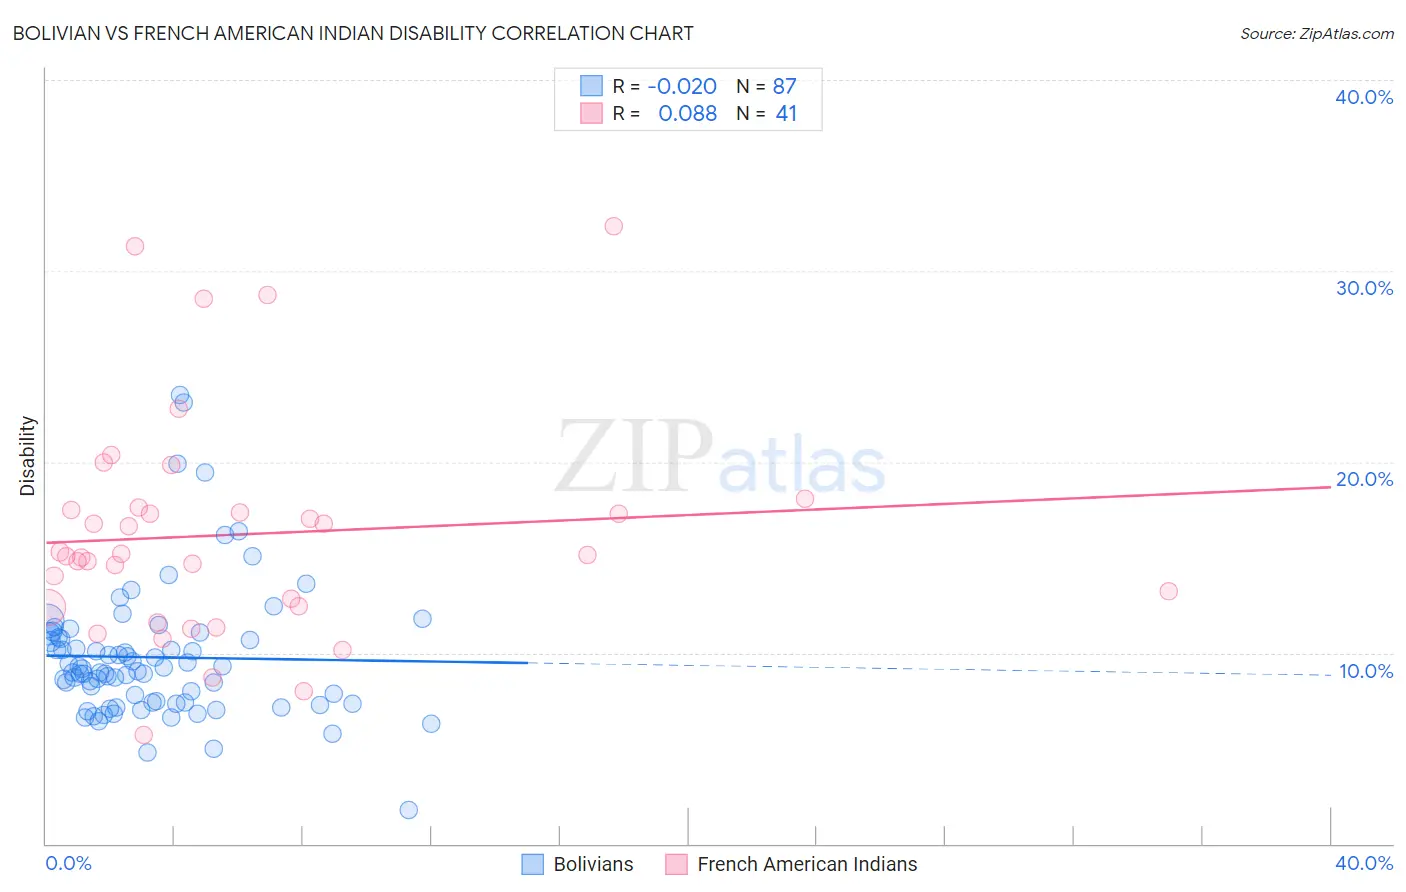
Bolivian vs French American Indian Disability Correlation Chart
The statistical analysis conducted on geographies consisting of 184,660,652 people shows no correlation between the proportion of Bolivians and percentage of population with a disability in the United States with a correlation coefficient (R) of -0.020 and weighted average of 10.0%. Similarly, the statistical analysis conducted on geographies consisting of 131,973,513 people shows a slight positive correlation between the proportion of French American Indians and percentage of population with a disability in the United States with a correlation coefficient (R) of 0.088 and weighted average of 13.5%, a difference of 35.2%.
Disability Correlation Summary
| Measurement | Bolivian | French American Indian |
| Minimum | 1.7% | 5.7% |
| Maximum | 23.5% | 32.4% |
| Range | 21.8% | 26.7% |
| Mean | 9.8% | 16.2% |
| Median | 9.1% | 15.1% |
| Interquartile 25% (IQ1) | 7.4% | 12.4% |
| Interquartile 75% (IQ3) | 10.8% | 17.5% |
| Interquartile Range (IQR) | 3.4% | 5.1% |
| Standard Deviation (Sample) | 3.6% | 5.8% |
| Standard Deviation (Population) | 3.5% | 5.8% |
Similar Demographics by Disability
Demographics Similar to Bolivians by Disability
In terms of disability, the demographic groups most similar to Bolivians are Immigrants from Singapore (10.0%, a difference of 0.23%), Immigrants from Hong Kong (10.0%, a difference of 0.30%), Immigrants from South Central Asia (9.9%, a difference of 0.54%), Immigrants from China (10.1%, a difference of 1.1%), and Iranian (10.1%, a difference of 1.1%).
| Demographics | Rating | Rank | Disability |
| Immigrants | India | 100.0 /100 | #1 | Exceptional 9.5% |
| Filipinos | 100.0 /100 | #2 | Exceptional 9.6% |
| Immigrants | Taiwan | 100.0 /100 | #3 | Exceptional 9.6% |
| Thais | 100.0 /100 | #4 | Exceptional 9.7% |
| Immigrants | Bolivia | 100.0 /100 | #5 | Exceptional 9.9% |
| Immigrants | South Central Asia | 100.0 /100 | #6 | Exceptional 9.9% |
| Immigrants | Singapore | 100.0 /100 | #7 | Exceptional 10.0% |
| Bolivians | 100.0 /100 | #8 | Exceptional 10.0% |
| Immigrants | Hong Kong | 100.0 /100 | #9 | Exceptional 10.0% |
| Immigrants | China | 100.0 /100 | #10 | Exceptional 10.1% |
| Iranians | 100.0 /100 | #11 | Exceptional 10.1% |
| Immigrants | Israel | 100.0 /100 | #12 | Exceptional 10.1% |
| Immigrants | Eastern Asia | 100.0 /100 | #13 | Exceptional 10.2% |
| Immigrants | Korea | 100.0 /100 | #14 | Exceptional 10.2% |
| Okinawans | 100.0 /100 | #15 | Exceptional 10.3% |
Demographics Similar to French American Indians by Disability
In terms of disability, the demographic groups most similar to French American Indians are Tlingit-Haida (13.5%, a difference of 0.080%), Shoshone (13.5%, a difference of 0.090%), Cape Verdean (13.5%, a difference of 0.14%), Blackfeet (13.6%, a difference of 0.61%), and Delaware (13.6%, a difference of 0.65%).
| Demographics | Rating | Rank | Disability |
| Immigrants | Micronesia | 0.0 /100 | #301 | Tragic 13.2% |
| Arapaho | 0.0 /100 | #302 | Tragic 13.2% |
| Scotch-Irish | 0.0 /100 | #303 | Tragic 13.3% |
| Yakama | 0.0 /100 | #304 | Tragic 13.4% |
| French Canadians | 0.0 /100 | #305 | Tragic 13.4% |
| Cape Verdeans | 0.0 /100 | #306 | Tragic 13.5% |
| Shoshone | 0.0 /100 | #307 | Tragic 13.5% |
| French American Indians | 0.0 /100 | #308 | Tragic 13.5% |
| Tlingit-Haida | 0.0 /100 | #309 | Tragic 13.5% |
| Blackfeet | 0.0 /100 | #310 | Tragic 13.6% |
| Delaware | 0.0 /100 | #311 | Tragic 13.6% |
| Spanish Americans | 0.0 /100 | #312 | Tragic 13.6% |
| Cree | 0.0 /100 | #313 | Tragic 13.7% |
| Blacks/African Americans | 0.0 /100 | #314 | Tragic 13.7% |
| Puget Sound Salish | 0.0 /100 | #315 | Tragic 13.7% |