Sioux vs Immigrants from Belarus Disability Age 5 to 17
COMPARE
Sioux
Immigrants from Belarus
Disability Age 5 to 17
Disability Age 5 to 17 Comparison
Sioux
Immigrants from Belarus
6.0%
DISABILITY AGE 5 TO 17
0.4/ 100
METRIC RATING
268th/ 347
METRIC RANK
5.0%
DISABILITY AGE 5 TO 17
100.0/ 100
METRIC RATING
37th/ 347
METRIC RANK
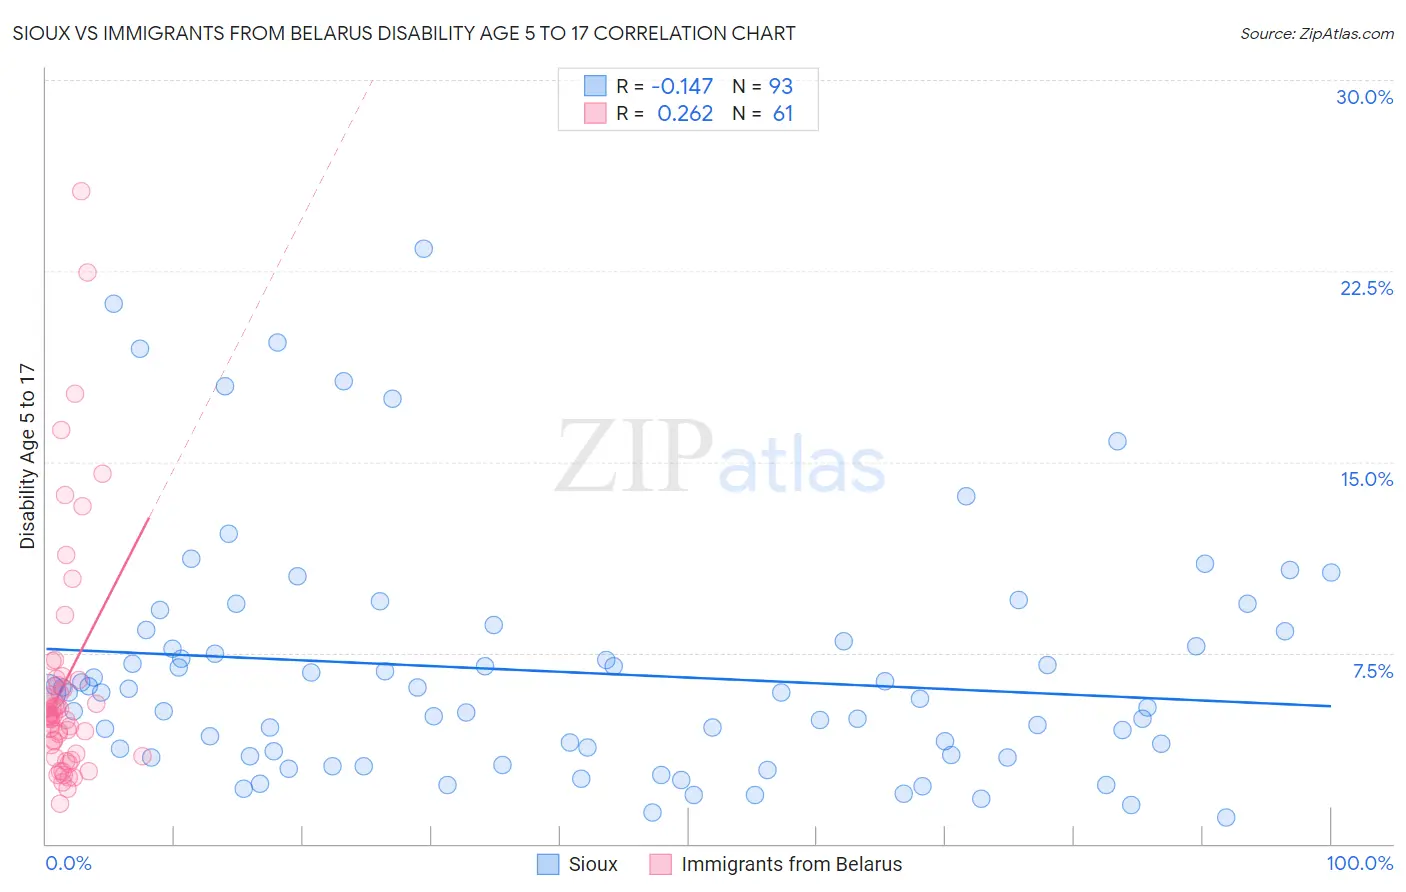
Sioux vs Immigrants from Belarus Disability Age 5 to 17 Correlation Chart
The statistical analysis conducted on geographies consisting of 232,872,632 people shows a poor negative correlation between the proportion of Sioux and percentage of population with a disability between the ages 5 and 17 in the United States with a correlation coefficient (R) of -0.147 and weighted average of 6.0%. Similarly, the statistical analysis conducted on geographies consisting of 149,676,434 people shows a weak positive correlation between the proportion of Immigrants from Belarus and percentage of population with a disability between the ages 5 and 17 in the United States with a correlation coefficient (R) of 0.262 and weighted average of 5.0%, a difference of 19.4%.
Disability Age 5 to 17 Correlation Summary
| Measurement | Sioux | Immigrants from Belarus |
| Minimum | 1.0% | 1.6% |
| Maximum | 23.4% | 25.7% |
| Range | 22.4% | 24.1% |
| Mean | 6.8% | 6.3% |
| Median | 5.9% | 5.0% |
| Interquartile 25% (IQ1) | 3.5% | 3.5% |
| Interquartile 75% (IQ3) | 8.2% | 6.3% |
| Interquartile Range (IQR) | 4.7% | 2.9% |
| Standard Deviation (Sample) | 4.7% | 4.7% |
| Standard Deviation (Population) | 4.7% | 4.7% |
Similar Demographics by Disability Age 5 to 17
Demographics Similar to Sioux by Disability Age 5 to 17
In terms of disability age 5 to 17, the demographic groups most similar to Sioux are Liberian (6.0%, a difference of 0.030%), Spanish (6.0%, a difference of 0.19%), Immigrants from Somalia (6.0%, a difference of 0.22%), Slovene (6.0%, a difference of 0.30%), and Panamanian (6.0%, a difference of 0.33%).
| Demographics | Rating | Rank | Disability Age 5 to 17 |
| Immigrants | Middle Africa | 0.7 /100 | #261 | Tragic 5.9% |
| Immigrants | Western Africa | 0.7 /100 | #262 | Tragic 5.9% |
| Czechoslovakians | 0.7 /100 | #263 | Tragic 5.9% |
| Canadians | 0.6 /100 | #264 | Tragic 6.0% |
| Panamanians | 0.6 /100 | #265 | Tragic 6.0% |
| Slovenes | 0.6 /100 | #266 | Tragic 6.0% |
| Spanish | 0.5 /100 | #267 | Tragic 6.0% |
| Sioux | 0.4 /100 | #268 | Tragic 6.0% |
| Liberians | 0.4 /100 | #269 | Tragic 6.0% |
| Immigrants | Somalia | 0.4 /100 | #270 | Tragic 6.0% |
| Immigrants | Zaire | 0.2 /100 | #271 | Tragic 6.0% |
| Finns | 0.2 /100 | #272 | Tragic 6.0% |
| Alaska Natives | 0.2 /100 | #273 | Tragic 6.0% |
| Cheyenne | 0.2 /100 | #274 | Tragic 6.0% |
| Dutch | 0.2 /100 | #275 | Tragic 6.0% |
Demographics Similar to Immigrants from Belarus by Disability Age 5 to 17
In terms of disability age 5 to 17, the demographic groups most similar to Immigrants from Belarus are Immigrants from Egypt (5.0%, a difference of 0.030%), Immigrants from Philippines (5.0%, a difference of 0.040%), Immigrants from Argentina (5.0%, a difference of 0.050%), Bolivian (5.0%, a difference of 0.070%), and Okinawan (5.0%, a difference of 0.13%).
| Demographics | Rating | Rank | Disability Age 5 to 17 |
| Immigrants | Malaysia | 100.0 /100 | #30 | Exceptional 5.0% |
| Immigrants | Pakistan | 100.0 /100 | #31 | Exceptional 5.0% |
| Soviet Union | 100.0 /100 | #32 | Exceptional 5.0% |
| Immigrants | Indonesia | 100.0 /100 | #33 | Exceptional 5.0% |
| Israelis | 100.0 /100 | #34 | Exceptional 5.0% |
| Bolivians | 100.0 /100 | #35 | Exceptional 5.0% |
| Immigrants | Egypt | 100.0 /100 | #36 | Exceptional 5.0% |
| Immigrants | Belarus | 100.0 /100 | #37 | Exceptional 5.0% |
| Immigrants | Philippines | 100.0 /100 | #38 | Exceptional 5.0% |
| Immigrants | Argentina | 100.0 /100 | #39 | Exceptional 5.0% |
| Okinawans | 100.0 /100 | #40 | Exceptional 5.0% |
| Immigrants | Australia | 100.0 /100 | #41 | Exceptional 5.0% |
| Immigrants | Sri Lanka | 100.0 /100 | #42 | Exceptional 5.0% |
| Immigrants | Russia | 100.0 /100 | #43 | Exceptional 5.0% |
| Egyptians | 100.0 /100 | #44 | Exceptional 5.0% |