Ukrainian vs Immigrants from Belarus Disability Age 5 to 17
COMPARE
Ukrainian
Immigrants from Belarus
Disability Age 5 to 17
Disability Age 5 to 17 Comparison
Ukrainians
Immigrants from Belarus
5.6%
DISABILITY AGE 5 TO 17
51.5/ 100
METRIC RATING
172nd/ 347
METRIC RANK
5.0%
DISABILITY AGE 5 TO 17
100.0/ 100
METRIC RATING
37th/ 347
METRIC RANK
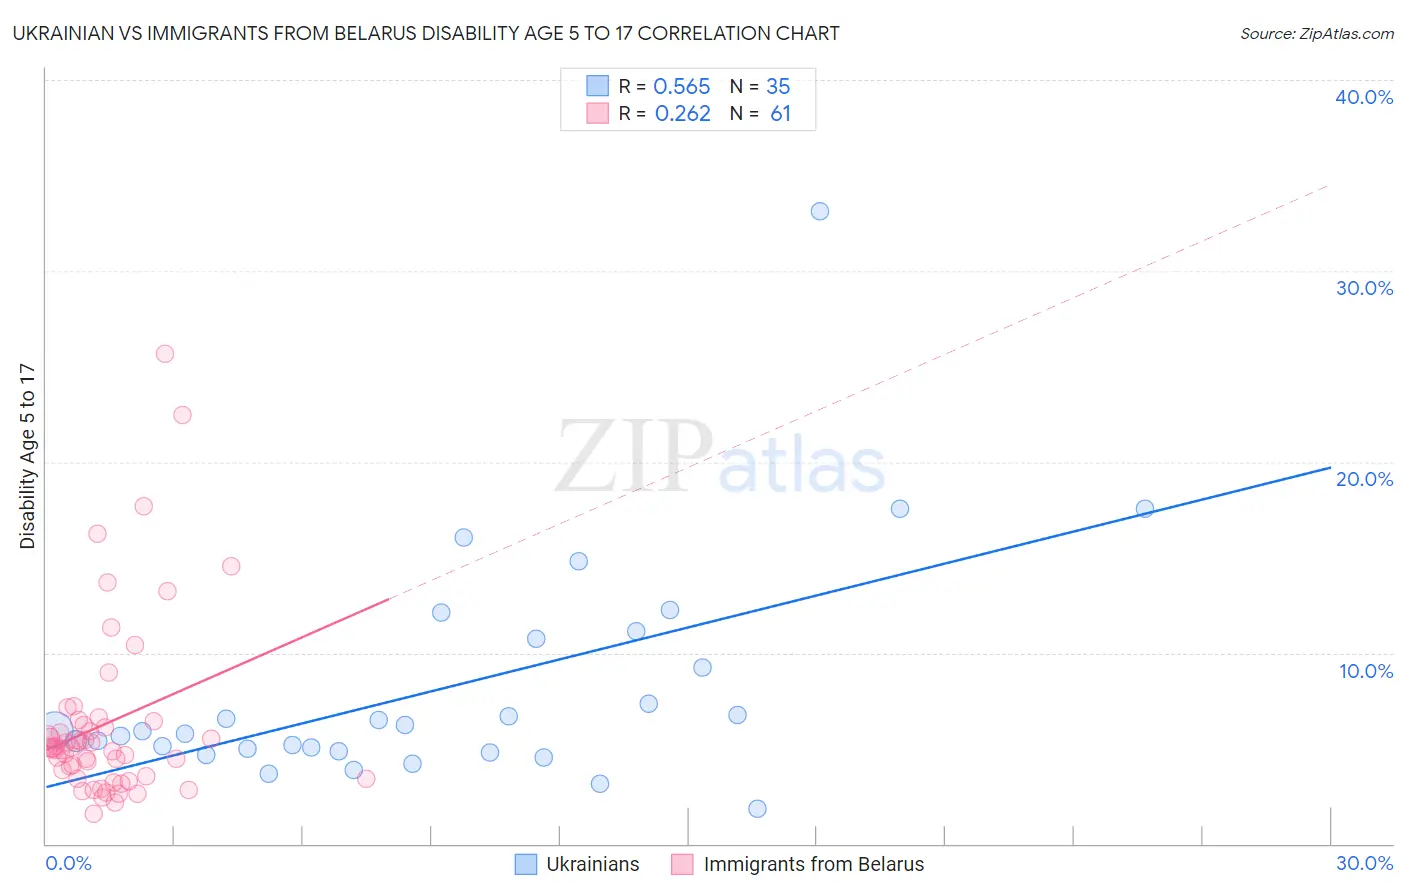
Ukrainian vs Immigrants from Belarus Disability Age 5 to 17 Correlation Chart
The statistical analysis conducted on geographies consisting of 442,807,363 people shows a substantial positive correlation between the proportion of Ukrainians and percentage of population with a disability between the ages 5 and 17 in the United States with a correlation coefficient (R) of 0.565 and weighted average of 5.6%. Similarly, the statistical analysis conducted on geographies consisting of 149,676,434 people shows a weak positive correlation between the proportion of Immigrants from Belarus and percentage of population with a disability between the ages 5 and 17 in the United States with a correlation coefficient (R) of 0.262 and weighted average of 5.0%, a difference of 11.7%.
Disability Age 5 to 17 Correlation Summary
| Measurement | Ukrainian | Immigrants from Belarus |
| Minimum | 1.8% | 1.6% |
| Maximum | 33.1% | 25.7% |
| Range | 31.3% | 24.1% |
| Mean | 8.1% | 6.3% |
| Median | 5.9% | 5.0% |
| Interquartile 25% (IQ1) | 4.8% | 3.5% |
| Interquartile 75% (IQ3) | 10.7% | 6.3% |
| Interquartile Range (IQR) | 5.9% | 2.9% |
| Standard Deviation (Sample) | 6.0% | 4.7% |
| Standard Deviation (Population) | 5.9% | 4.7% |
Similar Demographics by Disability Age 5 to 17
Demographics Similar to Ukrainians by Disability Age 5 to 17
In terms of disability age 5 to 17, the demographic groups most similar to Ukrainians are Uruguayan (5.6%, a difference of 0.030%), Costa Rican (5.6%, a difference of 0.080%), Shoshone (5.6%, a difference of 0.10%), Immigrants from Central America (5.6%, a difference of 0.11%), and Serbian (5.6%, a difference of 0.12%).
| Demographics | Rating | Rank | Disability Age 5 to 17 |
| Lebanese | 61.4 /100 | #165 | Good 5.6% |
| Greeks | 60.6 /100 | #166 | Good 5.6% |
| Immigrants | Burma/Myanmar | 59.3 /100 | #167 | Average 5.6% |
| Iraqis | 56.0 /100 | #168 | Average 5.6% |
| Immigrants | Norway | 55.7 /100 | #169 | Average 5.6% |
| Serbians | 54.0 /100 | #170 | Average 5.6% |
| Immigrants | Iraq | 53.9 /100 | #171 | Average 5.6% |
| Ukrainians | 51.5 /100 | #172 | Average 5.6% |
| Uruguayans | 51.0 /100 | #173 | Average 5.6% |
| Costa Ricans | 50.0 /100 | #174 | Average 5.6% |
| Shoshone | 49.4 /100 | #175 | Average 5.6% |
| Immigrants | Central America | 49.4 /100 | #176 | Average 5.6% |
| Immigrants | Western Europe | 47.8 /100 | #177 | Average 5.6% |
| Immigrants | Trinidad and Tobago | 47.6 /100 | #178 | Average 5.6% |
| Immigrants | Barbados | 40.5 /100 | #179 | Average 5.6% |
Demographics Similar to Immigrants from Belarus by Disability Age 5 to 17
In terms of disability age 5 to 17, the demographic groups most similar to Immigrants from Belarus are Immigrants from Egypt (5.0%, a difference of 0.030%), Immigrants from Philippines (5.0%, a difference of 0.040%), Immigrants from Argentina (5.0%, a difference of 0.050%), Bolivian (5.0%, a difference of 0.070%), and Okinawan (5.0%, a difference of 0.13%).
| Demographics | Rating | Rank | Disability Age 5 to 17 |
| Immigrants | Malaysia | 100.0 /100 | #30 | Exceptional 5.0% |
| Immigrants | Pakistan | 100.0 /100 | #31 | Exceptional 5.0% |
| Soviet Union | 100.0 /100 | #32 | Exceptional 5.0% |
| Immigrants | Indonesia | 100.0 /100 | #33 | Exceptional 5.0% |
| Israelis | 100.0 /100 | #34 | Exceptional 5.0% |
| Bolivians | 100.0 /100 | #35 | Exceptional 5.0% |
| Immigrants | Egypt | 100.0 /100 | #36 | Exceptional 5.0% |
| Immigrants | Belarus | 100.0 /100 | #37 | Exceptional 5.0% |
| Immigrants | Philippines | 100.0 /100 | #38 | Exceptional 5.0% |
| Immigrants | Argentina | 100.0 /100 | #39 | Exceptional 5.0% |
| Okinawans | 100.0 /100 | #40 | Exceptional 5.0% |
| Immigrants | Australia | 100.0 /100 | #41 | Exceptional 5.0% |
| Immigrants | Sri Lanka | 100.0 /100 | #42 | Exceptional 5.0% |
| Immigrants | Russia | 100.0 /100 | #43 | Exceptional 5.0% |
| Egyptians | 100.0 /100 | #44 | Exceptional 5.0% |