Albanian vs Immigrants from Germany Male Disability
COMPARE
Albanian
Immigrants from Germany
Male Disability
Male Disability Comparison
Albanians
Immigrants from Germany
11.1%
MALE DISABILITY
66.5/ 100
METRIC RATING
160th/ 347
METRIC RANK
12.3%
MALE DISABILITY
0.1/ 100
METRIC RATING
267th/ 347
METRIC RANK
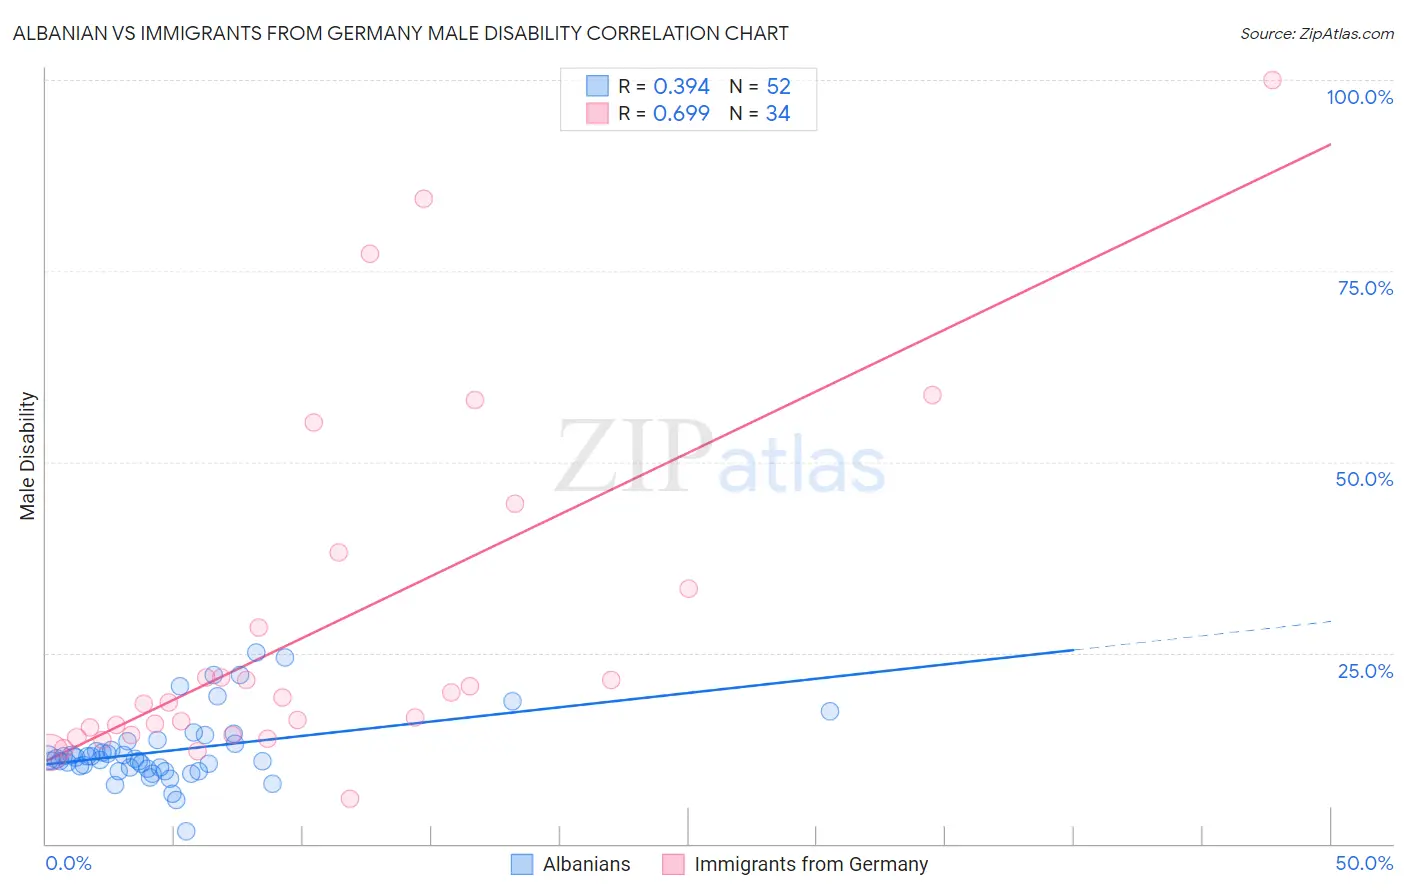
Albanian vs Immigrants from Germany Male Disability Correlation Chart
The statistical analysis conducted on geographies consisting of 193,257,433 people shows a mild positive correlation between the proportion of Albanians and percentage of males with a disability in the United States with a correlation coefficient (R) of 0.394 and weighted average of 11.1%. Similarly, the statistical analysis conducted on geographies consisting of 463,850,065 people shows a significant positive correlation between the proportion of Immigrants from Germany and percentage of males with a disability in the United States with a correlation coefficient (R) of 0.699 and weighted average of 12.3%, a difference of 10.4%.
Male Disability Correlation Summary
| Measurement | Albanian | Immigrants from Germany |
| Minimum | 1.7% | 5.9% |
| Maximum | 25.0% | 100.0% |
| Range | 23.3% | 94.1% |
| Mean | 12.2% | 28.5% |
| Median | 11.1% | 18.8% |
| Interquartile 25% (IQ1) | 9.9% | 14.2% |
| Interquartile 75% (IQ3) | 13.3% | 33.3% |
| Interquartile Range (IQR) | 3.4% | 19.1% |
| Standard Deviation (Sample) | 4.6% | 23.0% |
| Standard Deviation (Population) | 4.5% | 22.7% |
Similar Demographics by Male Disability
Demographics Similar to Albanians by Male Disability
In terms of male disability, the demographic groups most similar to Albanians are Guatemalan (11.1%, a difference of 0.040%), Immigrants from West Indies (11.1%, a difference of 0.050%), Immigrants from Haiti (11.1%, a difference of 0.070%), Latvian (11.1%, a difference of 0.11%), and Immigrants from Kenya (11.1%, a difference of 0.16%).
| Demographics | Rating | Rank | Male Disability |
| Immigrants | Northern Europe | 73.2 /100 | #153 | Good 11.1% |
| Immigrants | Moldova | 72.8 /100 | #154 | Good 11.1% |
| Immigrants | Middle Africa | 70.9 /100 | #155 | Good 11.1% |
| Russians | 69.8 /100 | #156 | Good 11.1% |
| Immigrants | Western Africa | 69.2 /100 | #157 | Good 11.1% |
| Latvians | 68.1 /100 | #158 | Good 11.1% |
| Guatemalans | 67.2 /100 | #159 | Good 11.1% |
| Albanians | 66.5 /100 | #160 | Good 11.1% |
| Immigrants | West Indies | 65.7 /100 | #161 | Good 11.1% |
| Immigrants | Haiti | 65.3 /100 | #162 | Good 11.1% |
| Immigrants | Kenya | 63.8 /100 | #163 | Good 11.1% |
| British West Indians | 62.8 /100 | #164 | Good 11.1% |
| Luxembourgers | 61.9 /100 | #165 | Good 11.1% |
| Immigrants | Hungary | 61.2 /100 | #166 | Good 11.1% |
| Immigrants | Southern Europe | 54.4 /100 | #167 | Average 11.2% |
Demographics Similar to Immigrants from Germany by Male Disability
In terms of male disability, the demographic groups most similar to Immigrants from Germany are Hawaiian (12.3%, a difference of 0.050%), Immigrants from Portugal (12.3%, a difference of 0.070%), Portuguese (12.3%, a difference of 0.13%), Czechoslovakian (12.3%, a difference of 0.13%), and Spaniard (12.3%, a difference of 0.21%).
| Demographics | Rating | Rank | Male Disability |
| Swedes | 0.3 /100 | #260 | Tragic 12.1% |
| Slavs | 0.2 /100 | #261 | Tragic 12.2% |
| Norwegians | 0.2 /100 | #262 | Tragic 12.2% |
| Canadians | 0.2 /100 | #263 | Tragic 12.2% |
| Nepalese | 0.2 /100 | #264 | Tragic 12.2% |
| Immigrants | Portugal | 0.1 /100 | #265 | Tragic 12.3% |
| Hawaiians | 0.1 /100 | #266 | Tragic 12.3% |
| Immigrants | Germany | 0.1 /100 | #267 | Tragic 12.3% |
| Portuguese | 0.1 /100 | #268 | Tragic 12.3% |
| Czechoslovakians | 0.1 /100 | #269 | Tragic 12.3% |
| Spaniards | 0.1 /100 | #270 | Tragic 12.3% |
| Scandinavians | 0.1 /100 | #271 | Tragic 12.3% |
| Hmong | 0.0 /100 | #272 | Tragic 12.5% |
| Native Hawaiians | 0.0 /100 | #273 | Tragic 12.5% |
| Hopi | 0.0 /100 | #274 | Tragic 12.5% |