Albanian vs Bermudan Male Disability
COMPARE
Albanian
Bermudan
Male Disability
Male Disability Comparison
Albanians
Bermudans
11.1%
MALE DISABILITY
66.5/ 100
METRIC RATING
160th/ 347
METRIC RANK
11.8%
MALE DISABILITY
2.3/ 100
METRIC RATING
229th/ 347
METRIC RANK
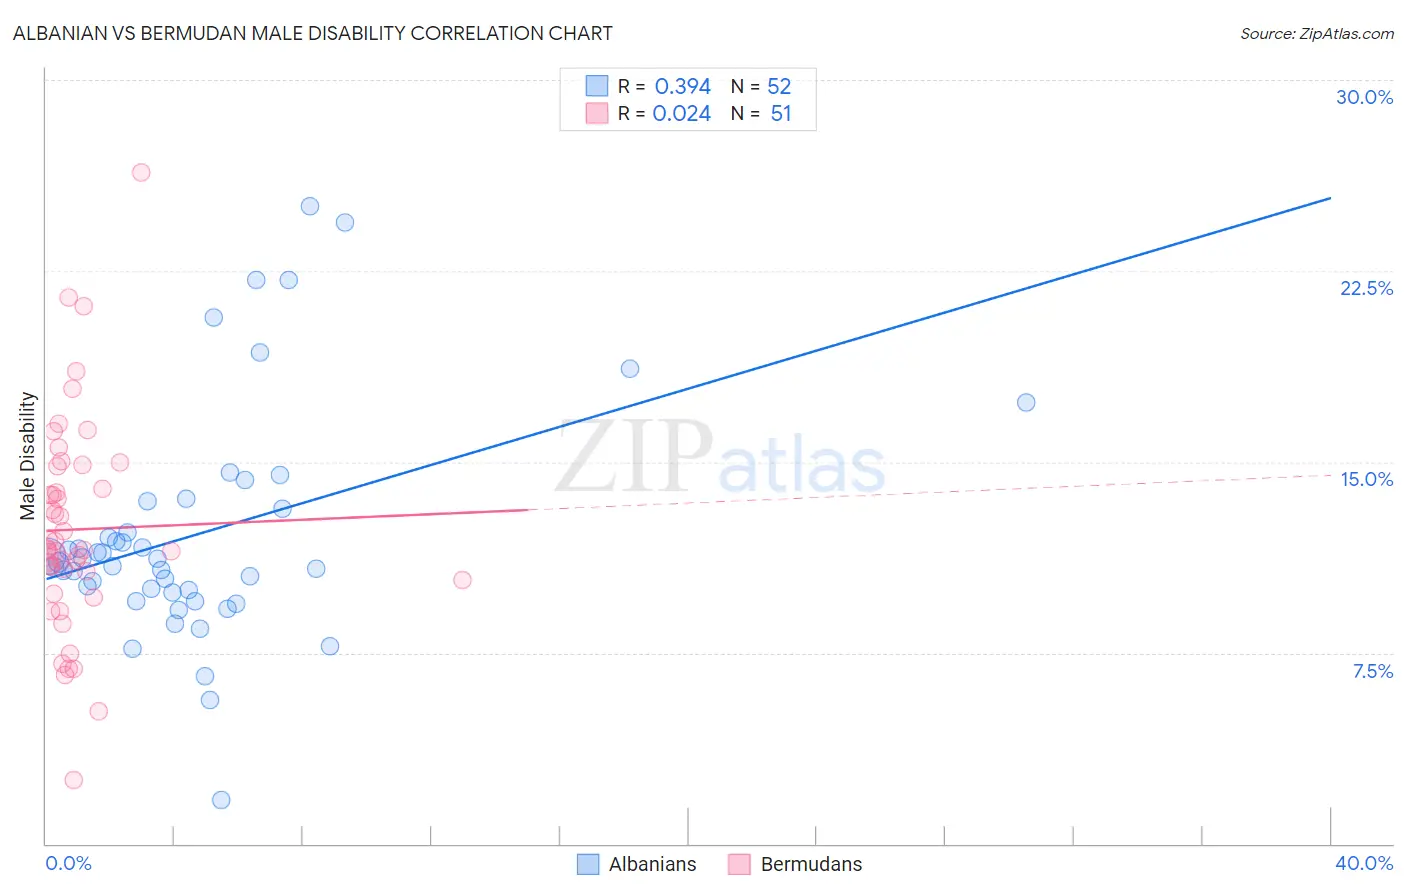
Albanian vs Bermudan Male Disability Correlation Chart
The statistical analysis conducted on geographies consisting of 193,257,433 people shows a mild positive correlation between the proportion of Albanians and percentage of males with a disability in the United States with a correlation coefficient (R) of 0.394 and weighted average of 11.1%. Similarly, the statistical analysis conducted on geographies consisting of 55,719,731 people shows no correlation between the proportion of Bermudans and percentage of males with a disability in the United States with a correlation coefficient (R) of 0.024 and weighted average of 11.8%, a difference of 6.2%.
Male Disability Correlation Summary
| Measurement | Albanian | Bermudan |
| Minimum | 1.7% | 2.5% |
| Maximum | 25.0% | 26.4% |
| Range | 23.3% | 23.9% |
| Mean | 12.2% | 12.3% |
| Median | 11.1% | 11.5% |
| Interquartile 25% (IQ1) | 9.9% | 10.3% |
| Interquartile 75% (IQ3) | 13.3% | 14.8% |
| Interquartile Range (IQR) | 3.4% | 4.5% |
| Standard Deviation (Sample) | 4.6% | 4.2% |
| Standard Deviation (Population) | 4.5% | 4.2% |
Similar Demographics by Male Disability
Demographics Similar to Albanians by Male Disability
In terms of male disability, the demographic groups most similar to Albanians are Guatemalan (11.1%, a difference of 0.040%), Immigrants from West Indies (11.1%, a difference of 0.050%), Immigrants from Haiti (11.1%, a difference of 0.070%), Latvian (11.1%, a difference of 0.11%), and Immigrants from Kenya (11.1%, a difference of 0.16%).
| Demographics | Rating | Rank | Male Disability |
| Immigrants | Northern Europe | 73.2 /100 | #153 | Good 11.1% |
| Immigrants | Moldova | 72.8 /100 | #154 | Good 11.1% |
| Immigrants | Middle Africa | 70.9 /100 | #155 | Good 11.1% |
| Russians | 69.8 /100 | #156 | Good 11.1% |
| Immigrants | Western Africa | 69.2 /100 | #157 | Good 11.1% |
| Latvians | 68.1 /100 | #158 | Good 11.1% |
| Guatemalans | 67.2 /100 | #159 | Good 11.1% |
| Albanians | 66.5 /100 | #160 | Good 11.1% |
| Immigrants | West Indies | 65.7 /100 | #161 | Good 11.1% |
| Immigrants | Haiti | 65.3 /100 | #162 | Good 11.1% |
| Immigrants | Kenya | 63.8 /100 | #163 | Good 11.1% |
| British West Indians | 62.8 /100 | #164 | Good 11.1% |
| Luxembourgers | 61.9 /100 | #165 | Good 11.1% |
| Immigrants | Hungary | 61.2 /100 | #166 | Good 11.1% |
| Immigrants | Southern Europe | 54.4 /100 | #167 | Average 11.2% |
Demographics Similar to Bermudans by Male Disability
In terms of male disability, the demographic groups most similar to Bermudans are Hispanic or Latino (11.8%, a difference of 0.030%), Croatian (11.8%, a difference of 0.090%), Austrian (11.8%, a difference of 0.11%), Dominican (11.8%, a difference of 0.28%), and Subsaharan African (11.8%, a difference of 0.29%).
| Demographics | Rating | Rank | Male Disability |
| Alsatians | 3.3 /100 | #222 | Tragic 11.7% |
| Immigrants | Bahamas | 3.2 /100 | #223 | Tragic 11.7% |
| Japanese | 3.1 /100 | #224 | Tragic 11.7% |
| Liberians | 3.1 /100 | #225 | Tragic 11.8% |
| Sub-Saharan Africans | 2.8 /100 | #226 | Tragic 11.8% |
| Austrians | 2.5 /100 | #227 | Tragic 11.8% |
| Hispanics or Latinos | 2.3 /100 | #228 | Tragic 11.8% |
| Bermudans | 2.3 /100 | #229 | Tragic 11.8% |
| Croatians | 2.1 /100 | #230 | Tragic 11.8% |
| Dominicans | 1.8 /100 | #231 | Tragic 11.8% |
| Malaysians | 1.8 /100 | #232 | Tragic 11.8% |
| Mexicans | 1.7 /100 | #233 | Tragic 11.8% |
| Immigrants | Canada | 1.6 /100 | #234 | Tragic 11.9% |
| Immigrants | North America | 1.5 /100 | #235 | Tragic 11.9% |
| U.S. Virgin Islanders | 1.3 /100 | #236 | Tragic 11.9% |