Albanian vs Osage Male Disability
COMPARE
Albanian
Osage
Male Disability
Male Disability Comparison
Albanians
Osage
11.1%
MALE DISABILITY
66.5/ 100
METRIC RATING
160th/ 347
METRIC RANK
14.0%
MALE DISABILITY
0.0/ 100
METRIC RATING
323rd/ 347
METRIC RANK
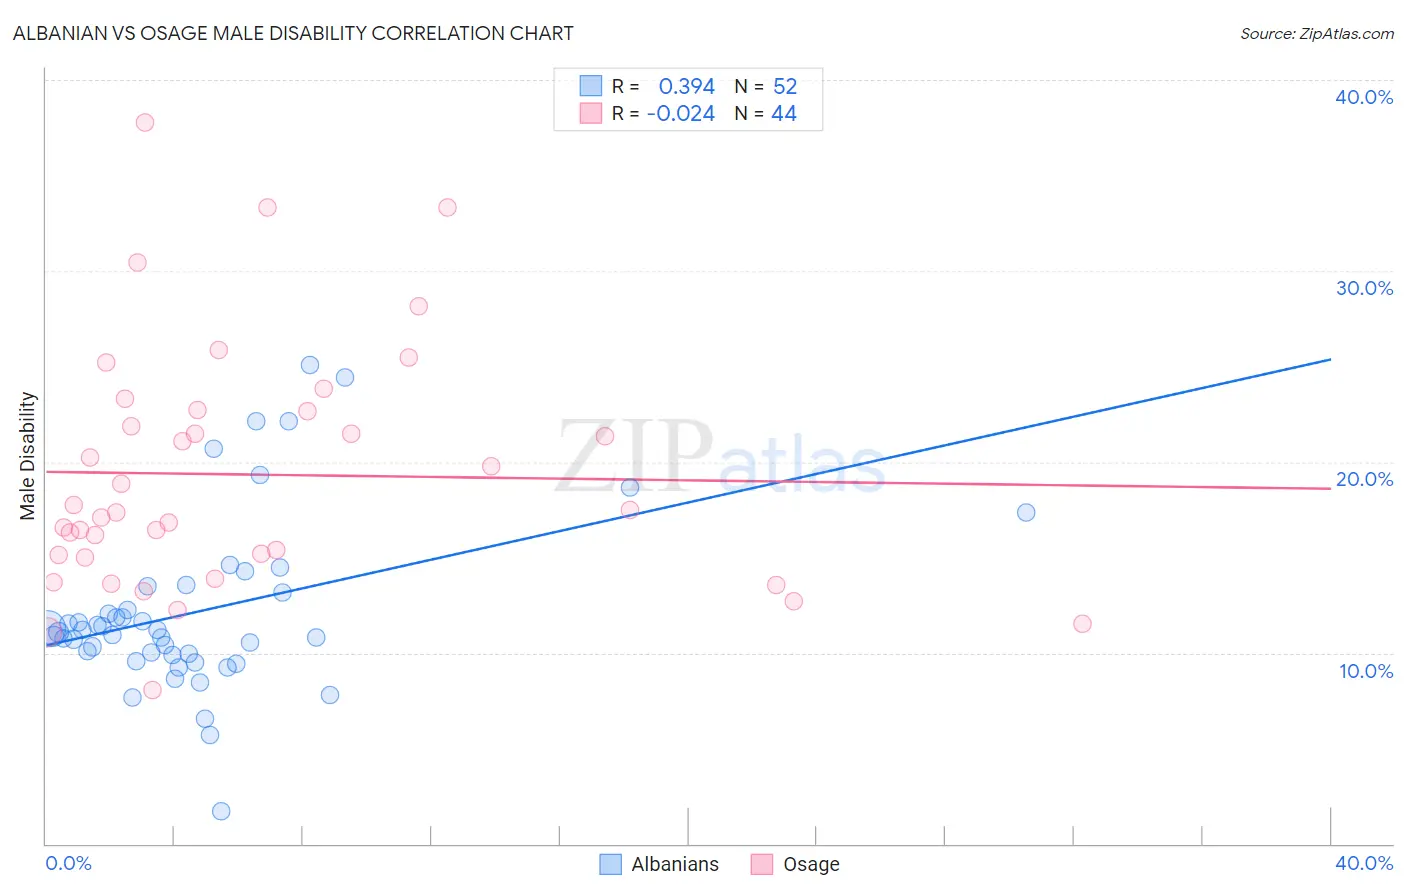
Albanian vs Osage Male Disability Correlation Chart
The statistical analysis conducted on geographies consisting of 193,257,433 people shows a mild positive correlation between the proportion of Albanians and percentage of males with a disability in the United States with a correlation coefficient (R) of 0.394 and weighted average of 11.1%. Similarly, the statistical analysis conducted on geographies consisting of 91,798,879 people shows no correlation between the proportion of Osage and percentage of males with a disability in the United States with a correlation coefficient (R) of -0.024 and weighted average of 14.0%, a difference of 26.1%.
Male Disability Correlation Summary
| Measurement | Albanian | Osage |
| Minimum | 1.7% | 8.0% |
| Maximum | 25.0% | 37.7% |
| Range | 23.3% | 29.7% |
| Mean | 12.2% | 19.3% |
| Median | 11.1% | 17.4% |
| Interquartile 25% (IQ1) | 9.9% | 15.1% |
| Interquartile 75% (IQ3) | 13.3% | 22.7% |
| Interquartile Range (IQR) | 3.4% | 7.6% |
| Standard Deviation (Sample) | 4.6% | 6.4% |
| Standard Deviation (Population) | 4.5% | 6.4% |
Similar Demographics by Male Disability
Demographics Similar to Albanians by Male Disability
In terms of male disability, the demographic groups most similar to Albanians are Guatemalan (11.1%, a difference of 0.040%), Immigrants from West Indies (11.1%, a difference of 0.050%), Immigrants from Haiti (11.1%, a difference of 0.070%), Latvian (11.1%, a difference of 0.11%), and Immigrants from Kenya (11.1%, a difference of 0.16%).
| Demographics | Rating | Rank | Male Disability |
| Immigrants | Northern Europe | 73.2 /100 | #153 | Good 11.1% |
| Immigrants | Moldova | 72.8 /100 | #154 | Good 11.1% |
| Immigrants | Middle Africa | 70.9 /100 | #155 | Good 11.1% |
| Russians | 69.8 /100 | #156 | Good 11.1% |
| Immigrants | Western Africa | 69.2 /100 | #157 | Good 11.1% |
| Latvians | 68.1 /100 | #158 | Good 11.1% |
| Guatemalans | 67.2 /100 | #159 | Good 11.1% |
| Albanians | 66.5 /100 | #160 | Good 11.1% |
| Immigrants | West Indies | 65.7 /100 | #161 | Good 11.1% |
| Immigrants | Haiti | 65.3 /100 | #162 | Good 11.1% |
| Immigrants | Kenya | 63.8 /100 | #163 | Good 11.1% |
| British West Indians | 62.8 /100 | #164 | Good 11.1% |
| Luxembourgers | 61.9 /100 | #165 | Good 11.1% |
| Immigrants | Hungary | 61.2 /100 | #166 | Good 11.1% |
| Immigrants | Southern Europe | 54.4 /100 | #167 | Average 11.2% |
Demographics Similar to Osage by Male Disability
In terms of male disability, the demographic groups most similar to Osage are Apache (14.0%, a difference of 0.070%), Comanche (14.1%, a difference of 0.33%), Ottawa (14.1%, a difference of 0.44%), Shoshone (13.8%, a difference of 1.2%), and Tlingit-Haida (13.8%, a difference of 1.3%).
| Demographics | Rating | Rank | Male Disability |
| Alaska Natives | 0.0 /100 | #316 | Tragic 13.6% |
| Paiute | 0.0 /100 | #317 | Tragic 13.7% |
| Cree | 0.0 /100 | #318 | Tragic 13.7% |
| Americans | 0.0 /100 | #319 | Tragic 13.8% |
| Tlingit-Haida | 0.0 /100 | #320 | Tragic 13.8% |
| Shoshone | 0.0 /100 | #321 | Tragic 13.8% |
| Apache | 0.0 /100 | #322 | Tragic 14.0% |
| Osage | 0.0 /100 | #323 | Tragic 14.0% |
| Comanche | 0.0 /100 | #324 | Tragic 14.1% |
| Ottawa | 0.0 /100 | #325 | Tragic 14.1% |
| Natives/Alaskans | 0.0 /100 | #326 | Tragic 14.2% |
| Potawatomi | 0.0 /100 | #327 | Tragic 14.2% |
| Chippewa | 0.0 /100 | #328 | Tragic 14.3% |
| Cajuns | 0.0 /100 | #329 | Tragic 14.4% |
| Navajo | 0.0 /100 | #330 | Tragic 14.4% |