Immigrants from Caribbean vs Nigerian Male Disability
COMPARE
Immigrants from Caribbean
Nigerian
Male Disability
Male Disability Comparison
Immigrants from Caribbean
Nigerians
11.3%
MALE DISABILITY
41.4/ 100
METRIC RATING
179th/ 347
METRIC RANK
11.0%
MALE DISABILITY
81.9/ 100
METRIC RATING
138th/ 347
METRIC RANK
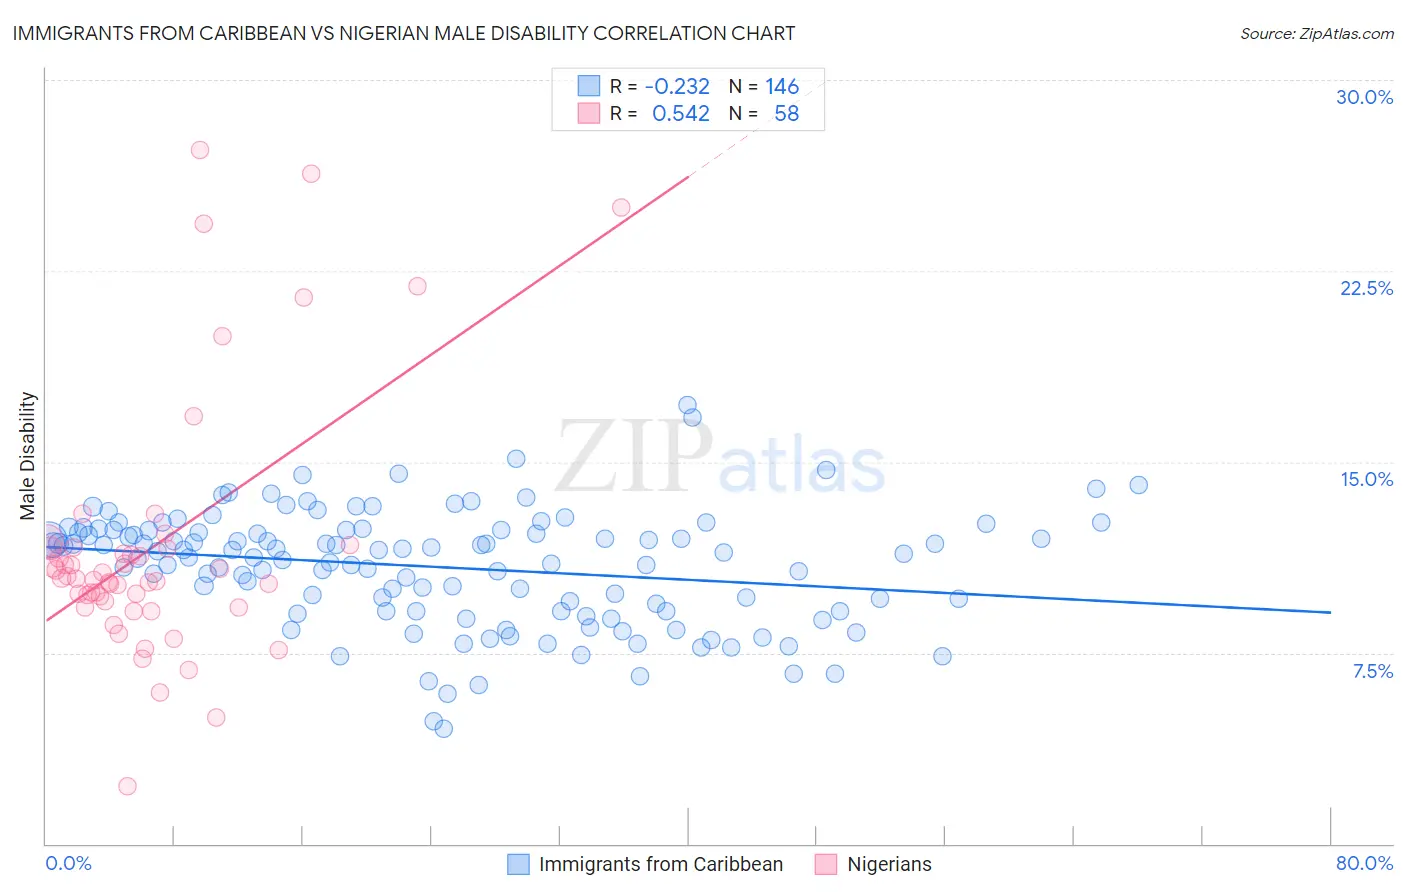
Immigrants from Caribbean vs Nigerian Male Disability Correlation Chart
The statistical analysis conducted on geographies consisting of 449,911,553 people shows a weak negative correlation between the proportion of Immigrants from Caribbean and percentage of males with a disability in the United States with a correlation coefficient (R) of -0.232 and weighted average of 11.3%. Similarly, the statistical analysis conducted on geographies consisting of 332,727,494 people shows a substantial positive correlation between the proportion of Nigerians and percentage of males with a disability in the United States with a correlation coefficient (R) of 0.542 and weighted average of 11.0%, a difference of 2.6%.
Male Disability Correlation Summary
| Measurement | Immigrants from Caribbean | Nigerian |
| Minimum | 4.5% | 2.2% |
| Maximum | 17.2% | 27.3% |
| Range | 12.7% | 25.0% |
| Mean | 10.9% | 11.7% |
| Median | 11.4% | 10.4% |
| Interquartile 25% (IQ1) | 9.2% | 9.5% |
| Interquartile 75% (IQ3) | 12.3% | 11.6% |
| Interquartile Range (IQR) | 3.2% | 2.1% |
| Standard Deviation (Sample) | 2.3% | 5.0% |
| Standard Deviation (Population) | 2.2% | 5.0% |
Similar Demographics by Male Disability
Demographics Similar to Immigrants from Caribbean by Male Disability
In terms of male disability, the demographic groups most similar to Immigrants from Caribbean are Honduran (11.3%, a difference of 0.020%), Australian (11.3%, a difference of 0.040%), Immigrants from Norway (11.3%, a difference of 0.15%), Syrian (11.2%, a difference of 0.29%), and Immigrants from Honduras (11.2%, a difference of 0.41%).
| Demographics | Rating | Rank | Male Disability |
| Romanians | 50.7 /100 | #172 | Average 11.2% |
| Immigrants | Burma/Myanmar | 50.4 /100 | #173 | Average 11.2% |
| Maltese | 50.0 /100 | #174 | Average 11.2% |
| Immigrants | Honduras | 48.7 /100 | #175 | Average 11.2% |
| Syrians | 46.6 /100 | #176 | Average 11.2% |
| Immigrants | Norway | 44.2 /100 | #177 | Average 11.3% |
| Australians | 42.2 /100 | #178 | Average 11.3% |
| Immigrants | Caribbean | 41.4 /100 | #179 | Average 11.3% |
| Hondurans | 41.1 /100 | #180 | Average 11.3% |
| Immigrants | Senegal | 34.4 /100 | #181 | Fair 11.3% |
| Immigrants | Belize | 33.7 /100 | #182 | Fair 11.3% |
| Immigrants | Central America | 32.9 /100 | #183 | Fair 11.3% |
| Iraqis | 30.5 /100 | #184 | Fair 11.3% |
| Pakistanis | 30.3 /100 | #185 | Fair 11.3% |
| Immigrants | Zaire | 27.6 /100 | #186 | Fair 11.4% |
Demographics Similar to Nigerians by Male Disability
In terms of male disability, the demographic groups most similar to Nigerians are Immigrants from Europe (11.0%, a difference of 0.010%), South African (11.0%, a difference of 0.020%), Immigrants from Italy (11.0%, a difference of 0.030%), Arab (11.0%, a difference of 0.040%), and Immigrants from Sudan (11.0%, a difference of 0.040%).
| Demographics | Rating | Rank | Male Disability |
| Macedonians | 84.2 /100 | #131 | Excellent 11.0% |
| Immigrants | Fiji | 84.0 /100 | #132 | Excellent 11.0% |
| Ugandans | 83.9 /100 | #133 | Excellent 11.0% |
| Bhutanese | 83.4 /100 | #134 | Excellent 11.0% |
| Trinidadians and Tobagonians | 83.3 /100 | #135 | Excellent 11.0% |
| Immigrants | Costa Rica | 82.8 /100 | #136 | Excellent 11.0% |
| Immigrants | Europe | 82.0 /100 | #137 | Excellent 11.0% |
| Nigerians | 81.9 /100 | #138 | Excellent 11.0% |
| South Africans | 81.7 /100 | #139 | Excellent 11.0% |
| Immigrants | Italy | 81.5 /100 | #140 | Excellent 11.0% |
| Arabs | 81.5 /100 | #141 | Excellent 11.0% |
| Immigrants | Sudan | 81.5 /100 | #142 | Excellent 11.0% |
| Moroccans | 80.7 /100 | #143 | Excellent 11.0% |
| Kenyans | 78.1 /100 | #144 | Good 11.0% |
| Costa Ricans | 78.0 /100 | #145 | Good 11.0% |