Serbian vs Nigerian Male Disability
COMPARE
Serbian
Nigerian
Male Disability
Male Disability Comparison
Serbians
Nigerians
11.5%
MALE DISABILITY
10.7/ 100
METRIC RATING
205th/ 347
METRIC RANK
11.0%
MALE DISABILITY
81.9/ 100
METRIC RATING
138th/ 347
METRIC RANK
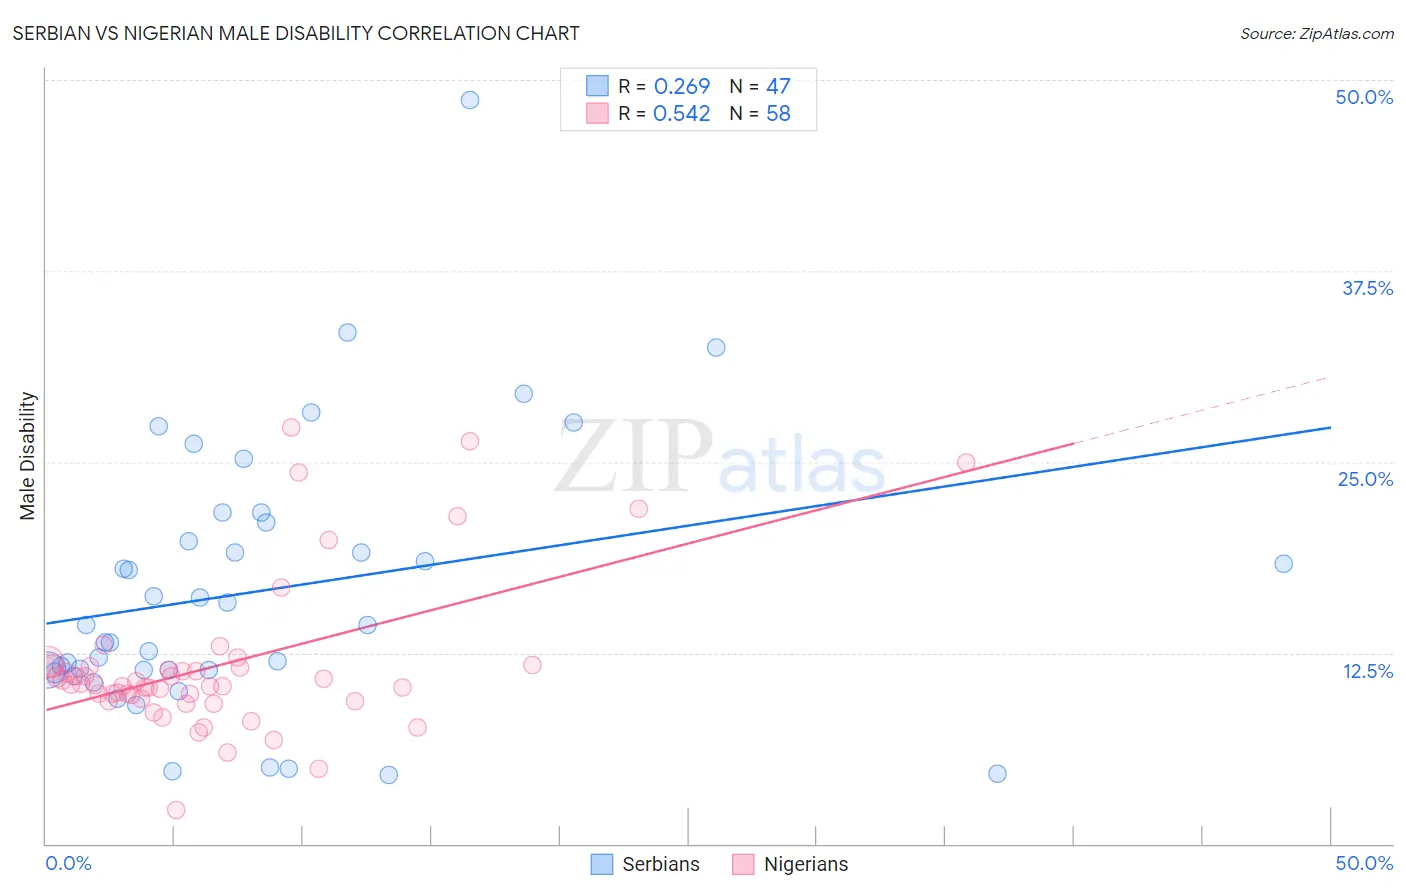
Serbian vs Nigerian Male Disability Correlation Chart
The statistical analysis conducted on geographies consisting of 267,640,230 people shows a weak positive correlation between the proportion of Serbians and percentage of males with a disability in the United States with a correlation coefficient (R) of 0.269 and weighted average of 11.5%. Similarly, the statistical analysis conducted on geographies consisting of 332,727,494 people shows a substantial positive correlation between the proportion of Nigerians and percentage of males with a disability in the United States with a correlation coefficient (R) of 0.542 and weighted average of 11.0%, a difference of 5.1%.
Male Disability Correlation Summary
| Measurement | Serbian | Nigerian |
| Minimum | 4.5% | 2.2% |
| Maximum | 48.7% | 27.3% |
| Range | 44.3% | 25.0% |
| Mean | 16.6% | 11.7% |
| Median | 14.3% | 10.4% |
| Interquartile 25% (IQ1) | 11.3% | 9.5% |
| Interquartile 75% (IQ3) | 21.0% | 11.6% |
| Interquartile Range (IQR) | 9.7% | 2.1% |
| Standard Deviation (Sample) | 8.8% | 5.0% |
| Standard Deviation (Population) | 8.8% | 5.0% |
Similar Demographics by Male Disability
Demographics Similar to Serbians by Male Disability
In terms of male disability, the demographic groups most similar to Serbians are Immigrants from Cambodia (11.5%, a difference of 0.0%), Ukrainian (11.5%, a difference of 0.010%), Jamaican (11.5%, a difference of 0.020%), Immigrants from Somalia (11.5%, a difference of 0.040%), and Icelander (11.6%, a difference of 0.080%).
| Demographics | Rating | Rank | Male Disability |
| Immigrants | Jamaica | 16.3 /100 | #198 | Poor 11.5% |
| Lebanese | 15.4 /100 | #199 | Poor 11.5% |
| Immigrants | Iraq | 13.0 /100 | #200 | Poor 11.5% |
| Immigrants | Panama | 13.0 /100 | #201 | Poor 11.5% |
| Immigrants | Mexico | 12.6 /100 | #202 | Poor 11.5% |
| Jamaicans | 10.9 /100 | #203 | Poor 11.5% |
| Immigrants | Cambodia | 10.8 /100 | #204 | Poor 11.5% |
| Serbians | 10.7 /100 | #205 | Poor 11.5% |
| Ukrainians | 10.6 /100 | #206 | Poor 11.5% |
| Immigrants | Somalia | 10.4 /100 | #207 | Poor 11.5% |
| Icelanders | 10.1 /100 | #208 | Poor 11.6% |
| Spanish American Indians | 10.1 /100 | #209 | Poor 11.6% |
| Ute | 9.4 /100 | #210 | Tragic 11.6% |
| Immigrants | Thailand | 8.4 /100 | #211 | Tragic 11.6% |
| Immigrants | Scotland | 8.2 /100 | #212 | Tragic 11.6% |
Demographics Similar to Nigerians by Male Disability
In terms of male disability, the demographic groups most similar to Nigerians are Immigrants from Europe (11.0%, a difference of 0.010%), South African (11.0%, a difference of 0.020%), Immigrants from Italy (11.0%, a difference of 0.030%), Arab (11.0%, a difference of 0.040%), and Immigrants from Sudan (11.0%, a difference of 0.040%).
| Demographics | Rating | Rank | Male Disability |
| Macedonians | 84.2 /100 | #131 | Excellent 11.0% |
| Immigrants | Fiji | 84.0 /100 | #132 | Excellent 11.0% |
| Ugandans | 83.9 /100 | #133 | Excellent 11.0% |
| Bhutanese | 83.4 /100 | #134 | Excellent 11.0% |
| Trinidadians and Tobagonians | 83.3 /100 | #135 | Excellent 11.0% |
| Immigrants | Costa Rica | 82.8 /100 | #136 | Excellent 11.0% |
| Immigrants | Europe | 82.0 /100 | #137 | Excellent 11.0% |
| Nigerians | 81.9 /100 | #138 | Excellent 11.0% |
| South Africans | 81.7 /100 | #139 | Excellent 11.0% |
| Immigrants | Italy | 81.5 /100 | #140 | Excellent 11.0% |
| Arabs | 81.5 /100 | #141 | Excellent 11.0% |
| Immigrants | Sudan | 81.5 /100 | #142 | Excellent 11.0% |
| Moroccans | 80.7 /100 | #143 | Excellent 11.0% |
| Kenyans | 78.1 /100 | #144 | Good 11.0% |
| Costa Ricans | 78.0 /100 | #145 | Good 11.0% |