Alaskan Athabascan vs Nigerian Currently Married
COMPARE
Alaskan Athabascan
Nigerian
Currently Married
Currently Married Comparison
Alaskan Athabascans
Nigerians
44.6%
CURRENTLY MARRIED
0.9/ 100
METRIC RATING
235th/ 347
METRIC RANK
43.4%
CURRENTLY MARRIED
0.1/ 100
METRIC RATING
274th/ 347
METRIC RANK
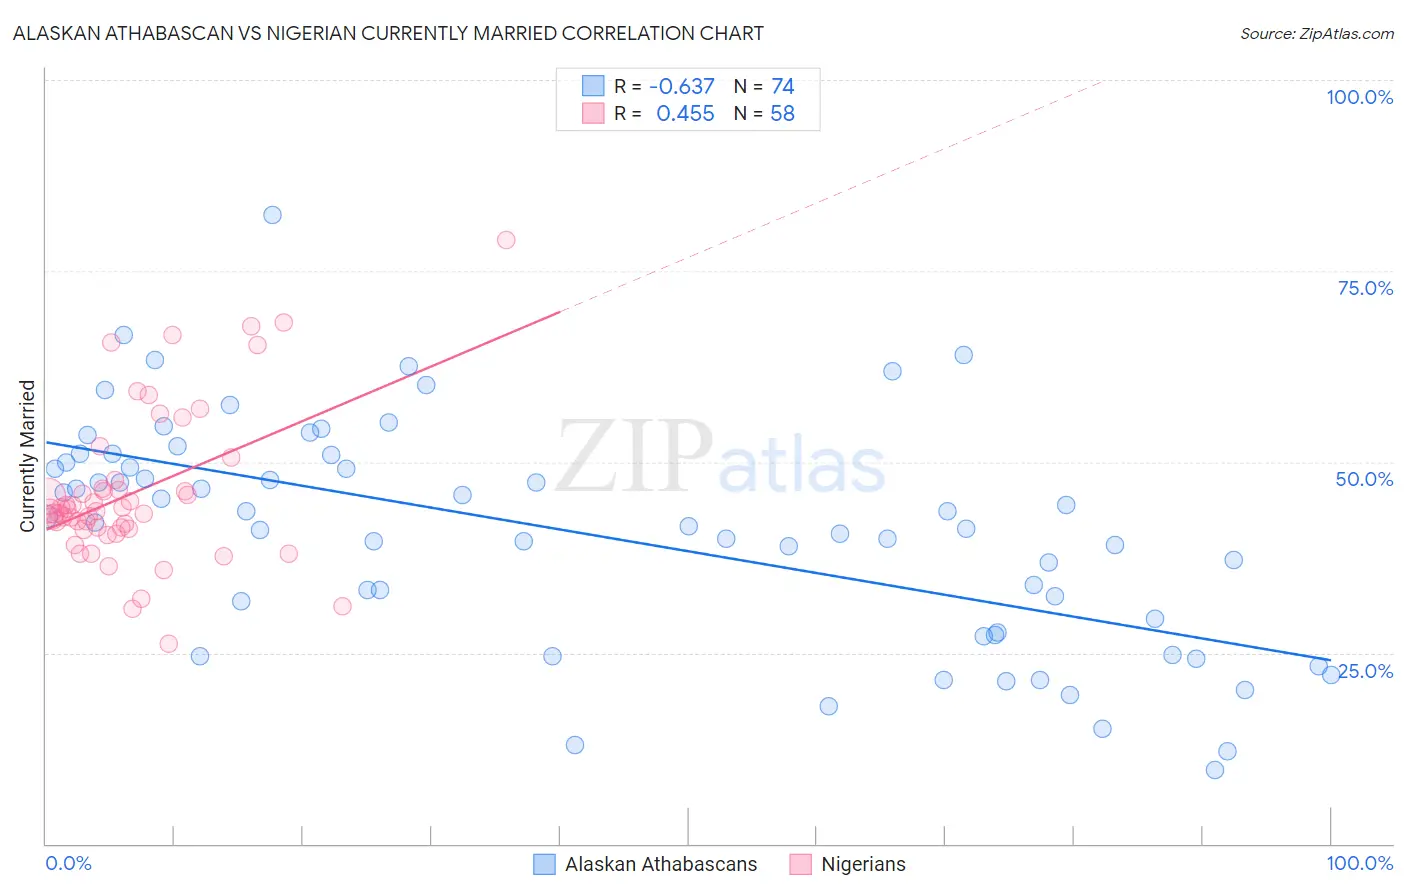
Alaskan Athabascan vs Nigerian Currently Married Correlation Chart
The statistical analysis conducted on geographies consisting of 45,820,219 people shows a significant negative correlation between the proportion of Alaskan Athabascans and percentage of population currently married in the United States with a correlation coefficient (R) of -0.637 and weighted average of 44.6%. Similarly, the statistical analysis conducted on geographies consisting of 332,730,636 people shows a moderate positive correlation between the proportion of Nigerians and percentage of population currently married in the United States with a correlation coefficient (R) of 0.455 and weighted average of 43.4%, a difference of 2.8%.
Currently Married Correlation Summary
| Measurement | Alaskan Athabascan | Nigerian |
| Minimum | 9.6% | 26.3% |
| Maximum | 82.4% | 79.1% |
| Range | 72.8% | 52.8% |
| Mean | 40.6% | 46.0% |
| Median | 41.9% | 43.6% |
| Interquartile 25% (IQ1) | 27.7% | 41.3% |
| Interquartile 75% (IQ3) | 49.9% | 46.5% |
| Interquartile Range (IQR) | 22.2% | 5.2% |
| Standard Deviation (Sample) | 14.7% | 10.1% |
| Standard Deviation (Population) | 14.6% | 10.0% |
Similar Demographics by Currently Married
Demographics Similar to Alaskan Athabascans by Currently Married
In terms of currently married, the demographic groups most similar to Alaskan Athabascans are Cuban (44.6%, a difference of 0.010%), Seminole (44.6%, a difference of 0.010%), Moroccan (44.6%, a difference of 0.090%), Immigrants from Saudi Arabia (44.7%, a difference of 0.16%), and Iroquois (44.7%, a difference of 0.16%).
| Demographics | Rating | Rank | Currently Married |
| Immigrants | Uruguay | 2.0 /100 | #228 | Tragic 45.0% |
| Cree | 1.7 /100 | #229 | Tragic 44.9% |
| Immigrants | Kenya | 1.6 /100 | #230 | Tragic 44.9% |
| Immigrants | Panama | 1.5 /100 | #231 | Tragic 44.9% |
| Nepalese | 1.2 /100 | #232 | Tragic 44.7% |
| Immigrants | Saudi Arabia | 1.1 /100 | #233 | Tragic 44.7% |
| Iroquois | 1.1 /100 | #234 | Tragic 44.7% |
| Alaskan Athabascans | 0.9 /100 | #235 | Tragic 44.6% |
| Cubans | 0.9 /100 | #236 | Tragic 44.6% |
| Seminole | 0.9 /100 | #237 | Tragic 44.6% |
| Moroccans | 0.9 /100 | #238 | Tragic 44.6% |
| Immigrants | Mexico | 0.7 /100 | #239 | Tragic 44.5% |
| Mexican American Indians | 0.7 /100 | #240 | Tragic 44.5% |
| Ethiopians | 0.7 /100 | #241 | Tragic 44.5% |
| Immigrants | Cambodia | 0.7 /100 | #242 | Tragic 44.5% |
Demographics Similar to Nigerians by Currently Married
In terms of currently married, the demographic groups most similar to Nigerians are Yaqui (43.4%, a difference of 0.020%), Colville (43.4%, a difference of 0.020%), Sierra Leonean (43.4%, a difference of 0.050%), Indonesian (43.5%, a difference of 0.060%), and Immigrants from Nigeria (43.4%, a difference of 0.060%).
| Demographics | Rating | Rank | Currently Married |
| Immigrants | Eritrea | 0.1 /100 | #267 | Tragic 43.6% |
| Spanish American Indians | 0.1 /100 | #268 | Tragic 43.6% |
| Immigrants | Sudan | 0.1 /100 | #269 | Tragic 43.5% |
| Salvadorans | 0.1 /100 | #270 | Tragic 43.5% |
| Bermudans | 0.1 /100 | #271 | Tragic 43.5% |
| Indonesians | 0.1 /100 | #272 | Tragic 43.5% |
| Yaqui | 0.1 /100 | #273 | Tragic 43.4% |
| Nigerians | 0.1 /100 | #274 | Tragic 43.4% |
| Colville | 0.1 /100 | #275 | Tragic 43.4% |
| Sierra Leoneans | 0.1 /100 | #276 | Tragic 43.4% |
| Immigrants | Nigeria | 0.1 /100 | #277 | Tragic 43.4% |
| Central Americans | 0.0 /100 | #278 | Tragic 43.3% |
| Central American Indians | 0.0 /100 | #279 | Tragic 43.3% |
| Apache | 0.0 /100 | #280 | Tragic 43.2% |
| Chippewa | 0.0 /100 | #281 | Tragic 43.2% |