Alaskan Athabascan vs Nigerian 10th Grade
COMPARE
Alaskan Athabascan
Nigerian
10th Grade
10th Grade Comparison
Alaskan Athabascans
Nigerians
95.4%
10TH GRADE
100.0/ 100
METRIC RATING
27th/ 347
METRIC RANK
93.1%
10TH GRADE
4.2/ 100
METRIC RATING
238th/ 347
METRIC RANK
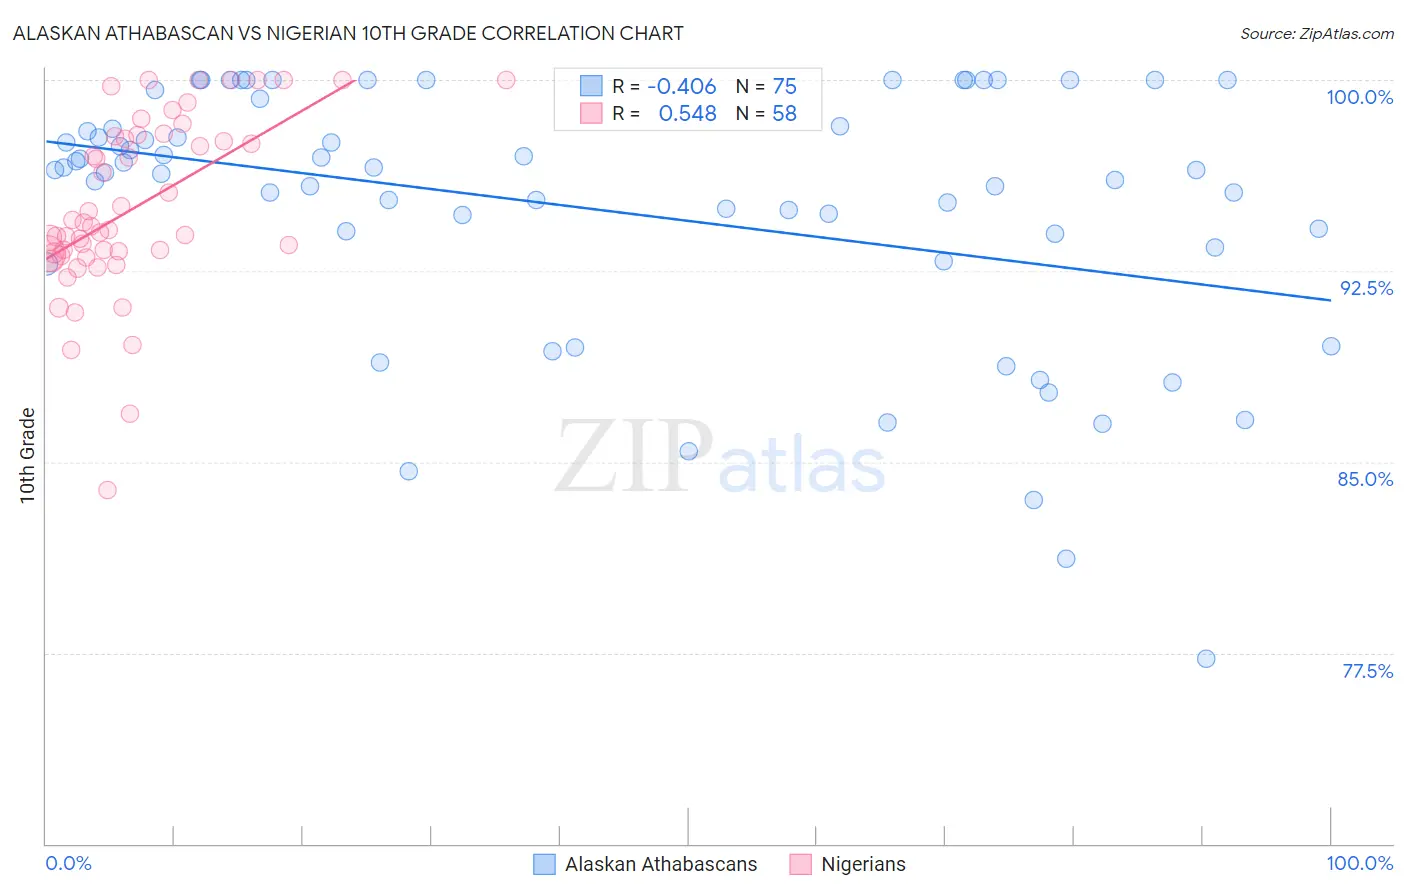
Alaskan Athabascan vs Nigerian 10th Grade Correlation Chart
The statistical analysis conducted on geographies consisting of 45,820,444 people shows a moderate negative correlation between the proportion of Alaskan Athabascans and percentage of population with at least 10th grade education in the United States with a correlation coefficient (R) of -0.406 and weighted average of 95.4%. Similarly, the statistical analysis conducted on geographies consisting of 332,724,627 people shows a substantial positive correlation between the proportion of Nigerians and percentage of population with at least 10th grade education in the United States with a correlation coefficient (R) of 0.548 and weighted average of 93.1%, a difference of 2.5%.
10th Grade Correlation Summary
| Measurement | Alaskan Athabascan | Nigerian |
| Minimum | 77.3% | 83.9% |
| Maximum | 100.0% | 100.0% |
| Range | 22.7% | 16.1% |
| Mean | 94.9% | 95.0% |
| Median | 96.4% | 94.2% |
| Interquartile 25% (IQ1) | 93.4% | 93.2% |
| Interquartile 75% (IQ3) | 98.2% | 97.8% |
| Interquartile Range (IQR) | 4.8% | 4.6% |
| Standard Deviation (Sample) | 5.1% | 3.5% |
| Standard Deviation (Population) | 5.1% | 3.4% |
Similar Demographics by 10th Grade
Demographics Similar to Alaskan Athabascans by 10th Grade
In terms of 10th grade, the demographic groups most similar to Alaskan Athabascans are Luxembourger (95.4%, a difference of 0.0%), Welsh (95.5%, a difference of 0.020%), Bulgarian (95.4%, a difference of 0.030%), European (95.5%, a difference of 0.040%), and Maltese (95.5%, a difference of 0.040%).
| Demographics | Rating | Rank | 10th Grade |
| Chinese | 100.0 /100 | #20 | Exceptional 95.5% |
| Dutch | 100.0 /100 | #21 | Exceptional 95.5% |
| Eastern Europeans | 100.0 /100 | #22 | Exceptional 95.5% |
| Czechs | 100.0 /100 | #23 | Exceptional 95.5% |
| Europeans | 100.0 /100 | #24 | Exceptional 95.5% |
| Maltese | 100.0 /100 | #25 | Exceptional 95.5% |
| Welsh | 100.0 /100 | #26 | Exceptional 95.5% |
| Alaskan Athabascans | 100.0 /100 | #27 | Exceptional 95.4% |
| Luxembourgers | 100.0 /100 | #28 | Exceptional 95.4% |
| Bulgarians | 100.0 /100 | #29 | Exceptional 95.4% |
| Belgians | 100.0 /100 | #30 | Exceptional 95.4% |
| Iranians | 100.0 /100 | #31 | Exceptional 95.3% |
| Hungarians | 100.0 /100 | #32 | Exceptional 95.3% |
| French | 100.0 /100 | #33 | Exceptional 95.3% |
| British | 99.9 /100 | #34 | Exceptional 95.3% |
Demographics Similar to Nigerians by 10th Grade
In terms of 10th grade, the demographic groups most similar to Nigerians are Costa Rican (93.1%, a difference of 0.0%), Immigrants from Hong Kong (93.1%, a difference of 0.0%), Immigrants from Panama (93.1%, a difference of 0.010%), African (93.1%, a difference of 0.020%), and Afghan (93.1%, a difference of 0.020%).
| Demographics | Rating | Rank | 10th Grade |
| South American Indians | 4.9 /100 | #231 | Tragic 93.1% |
| Bahamians | 4.9 /100 | #232 | Tragic 93.1% |
| Comanche | 4.9 /100 | #233 | Tragic 93.1% |
| Sub-Saharan Africans | 4.7 /100 | #234 | Tragic 93.1% |
| Africans | 4.6 /100 | #235 | Tragic 93.1% |
| Afghans | 4.5 /100 | #236 | Tragic 93.1% |
| Immigrants | Panama | 4.3 /100 | #237 | Tragic 93.1% |
| Nigerians | 4.2 /100 | #238 | Tragic 93.1% |
| Costa Ricans | 4.2 /100 | #239 | Tragic 93.1% |
| Immigrants | Hong Kong | 4.2 /100 | #240 | Tragic 93.1% |
| Immigrants | Somalia | 2.7 /100 | #241 | Tragic 93.0% |
| Immigrants | Cameroon | 2.6 /100 | #242 | Tragic 93.0% |
| Senegalese | 2.4 /100 | #243 | Tragic 93.0% |
| Spanish Americans | 2.1 /100 | #244 | Tragic 92.9% |
| Uruguayans | 1.8 /100 | #245 | Tragic 92.9% |