Zip Codes with the Highest Percentage of Population Taking Taxi / Cab to Work in Montrose, CO
RELATED REPORTS & OPTIONS
Taxi / Cab
Montrose
Compare Zip Codes
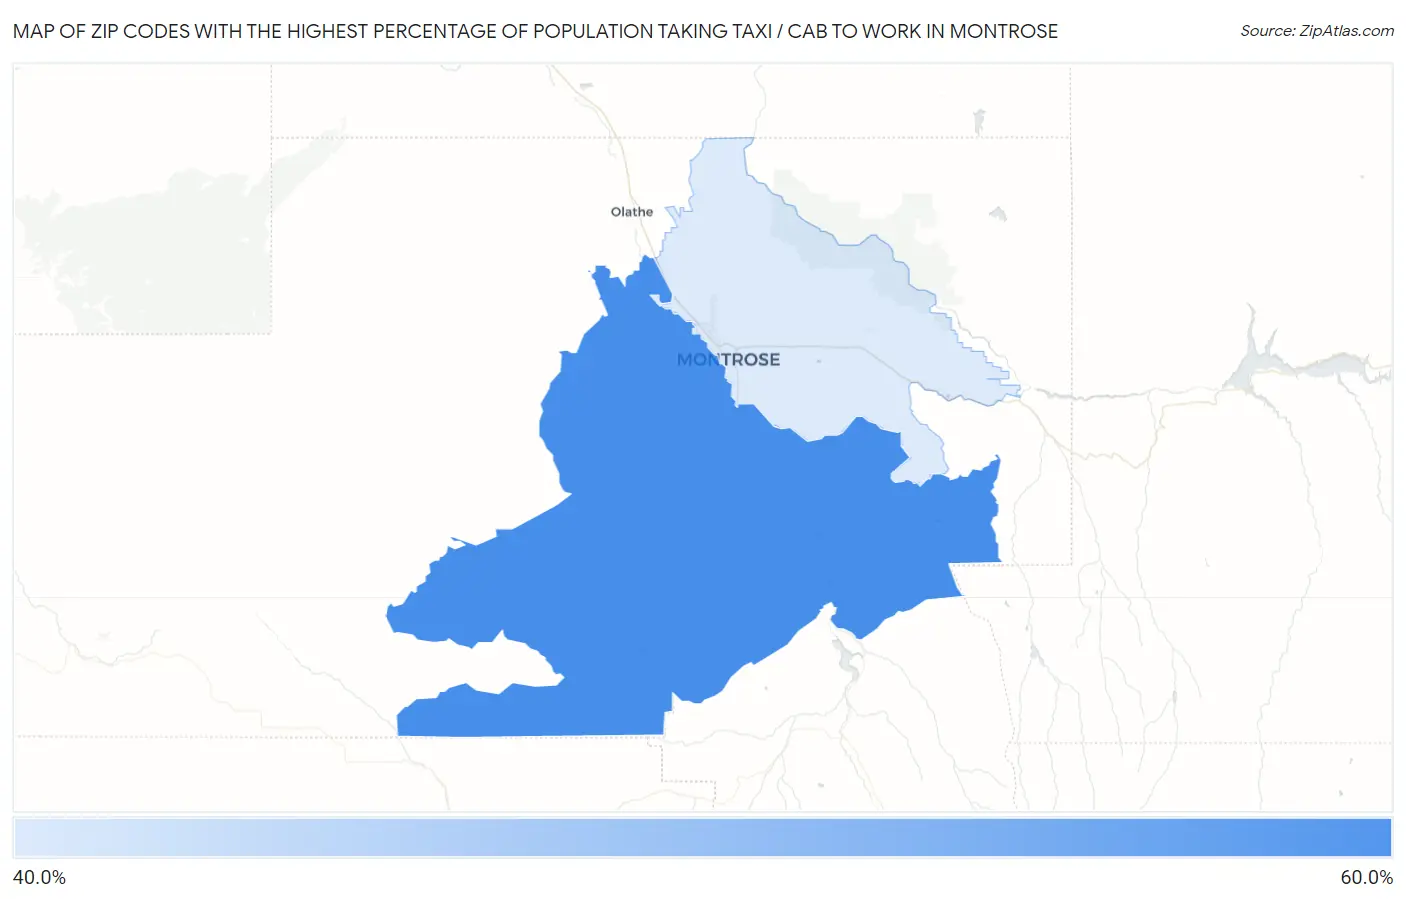
Map of Zip Codes with the Highest Percentage of Population Taking Taxi / Cab to Work in Montrose
47.1%
53.3%
Zip Codes with the Highest Percentage of Population Taking Taxi / Cab to Work in Montrose, CO
| Zip Code | % Take Taxi / Cab | vs State | vs National | |
| 1. | 81403 | 53.3% | 37.4%(+15.9)#25 | 38.2%(+15.1)#2,040 |
| 2. | 81401 | 47.1% | 37.4%(+9.70)#60 | 38.2%(+8.90)#3,942 |
1
Common Questions
What are the Top Zip Codes with the Highest Percentage of Population Taking Taxi / Cab to Work in Montrose, CO?
Top Zip Codes with the Highest Percentage of Population Taking Taxi / Cab to Work in Montrose, CO are:
What zip code has the Highest Percentage of Population Taking Taxi / Cab to Work in Montrose, CO?
81403 has the Highest Percentage of Population Taking Taxi / Cab to Work in Montrose, CO with 53.3%.
What is the Percentage of Population Taking Taxi / Cab to Work in Montrose, CO?
Percentage of Population Taking Taxi / Cab to Work in Montrose is 42.9%.
What is the Percentage of Population Taking Taxi / Cab to Work in Colorado?
Percentage of Population Taking Taxi / Cab to Work in Colorado is 37.4%.
What is the Percentage of Population Taking Taxi / Cab to Work in the United States?
Percentage of Population Taking Taxi / Cab to Work in the United States is 38.2%.