Westby, WI Map & Demographics
Westby Map
Westby Overview
$33,937
PER CAPITA INCOME
$81,389
AVG FAMILY INCOME
$66,741
AVG HOUSEHOLD INCOME
36.1%
WAGE / INCOME GAP [ % ]
63.9¢/ $1
WAGE / INCOME GAP [ $ ]
0.35
INEQUALITY / GINI INDEX
2,318
TOTAL POPULATION
1,144
MALE POPULATION
1,174
FEMALE POPULATION
97.44
MALES / 100 FEMALES
102.62
FEMALES / 100 MALES
40.5
MEDIAN AGE
3.3
AVG FAMILY SIZE
2.4
AVG HOUSEHOLD SIZE
1,218
LABOR FORCE [ PEOPLE ]
67.5%
PERCENT IN LABOR FORCE
2.5%
UNEMPLOYMENT RATE
Westby Zip Codes
Westby Area Codes
Income in Westby
Income Overview in Westby
Per Capita Income in Westby is $33,937, while median incomes of families and households are $81,389 and $66,741 respectively.
| Characteristic | Number | Measure |
| Per Capita Income | 2,318 | $33,937 |
| Median Family Income | 526 | $81,389 |
| Mean Family Income | 526 | $92,536 |
| Median Household Income | 973 | $66,741 |
| Mean Household Income | 973 | $78,045 |
| Income Deficit | 526 | $0 |
| Wage / Income Gap (%) | 2,318 | 36.10% |
| Wage / Income Gap ($) | 2,318 | 63.90¢ per $1 |
| Gini / Inequality Index | 2,318 | 0.35 |
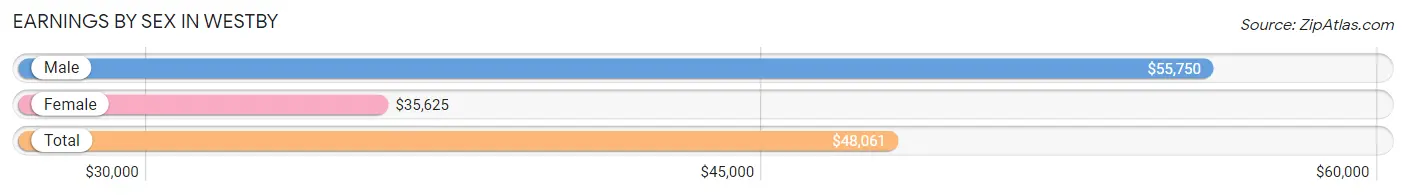
Earnings by Sex in Westby
Average Earnings in Westby are $48,061, $55,750 for men and $35,625 for women, a difference of 36.1%.
| Sex | Number | Average Earnings |
| Male | 689 (54.5%) | $55,750 |
| Female | 575 (45.5%) | $35,625 |
| Total | 1,264 (100.0%) | $48,061 |
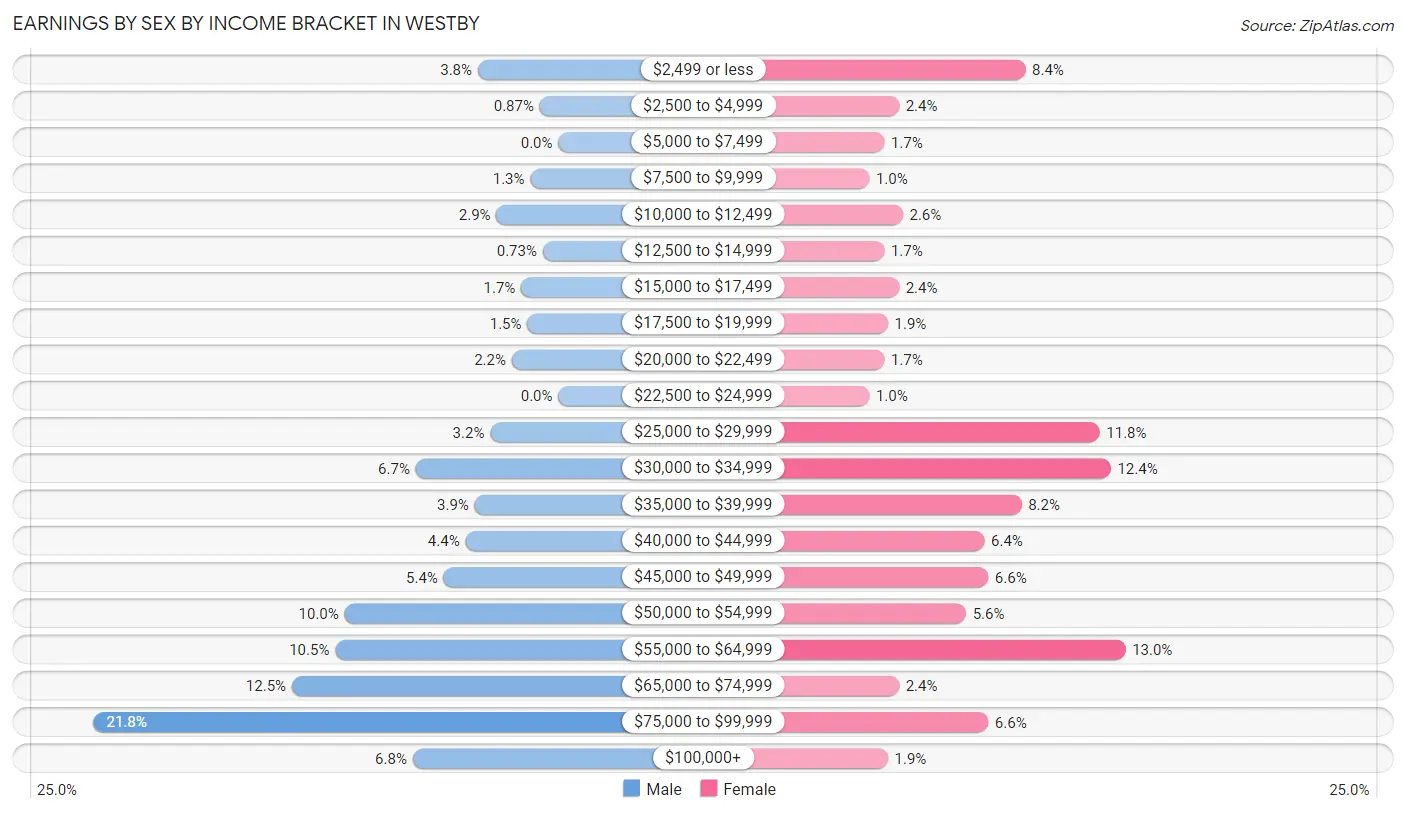
Earnings by Sex by Income Bracket in Westby
The most common earnings brackets in Westby are $75,000 to $99,999 for men (150 | 21.8%) and $55,000 to $64,999 for women (75 | 13.0%).
| Income | Male | Female |
| $2,499 or less | 26 (3.8%) | 48 (8.4%) |
| $2,500 to $4,999 | 6 (0.9%) | 14 (2.4%) |
| $5,000 to $7,499 | 0 (0.0%) | 10 (1.7%) |
| $7,500 to $9,999 | 9 (1.3%) | 6 (1.0%) |
| $10,000 to $12,499 | 20 (2.9%) | 15 (2.6%) |
| $12,500 to $14,999 | 5 (0.7%) | 10 (1.7%) |
| $15,000 to $17,499 | 12 (1.7%) | 14 (2.4%) |
| $17,500 to $19,999 | 10 (1.5%) | 11 (1.9%) |
| $20,000 to $22,499 | 15 (2.2%) | 10 (1.7%) |
| $22,500 to $24,999 | 0 (0.0%) | 6 (1.0%) |
| $25,000 to $29,999 | 22 (3.2%) | 68 (11.8%) |
| $30,000 to $34,999 | 46 (6.7%) | 71 (12.3%) |
| $35,000 to $39,999 | 27 (3.9%) | 47 (8.2%) |
| $40,000 to $44,999 | 30 (4.3%) | 37 (6.4%) |
| $45,000 to $49,999 | 37 (5.4%) | 38 (6.6%) |
| $50,000 to $54,999 | 69 (10.0%) | 32 (5.6%) |
| $55,000 to $64,999 | 72 (10.4%) | 75 (13.0%) |
| $65,000 to $74,999 | 86 (12.5%) | 14 (2.4%) |
| $75,000 to $99,999 | 150 (21.8%) | 38 (6.6%) |
| $100,000+ | 47 (6.8%) | 11 (1.9%) |
| Total | 689 (100.0%) | 575 (100.0%) |
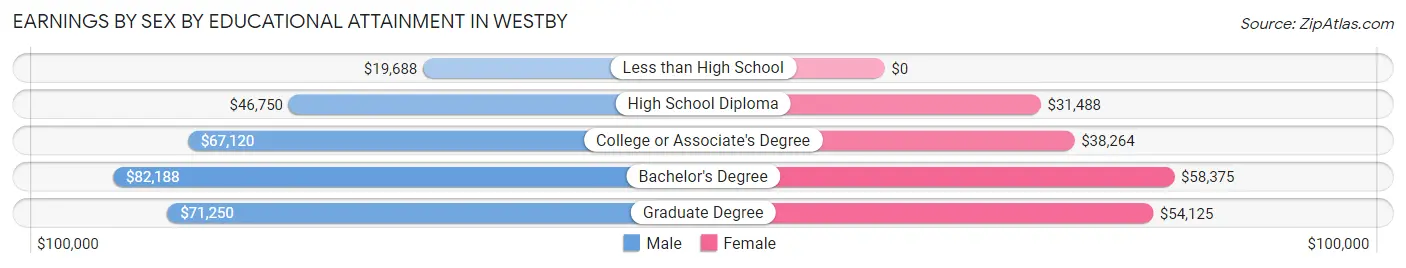
Earnings by Sex by Educational Attainment in Westby
Average earnings in Westby are $56,759 for men and $38,125 for women, a difference of 32.8%. Men with an educational attainment of bachelor's degree enjoy the highest average annual earnings of $82,188, while those with less than high school education earn the least with $19,688. Women with an educational attainment of bachelor's degree earn the most with the average annual earnings of $58,375, while those with high school diploma education have the smallest earnings of $31,488.
| Educational Attainment | Male Income | Female Income |
| Less than High School | $19,688 | $0 |
| High School Diploma | $46,750 | $31,488 |
| College or Associate's Degree | $67,120 | $38,264 |
| Bachelor's Degree | $82,188 | $58,375 |
| Graduate Degree | $71,250 | $54,125 |
| Total | $56,759 | $38,125 |
Family Income in Westby
Family Income Brackets in Westby
According to the Westby family income data, there are 122 families falling into the $75,000 to $99,999 income range, which is the most common income bracket and makes up 23.2% of all families.
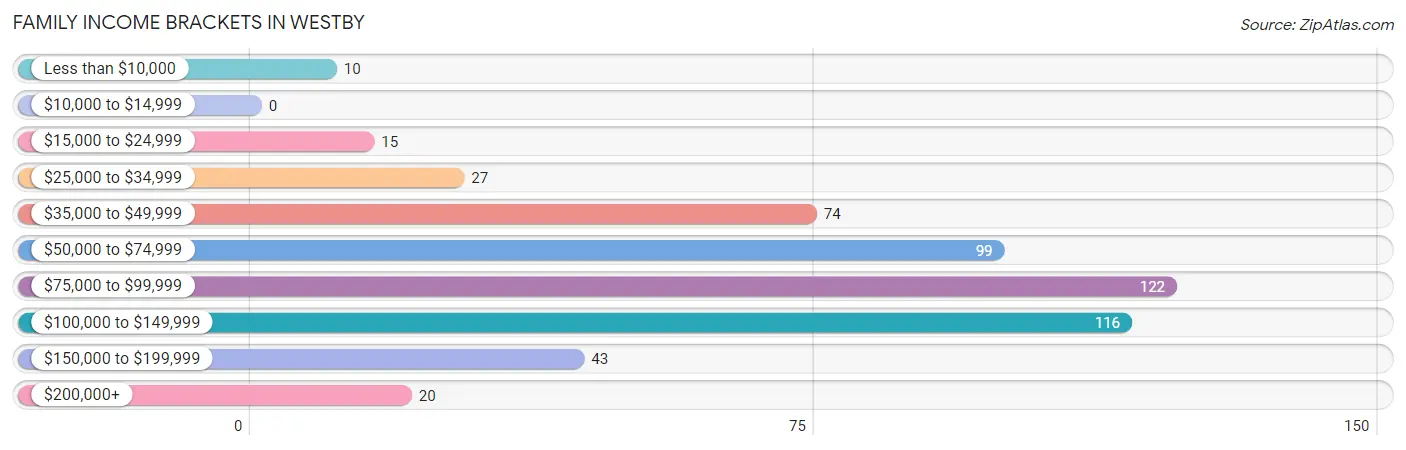
| Income Bracket | # Families | % Families |
| Less than $10,000 | 10 | 1.9% |
| $10,000 to $14,999 | 0 | 0.0% |
| $15,000 to $24,999 | 15 | 2.9% |
| $25,000 to $34,999 | 27 | 5.1% |
| $35,000 to $49,999 | 74 | 14.1% |
| $50,000 to $74,999 | 99 | 18.8% |
| $75,000 to $99,999 | 122 | 23.2% |
| $100,000 to $149,999 | 116 | 22.1% |
| $150,000 to $199,999 | 43 | 8.2% |
| $200,000+ | 20 | 3.8% |
Family Income by Famaliy Size in Westby
5-person families (81 | 15.4%) account for the highest median family income in Westby with $128,068 per family, while 2-person families (244 | 46.4%) have the highest median income of $33,250 per family member.
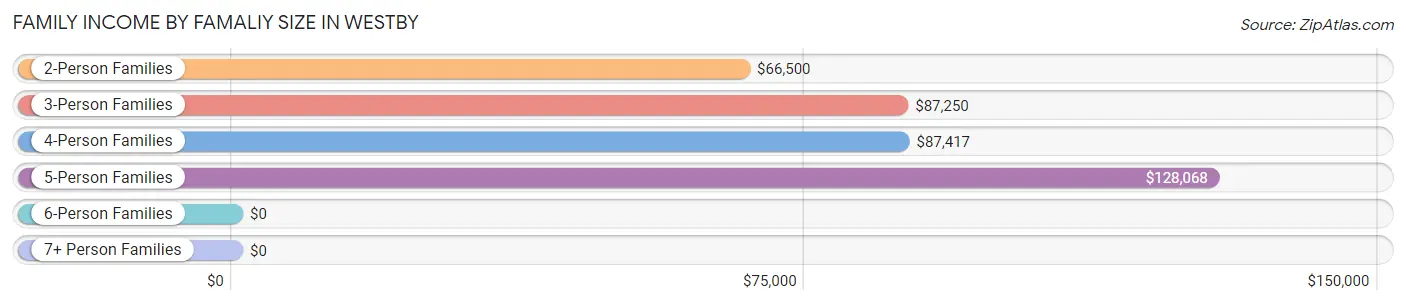
| Income Bracket | # Families | Median Income |
| 2-Person Families | 244 (46.4%) | $66,500 |
| 3-Person Families | 93 (17.7%) | $87,250 |
| 4-Person Families | 101 (19.2%) | $87,417 |
| 5-Person Families | 81 (15.4%) | $128,068 |
| 6-Person Families | 7 (1.3%) | $0 |
| 7+ Person Families | 0 (0.0%) | $0 |
| Total | 526 (100.0%) | $81,389 |
Family Income by Number of Earners in Westby
The median family income in Westby is $81,389, with families comprising 3+ earners (70) having the highest median family income of $140,833, while families with no earners (66) have the lowest median family income of $48,438, accounting for 13.3% and 12.6% of families, respectively.
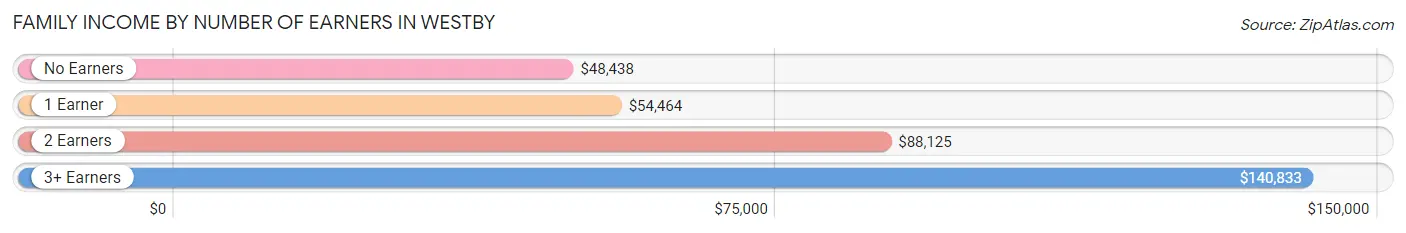
| Number of Earners | # Families | Median Income |
| No Earners | 66 (12.6%) | $48,438 |
| 1 Earner | 125 (23.8%) | $54,464 |
| 2 Earners | 265 (50.4%) | $88,125 |
| 3+ Earners | 70 (13.3%) | $140,833 |
| Total | 526 (100.0%) | $81,389 |
Household Income in Westby
Household Income Brackets in Westby
With 232 households falling in the category, the $50,000 to $74,999 income range is the most frequent in Westby, accounting for 23.8% of all households. In contrast, only 16 households (1.6%) fall into the less than $10,000 income bracket, making it the least populous group.
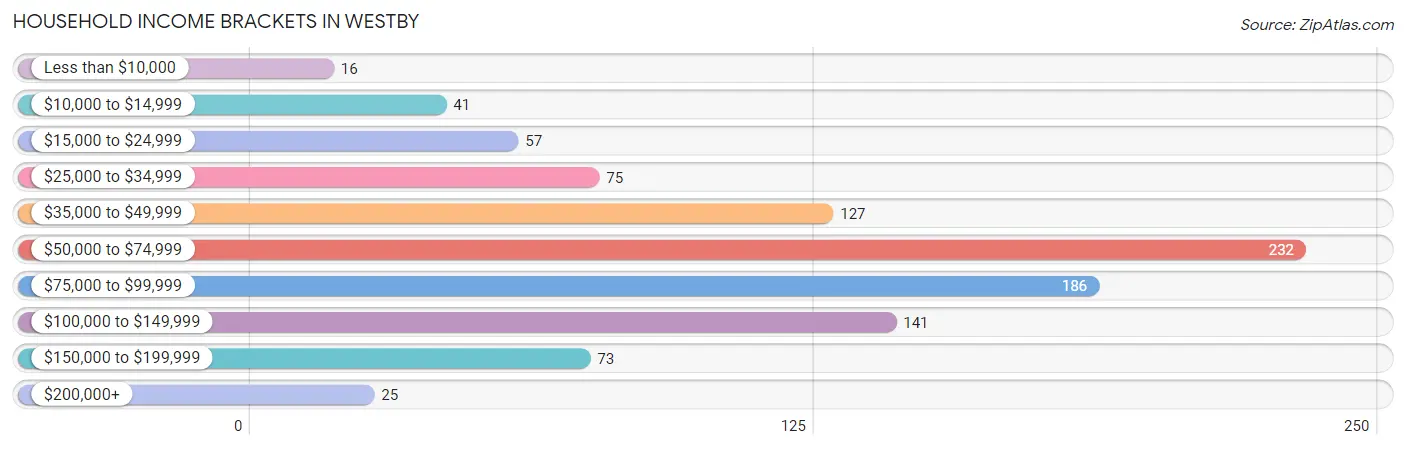
| Income Bracket | # Households | % Households |
| Less than $10,000 | 16 | 1.6% |
| $10,000 to $14,999 | 41 | 4.2% |
| $15,000 to $24,999 | 57 | 5.9% |
| $25,000 to $34,999 | 75 | 7.7% |
| $35,000 to $49,999 | 127 | 13.1% |
| $50,000 to $74,999 | 232 | 23.8% |
| $75,000 to $99,999 | 186 | 19.1% |
| $100,000 to $149,999 | 141 | 14.5% |
| $150,000 to $199,999 | 73 | 7.5% |
| $200,000+ | 25 | 2.6% |
Household Income by Householder Age in Westby
The median household income in Westby is $66,741, with the highest median household income of $85,682 found in the 25 to 44 years age bracket for the primary householder. A total of 292 households (30.0%) fall into this category. Meanwhile, the 65+ years age bracket for the primary householder has the lowest median household income of $50,750, with 332 households (34.1%) in this group.
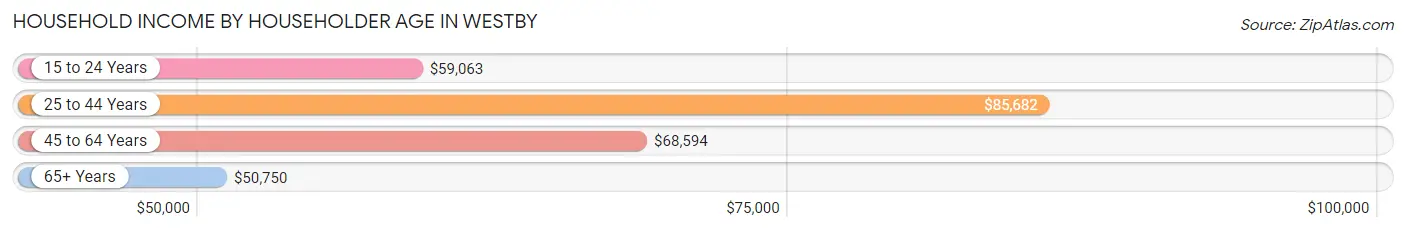
| Income Bracket | # Households | Median Income |
| 15 to 24 Years | 22 (2.3%) | $59,063 |
| 25 to 44 Years | 292 (30.0%) | $85,682 |
| 45 to 64 Years | 327 (33.6%) | $68,594 |
| 65+ Years | 332 (34.1%) | $50,750 |
| Total | 973 (100.0%) | $66,741 |
Poverty in Westby
Income Below Poverty by Sex and Age in Westby
With 3.7% poverty level for males and 10.7% for females among the residents of Westby, 5 year old males and 5 year old females are the most vulnerable to poverty, with 5 males (27.8%) and 12 females (50.0%) in their respective age groups living below the poverty level.
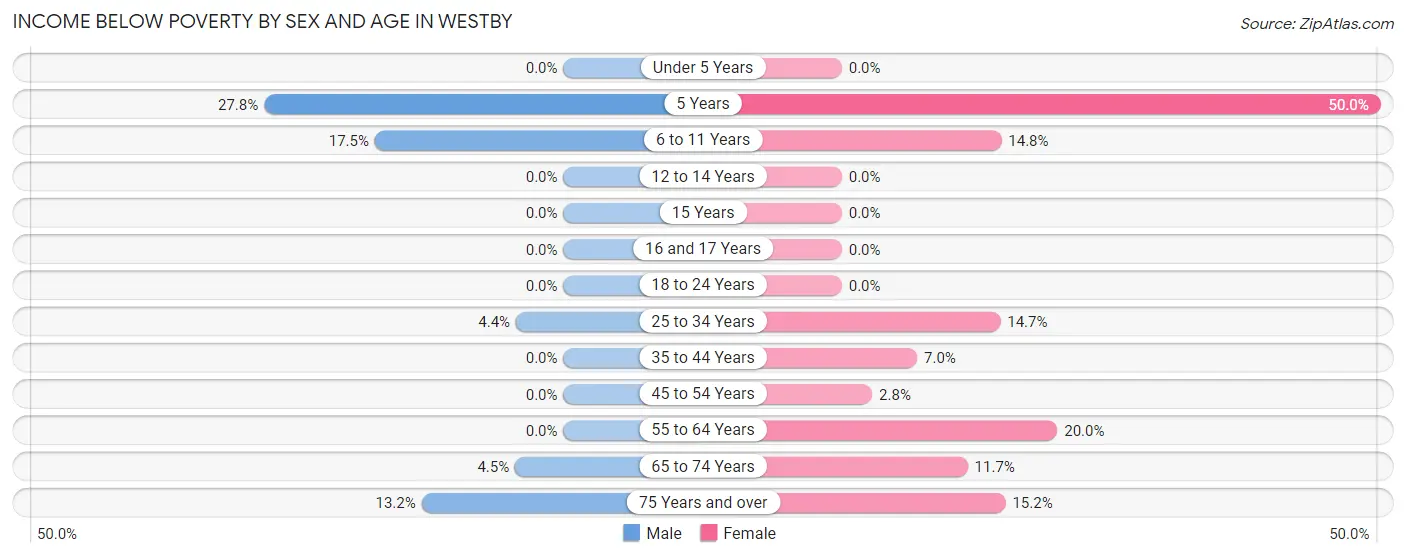
| Age Bracket | Male | Female |
| Under 5 Years | 0 (0.0%) | 0 (0.0%) |
| 5 Years | 5 (27.8%) | 12 (50.0%) |
| 6 to 11 Years | 14 (17.5%) | 12 (14.8%) |
| 12 to 14 Years | 0 (0.0%) | 0 (0.0%) |
| 15 Years | 0 (0.0%) | 0 (0.0%) |
| 16 and 17 Years | 0 (0.0%) | 0 (0.0%) |
| 18 to 24 Years | 0 (0.0%) | 0 (0.0%) |
| 25 to 34 Years | 7 (4.4%) | 20 (14.7%) |
| 35 to 44 Years | 0 (0.0%) | 10 (7.0%) |
| 45 to 54 Years | 0 (0.0%) | 4 (2.8%) |
| 55 to 64 Years | 0 (0.0%) | 28 (20.0%) |
| 65 to 74 Years | 6 (4.5%) | 16 (11.7%) |
| 75 Years and over | 10 (13.2%) | 24 (15.2%) |
| Total | 42 (3.7%) | 126 (10.7%) |
Income Above Poverty by Sex and Age in Westby
According to the poverty statistics in Westby, males aged under 5 years and females aged under 5 years are the age groups that are most secure financially, with 100.0% of males and 100.0% of females in these age groups living above the poverty line.
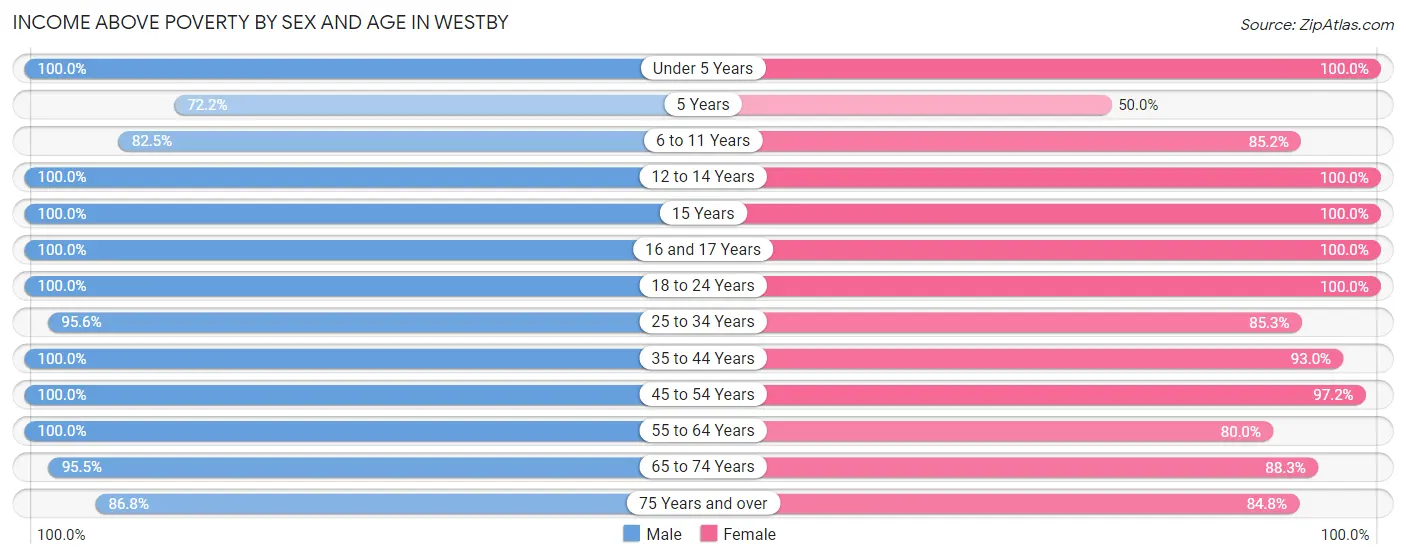
| Age Bracket | Male | Female |
| Under 5 Years | 87 (100.0%) | 55 (100.0%) |
| 5 Years | 13 (72.2%) | 12 (50.0%) |
| 6 to 11 Years | 66 (82.5%) | 69 (85.2%) |
| 12 to 14 Years | 103 (100.0%) | 46 (100.0%) |
| 15 Years | 10 (100.0%) | 9 (100.0%) |
| 16 and 17 Years | 19 (100.0%) | 40 (100.0%) |
| 18 to 24 Years | 83 (100.0%) | 63 (100.0%) |
| 25 to 34 Years | 152 (95.6%) | 116 (85.3%) |
| 35 to 44 Years | 107 (100.0%) | 133 (93.0%) |
| 45 to 54 Years | 125 (100.0%) | 138 (97.2%) |
| 55 to 64 Years | 143 (100.0%) | 112 (80.0%) |
| 65 to 74 Years | 128 (95.5%) | 121 (88.3%) |
| 75 Years and over | 66 (86.8%) | 134 (84.8%) |
| Total | 1,102 (96.3%) | 1,048 (89.3%) |
Income Below Poverty Among Married-Couple Families in Westby
The poverty statistics for married-couple families in Westby show that 2.5% or 11 of the total 445 families live below the poverty line. Families with no children have the highest poverty rate of 4.8%, comprising of 11 families. On the other hand, families with 1 or 2 children have the lowest poverty rate of 0.0%, which includes 0 families.
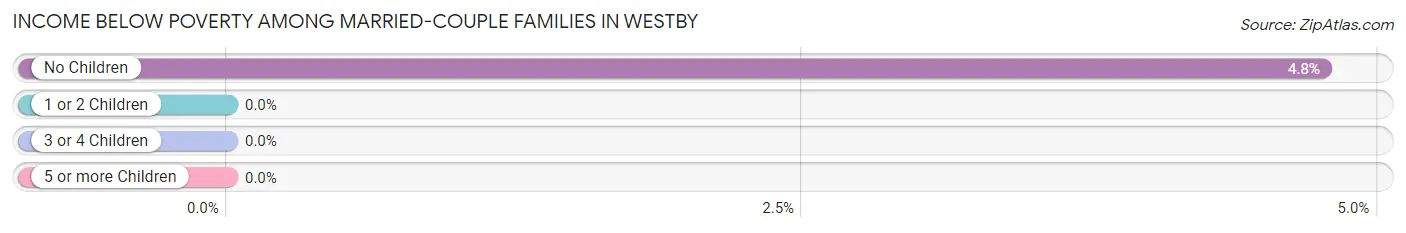
| Children | Above Poverty | Below Poverty |
| No Children | 220 (95.2%) | 11 (4.8%) |
| 1 or 2 Children | 145 (100.0%) | 0 (0.0%) |
| 3 or 4 Children | 69 (100.0%) | 0 (0.0%) |
| 5 or more Children | 0 (0.0%) | 0 (0.0%) |
| Total | 434 (97.5%) | 11 (2.5%) |
Income Below Poverty Among Single-Parent Households in Westby
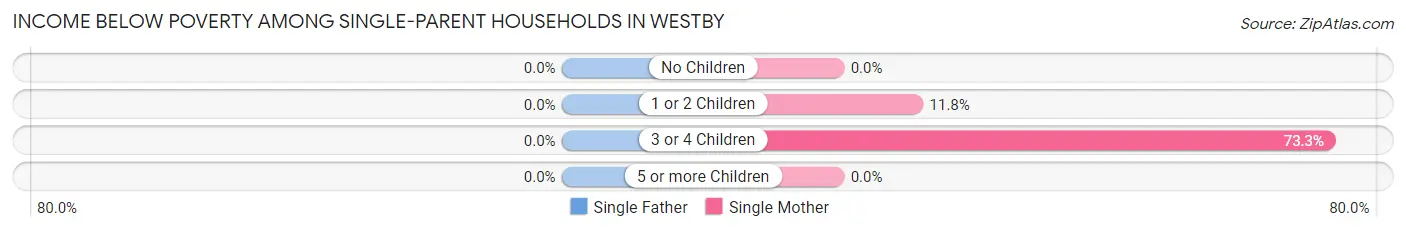
| Children | Single Father | Single Mother |
| No Children | 0 (0.0%) | 0 (0.0%) |
| 1 or 2 Children | 0 (0.0%) | 4 (11.8%) |
| 3 or 4 Children | 0 (0.0%) | 11 (73.3%) |
| 5 or more Children | 0 (0.0%) | 0 (0.0%) |
| Total | 0 (0.0%) | 15 (26.3%) |
Income Below Poverty Among Married-Couple vs Single-Parent Households in Westby
The poverty data for Westby shows that 11 of the married-couple family households (2.5%) and 15 of the single-parent households (18.5%) are living below the poverty level. Within the married-couple family households, those with no children have the highest poverty rate, with 11 households (4.8%) falling below the poverty line. Among the single-parent households, those with 3 or 4 children have the highest poverty rate, with 11 household (73.3%) living below poverty.
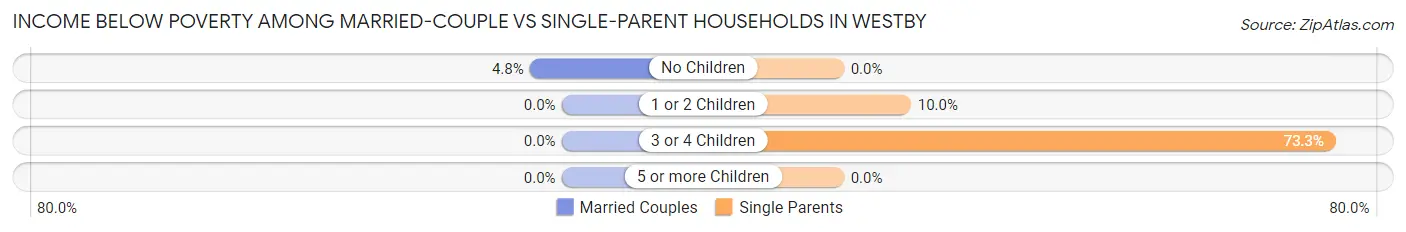
| Children | Married-Couple Families | Single-Parent Households |
| No Children | 11 (4.8%) | 0 (0.0%) |
| 1 or 2 Children | 0 (0.0%) | 4 (10.0%) |
| 3 or 4 Children | 0 (0.0%) | 11 (73.3%) |
| 5 or more Children | 0 (0.0%) | 0 (0.0%) |
| Total | 11 (2.5%) | 15 (18.5%) |
Race in Westby
The most populous races in Westby are White / Caucasian (2,275 | 98.1%), Hispanic or Latino (42 | 1.8%), and Two or more Races (36 | 1.5%).
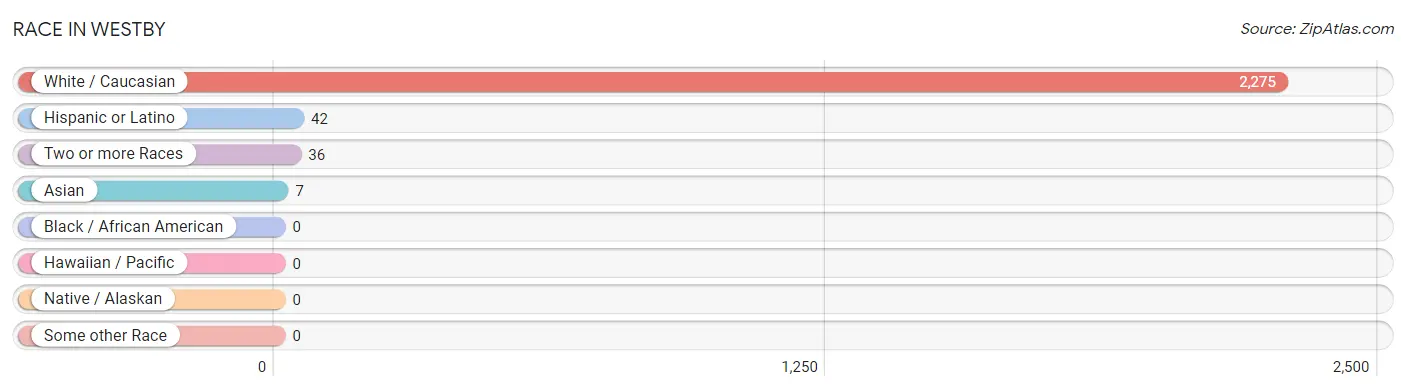
| Race | # Population | % Population |
| Asian | 7 | 0.3% |
| Black / African American | 0 | 0.0% |
| Hawaiian / Pacific | 0 | 0.0% |
| Hispanic or Latino | 42 | 1.8% |
| Native / Alaskan | 0 | 0.0% |
| White / Caucasian | 2,275 | 98.1% |
| Two or more Races | 36 | 1.5% |
| Some other Race | 0 | 0.0% |
| Total | 2,318 | 100.0% |
Ancestry in Westby
The most populous ancestries reported in Westby are Norwegian (1,174 | 50.6%), German (826 | 35.6%), Irish (223 | 9.6%), English (142 | 6.1%), and Swedish (74 | 3.2%), together accounting for 105.2% of all Westby residents.
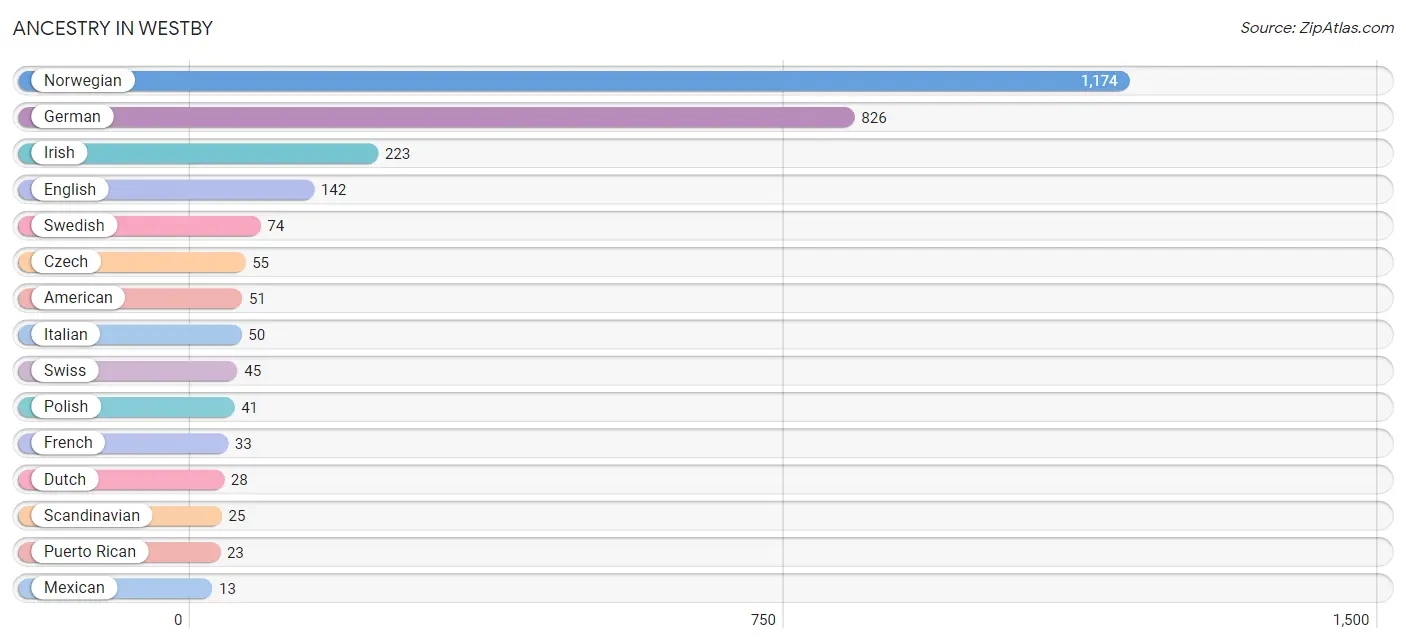
| Ancestry | # Population | % Population |
| American | 51 | 2.2% |
| Cherokee | 3 | 0.1% |
| Czech | 55 | 2.4% |
| Czechoslovakian | 12 | 0.5% |
| Dutch | 28 | 1.2% |
| English | 142 | 6.1% |
| European | 11 | 0.5% |
| French | 33 | 1.4% |
| German | 826 | 35.6% |
| Irish | 223 | 9.6% |
| Italian | 50 | 2.2% |
| Japanese | 7 | 0.3% |
| Mexican | 13 | 0.6% |
| Norwegian | 1,174 | 50.6% |
| Polish | 41 | 1.8% |
| Puerto Rican | 23 | 1.0% |
| Russian | 4 | 0.2% |
| Scandinavian | 25 | 1.1% |
| Scottish | 11 | 0.5% |
| Slavic | 1 | 0.0% |
| South American | 6 | 0.3% |
| Swedish | 74 | 3.2% |
| Swiss | 45 | 1.9% |
| Venezuelan | 6 | 0.3% |
| Welsh | 3 | 0.1% | View All 25 Rows |
Immigrants in Westby
The most numerous immigrant groups reported in Westby came from Latin America (19 | 0.8%), Central America (13 | 0.6%), Mexico (13 | 0.6%), Asia (7 | 0.3%), and Cambodia (7 | 0.3%), together accounting for 2.5% of all Westby residents.
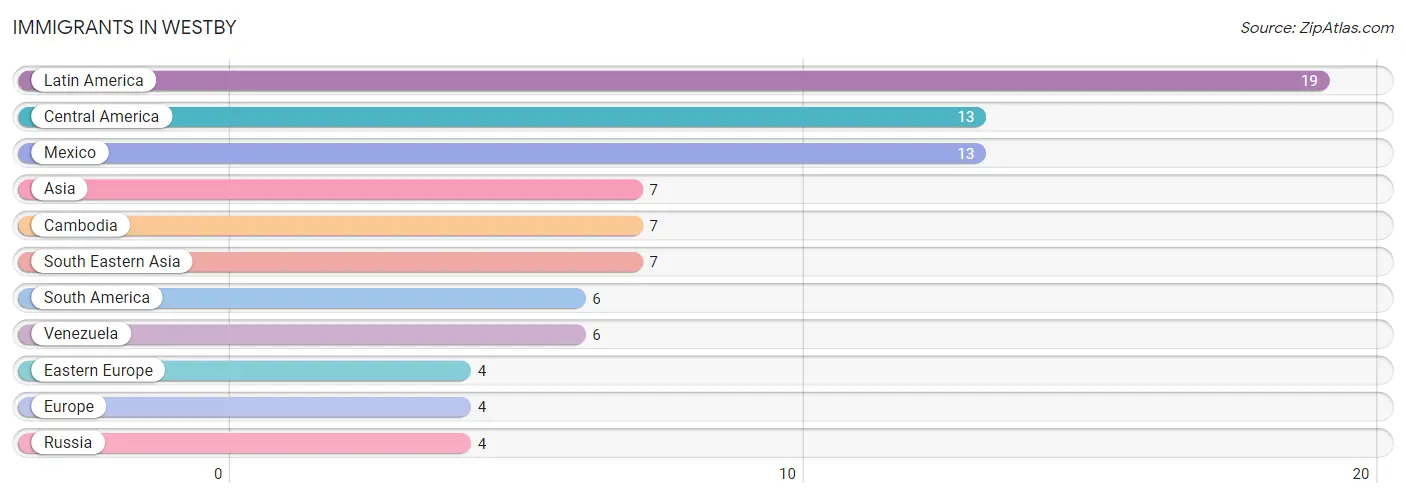
| Immigration Origin | # Population | % Population |
| Asia | 7 | 0.3% |
| Cambodia | 7 | 0.3% |
| Central America | 13 | 0.6% |
| Eastern Europe | 4 | 0.2% |
| Europe | 4 | 0.2% |
| Latin America | 19 | 0.8% |
| Mexico | 13 | 0.6% |
| Russia | 4 | 0.2% |
| South America | 6 | 0.3% |
| South Eastern Asia | 7 | 0.3% |
| Venezuela | 6 | 0.3% | View All 11 Rows |
Sex and Age in Westby
Sex and Age in Westby
The most populous age groups in Westby are 10 to 14 Years (123 | 10.7%) for men and 65 to 69 Years (96 | 8.2%) for women.
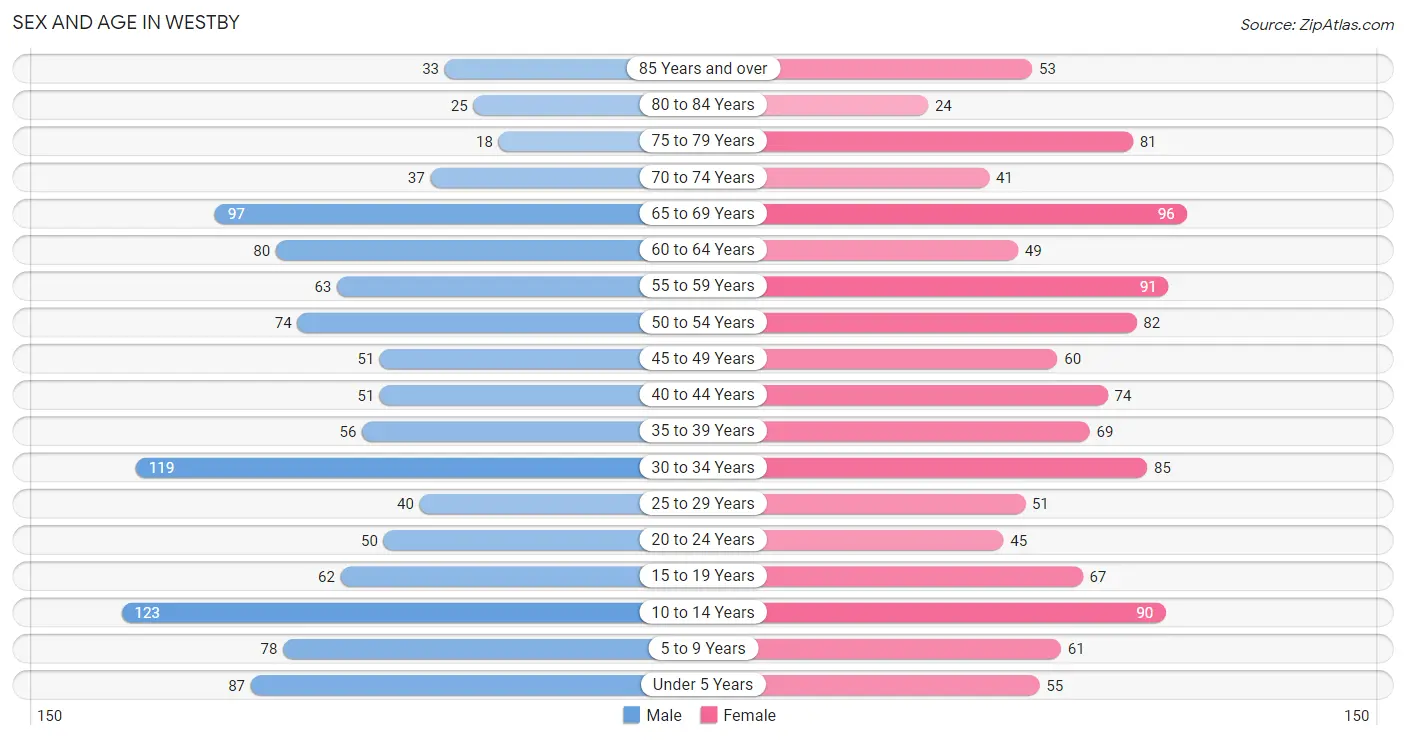
| Age Bracket | Male | Female |
| Under 5 Years | 87 (7.6%) | 55 (4.7%) |
| 5 to 9 Years | 78 (6.8%) | 61 (5.2%) |
| 10 to 14 Years | 123 (10.7%) | 90 (7.7%) |
| 15 to 19 Years | 62 (5.4%) | 67 (5.7%) |
| 20 to 24 Years | 50 (4.4%) | 45 (3.8%) |
| 25 to 29 Years | 40 (3.5%) | 51 (4.3%) |
| 30 to 34 Years | 119 (10.4%) | 85 (7.2%) |
| 35 to 39 Years | 56 (4.9%) | 69 (5.9%) |
| 40 to 44 Years | 51 (4.5%) | 74 (6.3%) |
| 45 to 49 Years | 51 (4.5%) | 60 (5.1%) |
| 50 to 54 Years | 74 (6.5%) | 82 (7.0%) |
| 55 to 59 Years | 63 (5.5%) | 91 (7.7%) |
| 60 to 64 Years | 80 (7.0%) | 49 (4.2%) |
| 65 to 69 Years | 97 (8.5%) | 96 (8.2%) |
| 70 to 74 Years | 37 (3.2%) | 41 (3.5%) |
| 75 to 79 Years | 18 (1.6%) | 81 (6.9%) |
| 80 to 84 Years | 25 (2.2%) | 24 (2.0%) |
| 85 Years and over | 33 (2.9%) | 53 (4.5%) |
| Total | 1,144 (100.0%) | 1,174 (100.0%) |
Families and Households in Westby
Median Family Size in Westby
The median family size in Westby is 3.34 persons per family, with married-couple families (445 | 84.6%) accounting for the largest median family size of 3.38 persons per family. On the other hand, single male/father families (24 | 4.6%) represent the smallest median family size with 2.54 persons per family.
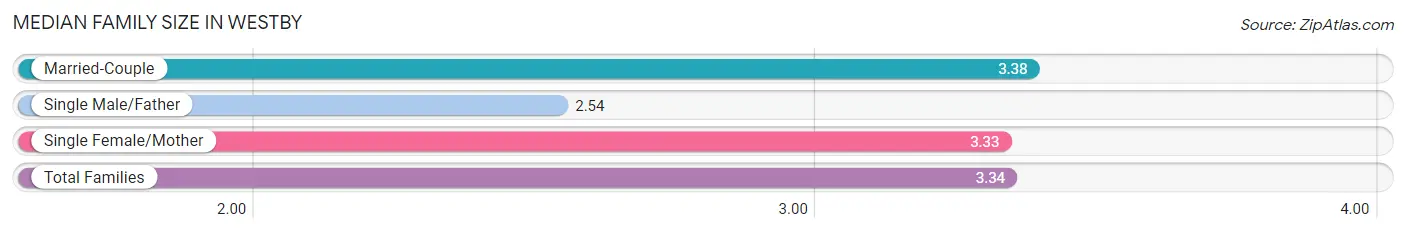
| Family Type | # Families | Family Size |
| Married-Couple | 445 (84.6%) | 3.38 |
| Single Male/Father | 24 (4.6%) | 2.54 |
| Single Female/Mother | 57 (10.8%) | 3.33 |
| Total Families | 526 (100.0%) | 3.34 |
Median Household Size in Westby
The median household size in Westby is 2.36 persons per household, with single female/mother households (57 | 5.9%) accounting for the largest median household size of 3.39 persons per household. non-family households (447 | 45.9%) represent the smallest median household size with 1.18 persons per household.
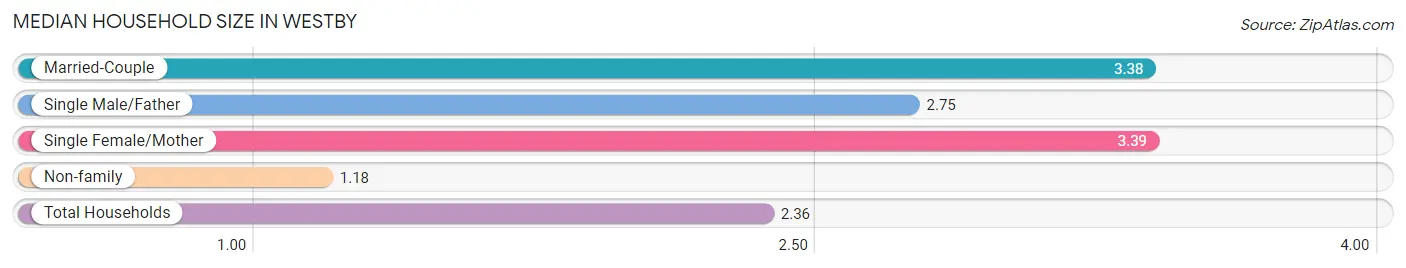
| Household Type | # Households | Household Size |
| Married-Couple | 445 (45.7%) | 3.38 |
| Single Male/Father | 24 (2.5%) | 2.75 |
| Single Female/Mother | 57 (5.9%) | 3.39 |
| Non-family | 447 (45.9%) | 1.18 |
| Total Households | 973 (100.0%) | 2.36 |
Household Size by Marriage Status in Westby
Out of a total of 973 households in Westby, 526 (54.1%) are family households, while 447 (45.9%) are nonfamily households. The most numerous type of family households are 2-person households, comprising 244, and the most common type of nonfamily households are 1-person households, comprising 377.
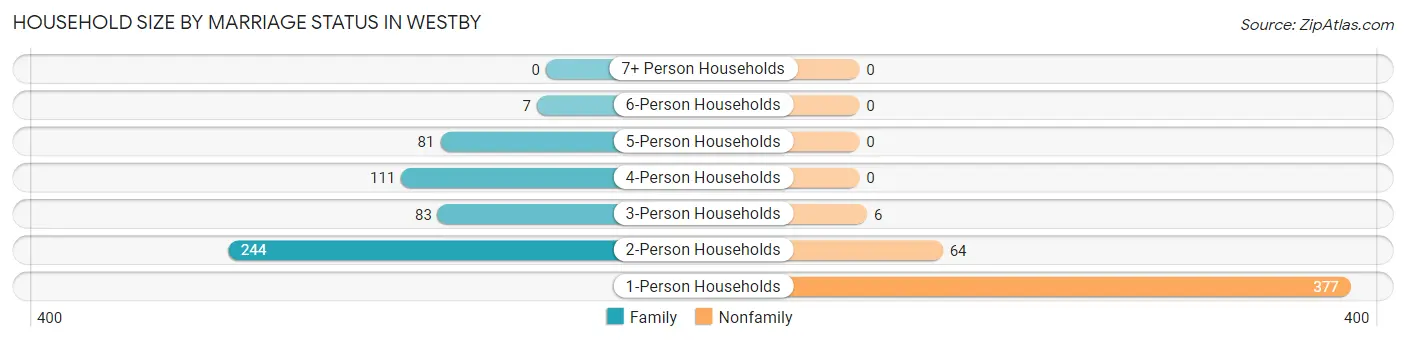
| Household Size | Family Households | Nonfamily Households |
| 1-Person Households | - | 377 (38.8%) |
| 2-Person Households | 244 (25.1%) | 64 (6.6%) |
| 3-Person Households | 83 (8.5%) | 6 (0.6%) |
| 4-Person Households | 111 (11.4%) | 0 (0.0%) |
| 5-Person Households | 81 (8.3%) | 0 (0.0%) |
| 6-Person Households | 7 (0.7%) | 0 (0.0%) |
| 7+ Person Households | 0 (0.0%) | 0 (0.0%) |
| Total | 526 (54.1%) | 447 (45.9%) |
Female Fertility in Westby
Fertility by Age in Westby
Average fertility rate in Westby is 57.0 births per 1,000 women. Women in the age bracket of 35 to 50 years have the highest fertility rate with 75.0 births per 1,000 women. Women in the age bracket of 35 to 50 years acount for 63.0% of all women with births.
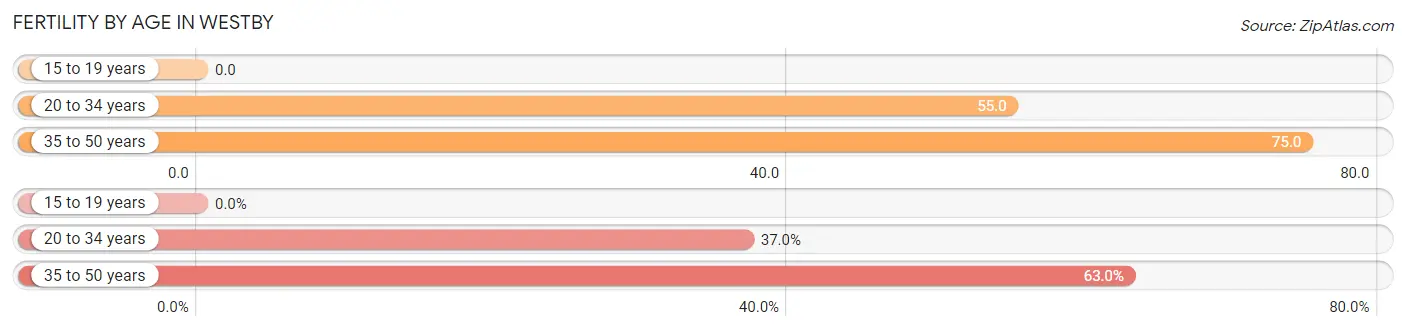
| Age Bracket | Women with Births | Births / 1,000 Women |
| 15 to 19 years | 0 (0.0%) | 0.0 |
| 20 to 34 years | 10 (37.0%) | 55.0 |
| 35 to 50 years | 17 (63.0%) | 75.0 |
| Total | 27 (100.0%) | 57.0 |
Fertility by Age by Marriage Status in Westby
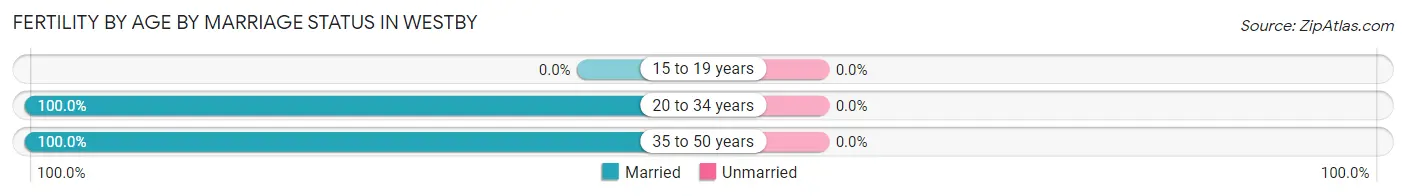
| Age Bracket | Married | Unmarried |
| 15 to 19 years | 0 (0.0%) | 0 (0.0%) |
| 20 to 34 years | 10 (100.0%) | 0 (0.0%) |
| 35 to 50 years | 17 (100.0%) | 0 (0.0%) |
| Total | 27 (100.0%) | 0 (0.0%) |
Fertility by Education in Westby
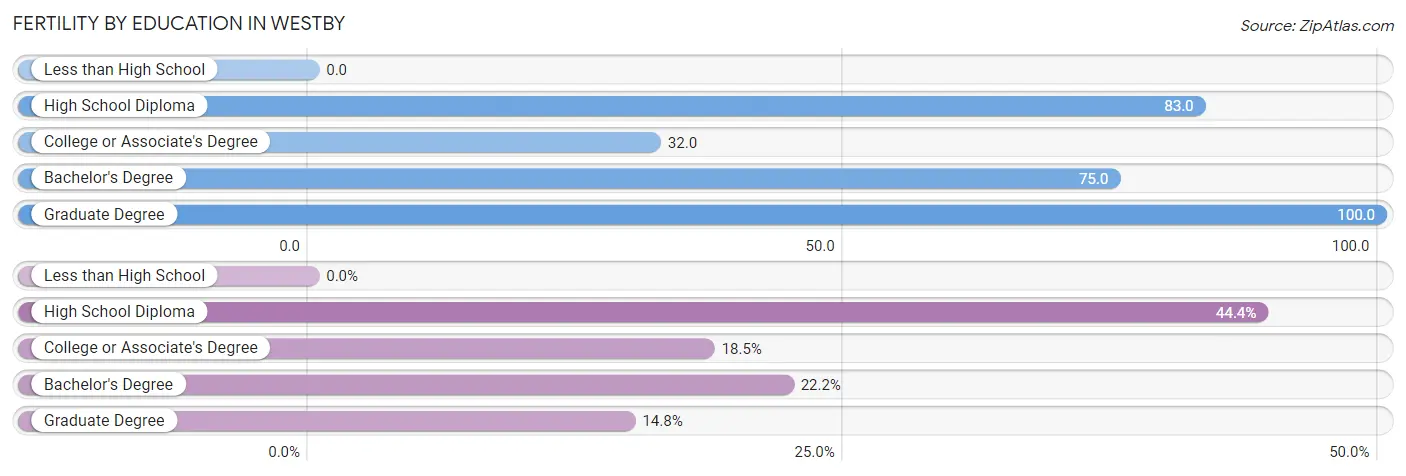
| Educational Attainment | Women with Births | Births / 1,000 Women |
| Less than High School | 0 (0.0%) | 0.0 |
| High School Diploma | 12 (44.4%) | 83.0 |
| College or Associate's Degree | 5 (18.5%) | 32.0 |
| Bachelor's Degree | 6 (22.2%) | 75.0 |
| Graduate Degree | 4 (14.8%) | 100.0 |
| Total | 27 (100.0%) | 57.0 |
Fertility by Education by Marriage Status in Westby
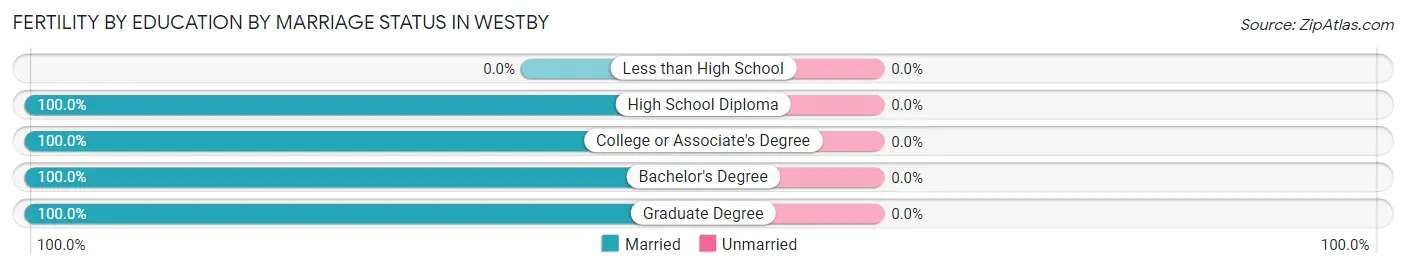
| Educational Attainment | Married | Unmarried |
| Less than High School | 0 (0.0%) | 0 (0.0%) |
| High School Diploma | 12 (100.0%) | 0 (0.0%) |
| College or Associate's Degree | 5 (100.0%) | 0 (0.0%) |
| Bachelor's Degree | 6 (100.0%) | 0 (0.0%) |
| Graduate Degree | 4 (100.0%) | 0 (0.0%) |
| Total | 27 (100.0%) | 0 (0.0%) |
Employment Characteristics in Westby
Employment by Class of Employer in Westby
Among the 1,165 employed individuals in Westby, private company employees (807 | 69.3%), local government employees (123 | 10.6%), and not-for-profit organizations (83 | 7.1%) make up the most common classes of employment.
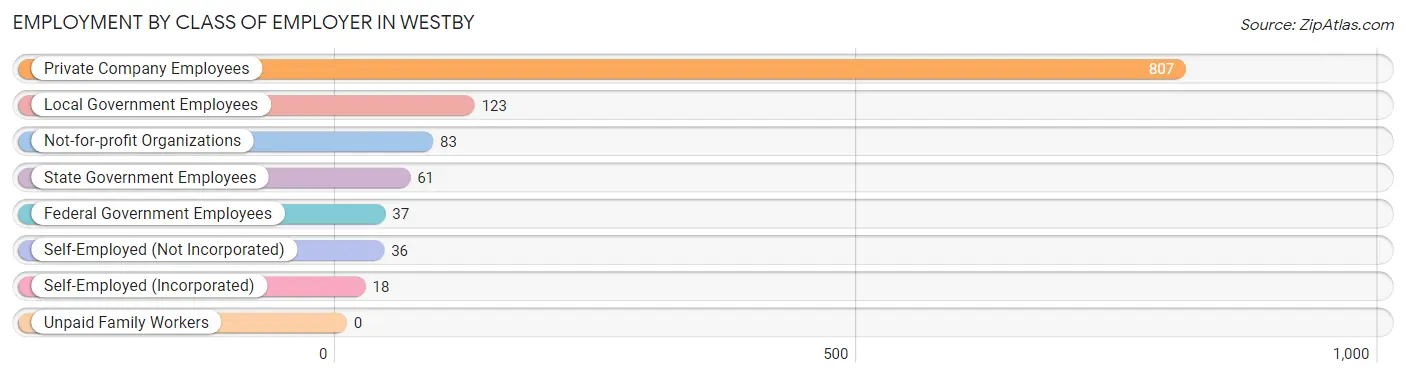
| Employer Class | # Employees | % Employees |
| Private Company Employees | 807 | 69.3% |
| Self-Employed (Incorporated) | 18 | 1.5% |
| Self-Employed (Not Incorporated) | 36 | 3.1% |
| Not-for-profit Organizations | 83 | 7.1% |
| Local Government Employees | 123 | 10.6% |
| State Government Employees | 61 | 5.2% |
| Federal Government Employees | 37 | 3.2% |
| Unpaid Family Workers | 0 | 0.0% |
| Total | 1,165 | 100.0% |
Employment Status by Age in Westby
According to the labor force statistics for Westby, out of the total population over 16 years of age (1,805), 67.5% or 1,218 individuals are in the labor force, with 2.5% or 30 of them unemployed. The age group with the highest labor force participation rate is 30 to 34 years, with 98.5% or 201 individuals in the labor force. Within the labor force, the 16 to 19 years age range has the highest percentage of unemployed individuals, with 43.7% or 31 of them being unemployed.
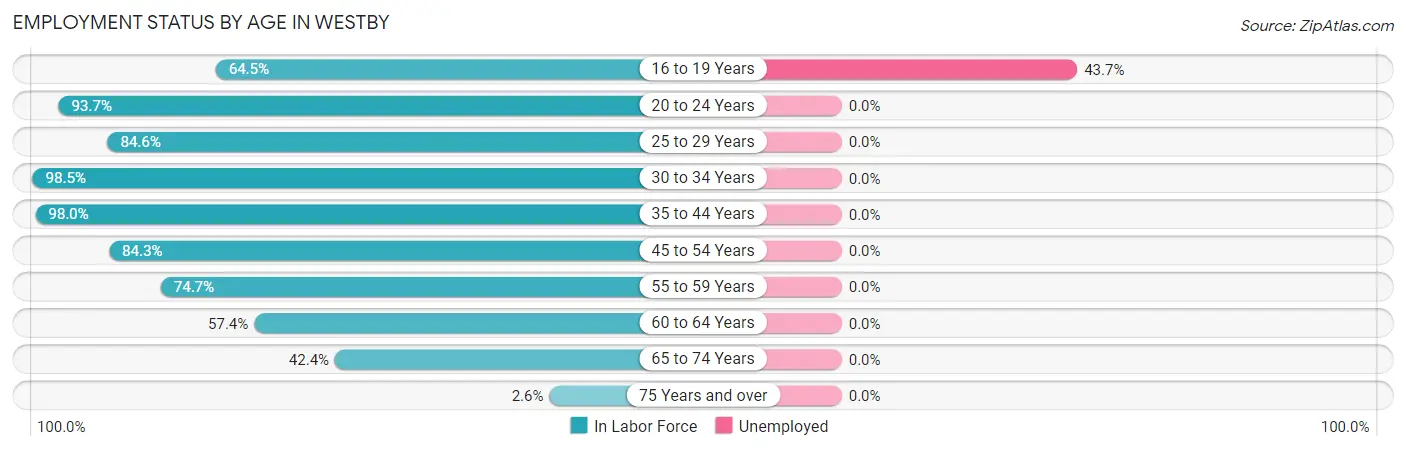
| Age Bracket | In Labor Force | Unemployed |
| 16 to 19 Years | 71 (64.5%) | 31 (43.7%) |
| 20 to 24 Years | 89 (93.7%) | 0 (0.0%) |
| 25 to 29 Years | 77 (84.6%) | 0 (0.0%) |
| 30 to 34 Years | 201 (98.5%) | 0 (0.0%) |
| 35 to 44 Years | 245 (98.0%) | 0 (0.0%) |
| 45 to 54 Years | 225 (84.3%) | 0 (0.0%) |
| 55 to 59 Years | 115 (74.7%) | 0 (0.0%) |
| 60 to 64 Years | 74 (57.4%) | 0 (0.0%) |
| 65 to 74 Years | 115 (42.4%) | 0 (0.0%) |
| 75 Years and over | 6 (2.6%) | 0 (0.0%) |
| Total | 1,218 (67.5%) | 30 (2.5%) |
Employment Status by Educational Attainment in Westby
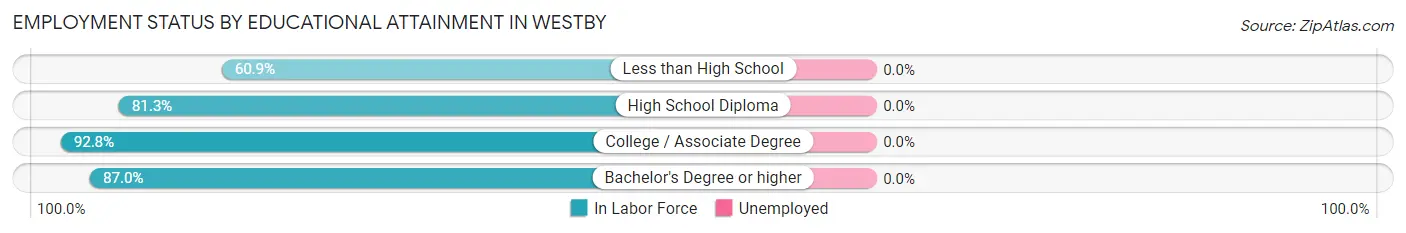
| Educational Attainment | In Labor Force | Unemployed |
| Less than High School | 39 (60.9%) | 0 (0.0%) |
| High School Diploma | 283 (81.3%) | 0 (0.0%) |
| College / Associate Degree | 335 (92.8%) | 0 (0.0%) |
| Bachelor's Degree or higher | 280 (87.0%) | 0 (0.0%) |
| Total | 937 (85.6%) | 0 (0.0%) |
Employment Occupations by Sex in Westby
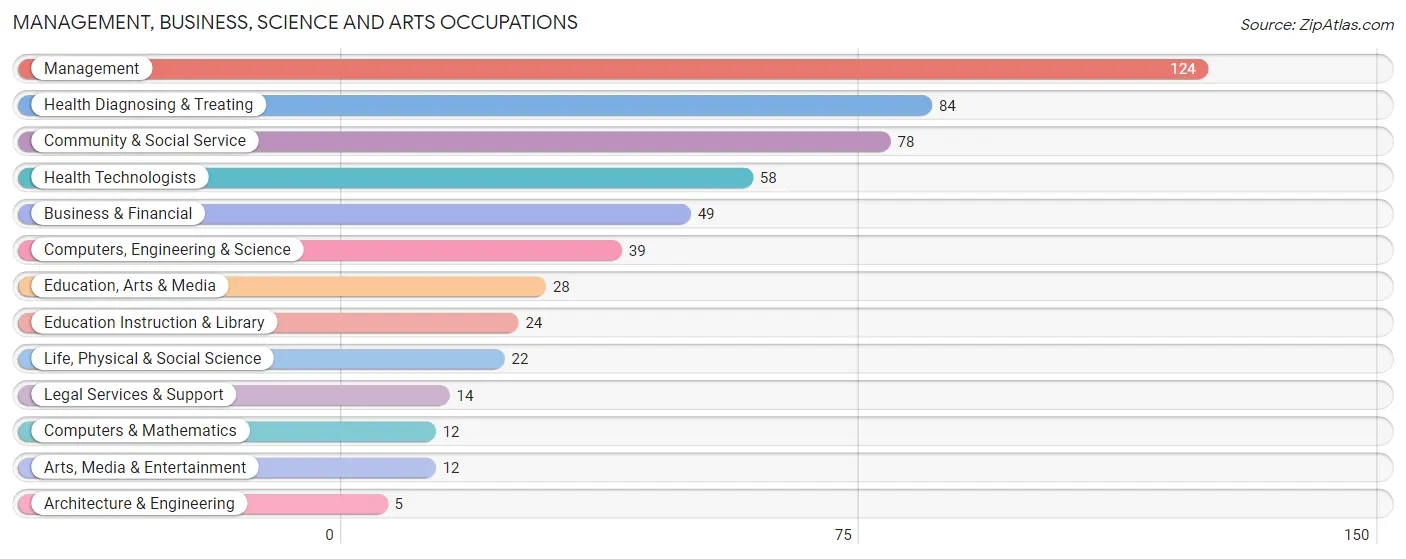
Management, Business, Science and Arts Occupations
The most common Management, Business, Science and Arts occupations in Westby are Management (124 | 10.4%), Health Diagnosing & Treating (84 | 7.1%), Community & Social Service (78 | 6.6%), Health Technologists (58 | 4.9%), and Business & Financial (49 | 4.1%).
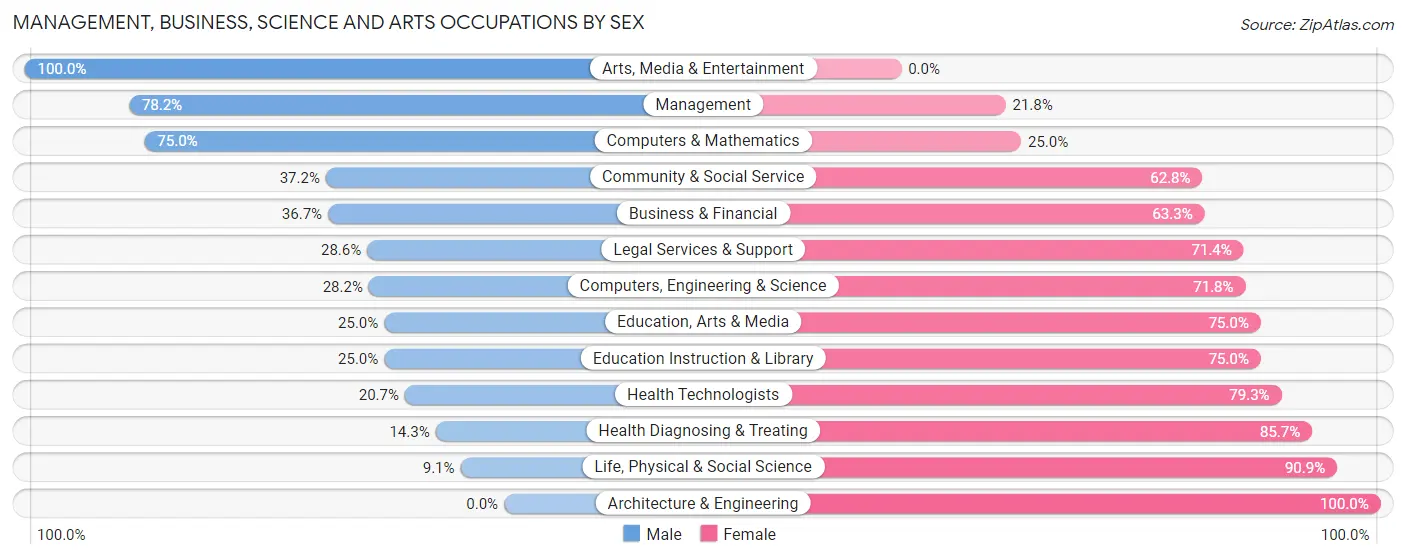
Management, Business, Science and Arts Occupations by Sex
Within the Management, Business, Science and Arts occupations in Westby, the most male-oriented occupations are Arts, Media & Entertainment (100.0%), Management (78.2%), and Computers & Mathematics (75.0%), while the most female-oriented occupations are Architecture & Engineering (100.0%), Life, Physical & Social Science (90.9%), and Health Diagnosing & Treating (85.7%).
| Occupation | Male | Female |
| Management | 97 (78.2%) | 27 (21.8%) |
| Business & Financial | 18 (36.7%) | 31 (63.3%) |
| Computers, Engineering & Science | 11 (28.2%) | 28 (71.8%) |
| Computers & Mathematics | 9 (75.0%) | 3 (25.0%) |
| Architecture & Engineering | 0 (0.0%) | 5 (100.0%) |
| Life, Physical & Social Science | 2 (9.1%) | 20 (90.9%) |
| Community & Social Service | 29 (37.2%) | 49 (62.8%) |
| Education, Arts & Media | 7 (25.0%) | 21 (75.0%) |
| Legal Services & Support | 4 (28.6%) | 10 (71.4%) |
| Education Instruction & Library | 6 (25.0%) | 18 (75.0%) |
| Arts, Media & Entertainment | 12 (100.0%) | 0 (0.0%) |
| Health Diagnosing & Treating | 12 (14.3%) | 72 (85.7%) |
| Health Technologists | 12 (20.7%) | 46 (79.3%) |
| Total (Category) | 167 (44.7%) | 207 (55.3%) |
| Total (Overall) | 649 (54.7%) | 538 (45.3%) |
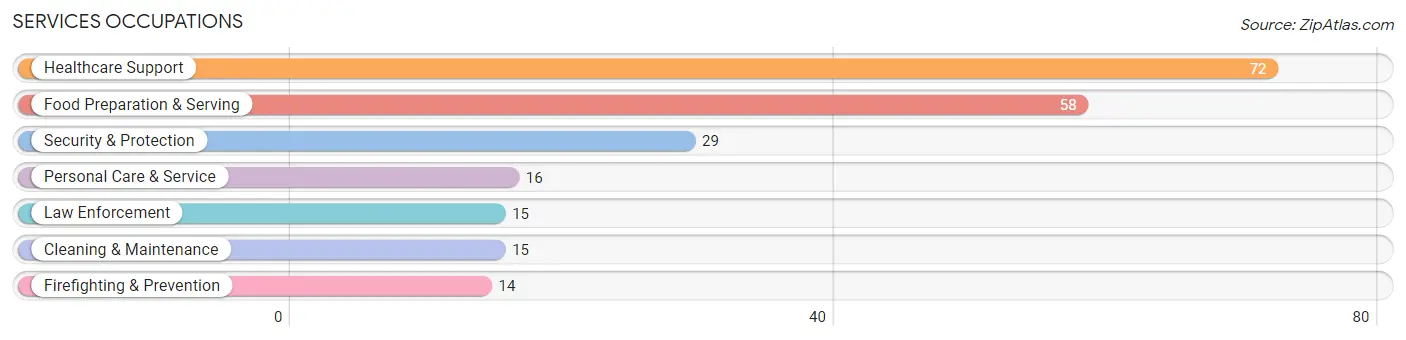
Services Occupations
The most common Services occupations in Westby are Healthcare Support (72 | 6.1%), Food Preparation & Serving (58 | 4.9%), Security & Protection (29 | 2.4%), Personal Care & Service (16 | 1.3%), and Law Enforcement (15 | 1.3%).
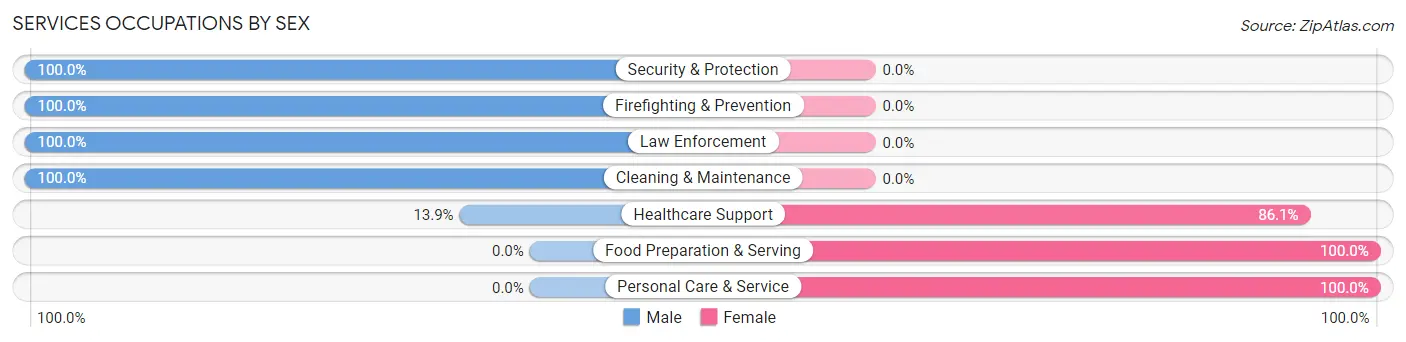
Services Occupations by Sex
Within the Services occupations in Westby, the most male-oriented occupations are Security & Protection (100.0%), Firefighting & Prevention (100.0%), and Law Enforcement (100.0%), while the most female-oriented occupations are Food Preparation & Serving (100.0%), Personal Care & Service (100.0%), and Healthcare Support (86.1%).
| Occupation | Male | Female |
| Healthcare Support | 10 (13.9%) | 62 (86.1%) |
| Security & Protection | 29 (100.0%) | 0 (0.0%) |
| Firefighting & Prevention | 14 (100.0%) | 0 (0.0%) |
| Law Enforcement | 15 (100.0%) | 0 (0.0%) |
| Food Preparation & Serving | 0 (0.0%) | 58 (100.0%) |
| Cleaning & Maintenance | 15 (100.0%) | 0 (0.0%) |
| Personal Care & Service | 0 (0.0%) | 16 (100.0%) |
| Total (Category) | 54 (28.4%) | 136 (71.6%) |
| Total (Overall) | 649 (54.7%) | 538 (45.3%) |
Sales and Office Occupations
The most common Sales and Office occupations in Westby are Sales & Related (108 | 9.1%), and Office & Administration (106 | 8.9%).
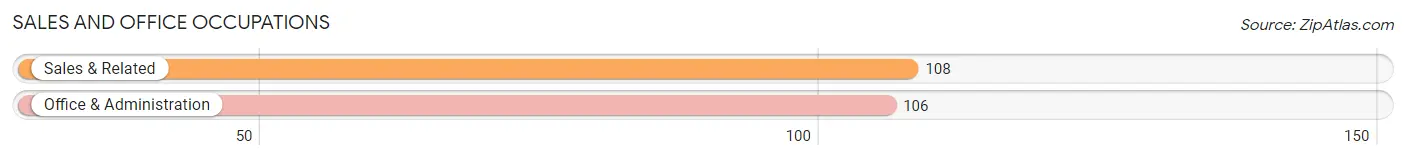
Sales and Office Occupations by Sex
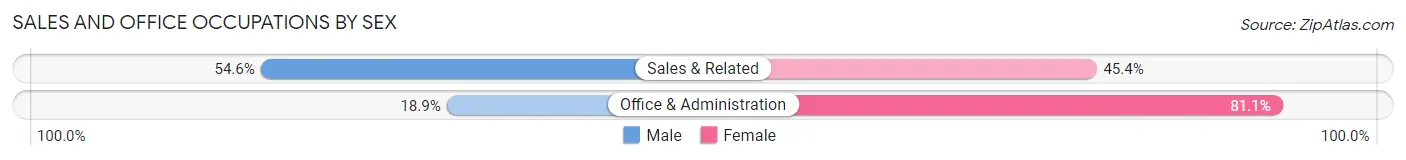
| Occupation | Male | Female |
| Sales & Related | 59 (54.6%) | 49 (45.4%) |
| Office & Administration | 20 (18.9%) | 86 (81.1%) |
| Total (Category) | 79 (36.9%) | 135 (63.1%) |
| Total (Overall) | 649 (54.7%) | 538 (45.3%) |
Natural Resources, Construction and Maintenance Occupations
The most common Natural Resources, Construction and Maintenance occupations in Westby are Construction & Extraction (125 | 10.5%), Installation, Maintenance & Repair (48 | 4.0%), and Farming, Fishing & Forestry (8 | 0.7%).
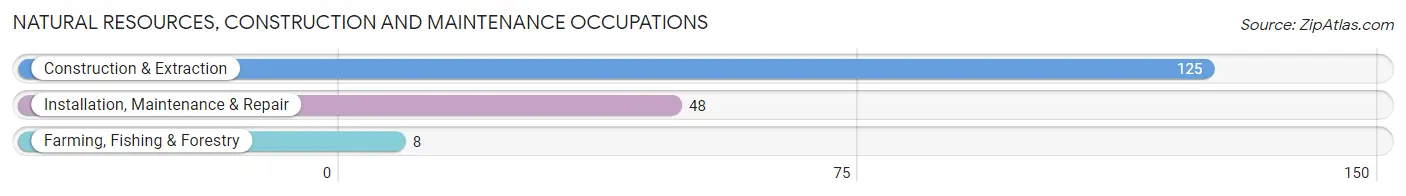
Natural Resources, Construction and Maintenance Occupations by Sex
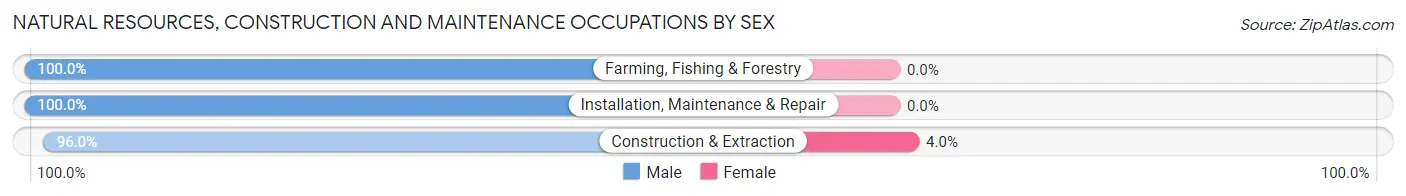
| Occupation | Male | Female |
| Farming, Fishing & Forestry | 8 (100.0%) | 0 (0.0%) |
| Construction & Extraction | 120 (96.0%) | 5 (4.0%) |
| Installation, Maintenance & Repair | 48 (100.0%) | 0 (0.0%) |
| Total (Category) | 176 (97.2%) | 5 (2.8%) |
| Total (Overall) | 649 (54.7%) | 538 (45.3%) |
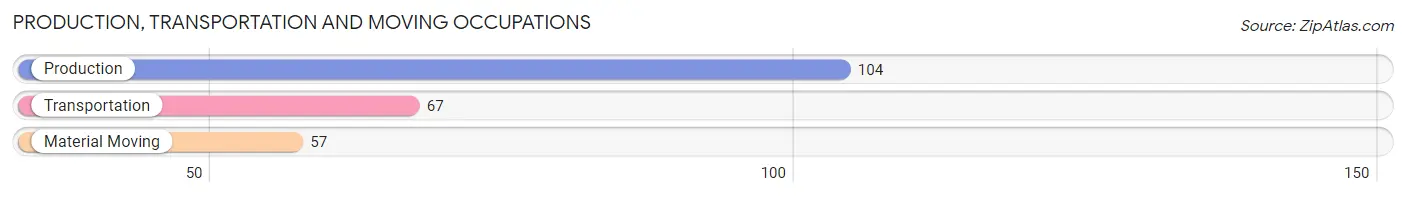
Production, Transportation and Moving Occupations
The most common Production, Transportation and Moving occupations in Westby are Production (104 | 8.8%), Transportation (67 | 5.6%), and Material Moving (57 | 4.8%).
Production, Transportation and Moving Occupations by Sex
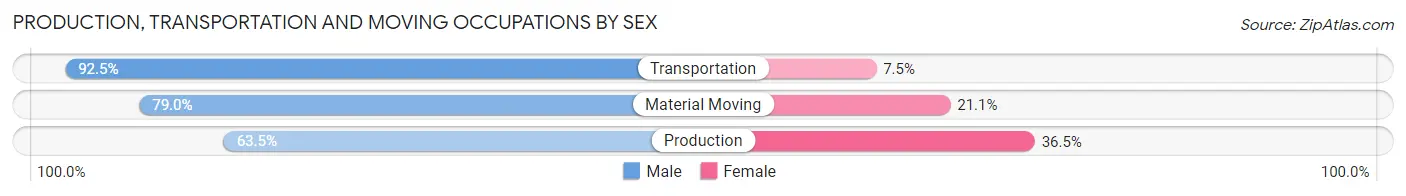
| Occupation | Male | Female |
| Production | 66 (63.5%) | 38 (36.5%) |
| Transportation | 62 (92.5%) | 5 (7.5%) |
| Material Moving | 45 (78.9%) | 12 (21.0%) |
| Total (Category) | 173 (75.9%) | 55 (24.1%) |
| Total (Overall) | 649 (54.7%) | 538 (45.3%) |
Employment Industries by Sex in Westby
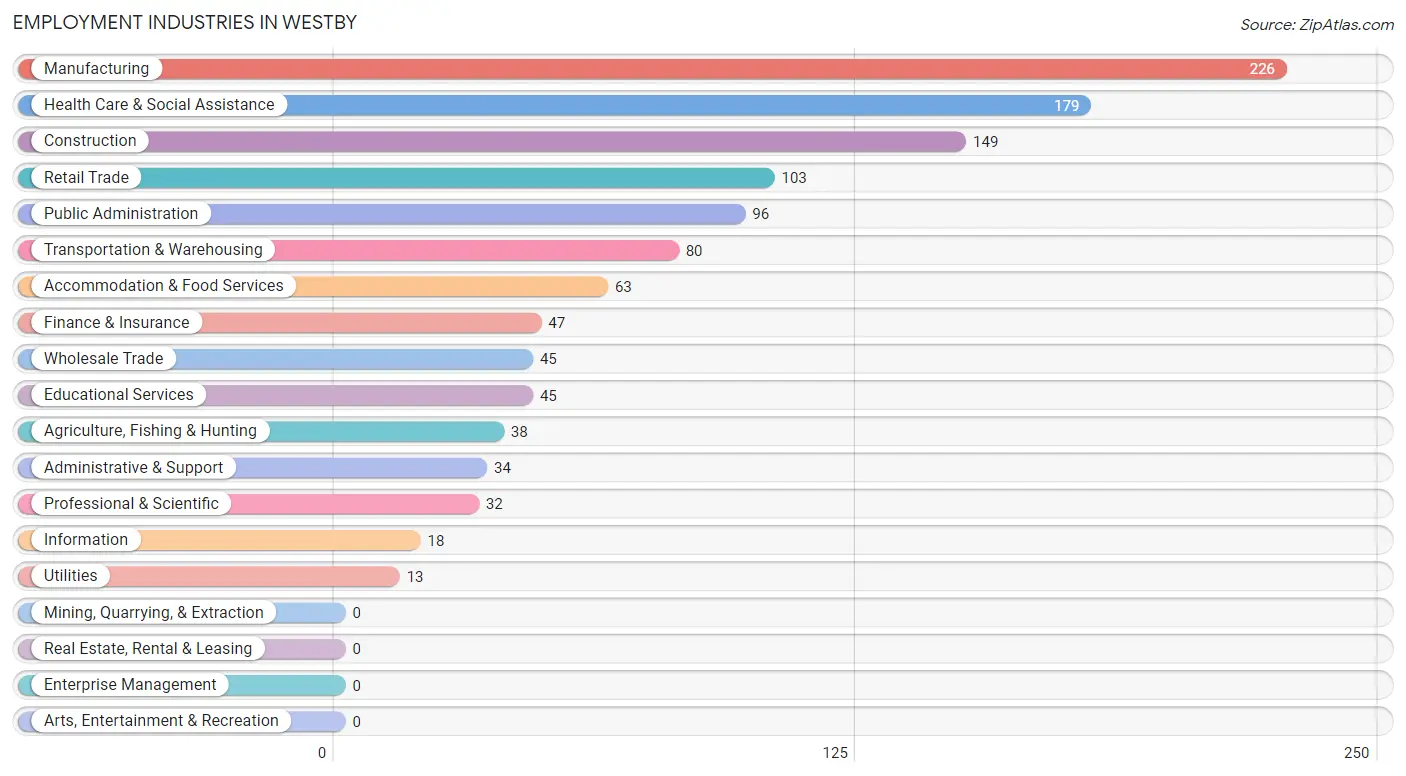
Employment Industries in Westby
The major employment industries in Westby include Manufacturing (226 | 19.0%), Health Care & Social Assistance (179 | 15.1%), Construction (149 | 12.6%), Retail Trade (103 | 8.7%), and Public Administration (96 | 8.1%).
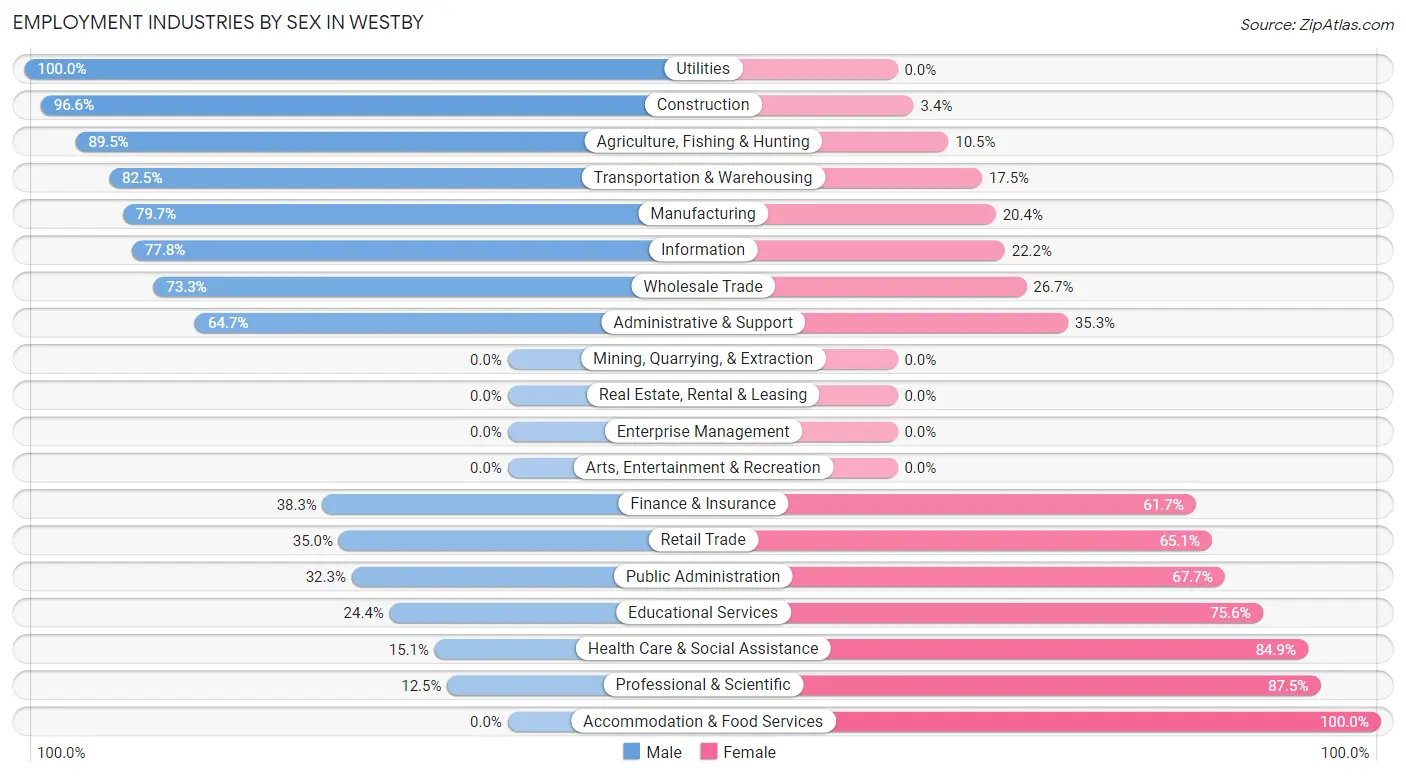
Employment Industries by Sex in Westby
The Westby industries that see more men than women are Utilities (100.0%), Construction (96.6%), and Agriculture, Fishing & Hunting (89.5%), whereas the industries that tend to have a higher number of women are Accommodation & Food Services (100.0%), Professional & Scientific (87.5%), and Health Care & Social Assistance (84.9%).
| Industry | Male | Female |
| Agriculture, Fishing & Hunting | 34 (89.5%) | 4 (10.5%) |
| Mining, Quarrying, & Extraction | 0 (0.0%) | 0 (0.0%) |
| Construction | 144 (96.6%) | 5 (3.4%) |
| Manufacturing | 180 (79.6%) | 46 (20.3%) |
| Wholesale Trade | 33 (73.3%) | 12 (26.7%) |
| Retail Trade | 36 (34.9%) | 67 (65.0%) |
| Transportation & Warehousing | 66 (82.5%) | 14 (17.5%) |
| Utilities | 13 (100.0%) | 0 (0.0%) |
| Information | 14 (77.8%) | 4 (22.2%) |
| Finance & Insurance | 18 (38.3%) | 29 (61.7%) |
| Real Estate, Rental & Leasing | 0 (0.0%) | 0 (0.0%) |
| Professional & Scientific | 4 (12.5%) | 28 (87.5%) |
| Enterprise Management | 0 (0.0%) | 0 (0.0%) |
| Administrative & Support | 22 (64.7%) | 12 (35.3%) |
| Educational Services | 11 (24.4%) | 34 (75.6%) |
| Health Care & Social Assistance | 27 (15.1%) | 152 (84.9%) |
| Arts, Entertainment & Recreation | 0 (0.0%) | 0 (0.0%) |
| Accommodation & Food Services | 0 (0.0%) | 63 (100.0%) |
| Public Administration | 31 (32.3%) | 65 (67.7%) |
| Total | 649 (54.7%) | 538 (45.3%) |
Education in Westby
School Enrollment in Westby
The most common levels of schooling among the 446 students in Westby are middle school (186 | 41.7%), elementary school (100 | 22.4%), and high school (98 | 22.0%).
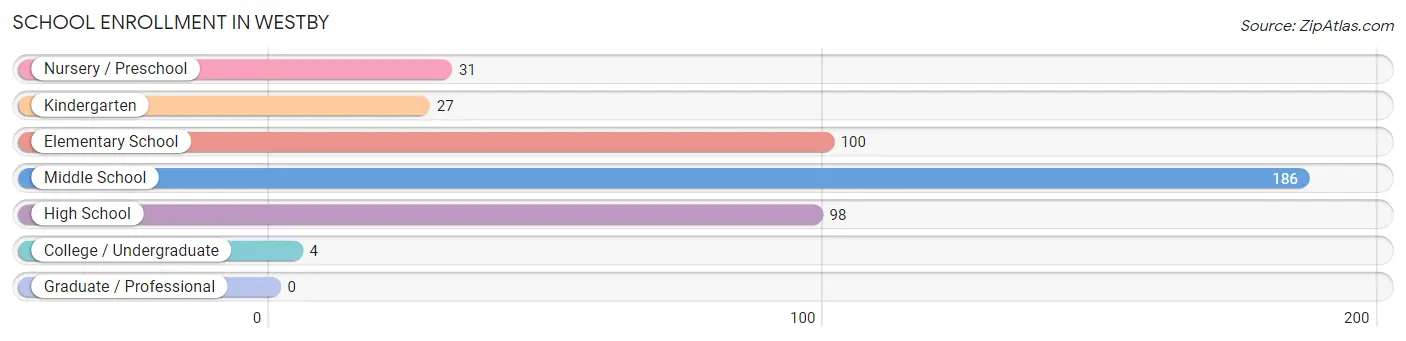
| School Level | # Students | % Students |
| Nursery / Preschool | 31 | 7.0% |
| Kindergarten | 27 | 6.0% |
| Elementary School | 100 | 22.4% |
| Middle School | 186 | 41.7% |
| High School | 98 | 22.0% |
| College / Undergraduate | 4 | 0.9% |
| Graduate / Professional | 0 | 0.0% |
| Total | 446 | 100.0% |
School Enrollment by Age by Funding Source in Westby
Out of a total of 446 students who are enrolled in schools in Westby, 17 (3.8%) attend a private institution, while the remaining 429 (96.2%) are enrolled in public schools. The age group of 15 to 17 year olds has the highest likelihood of being enrolled in private schools, with 14 (17.9% in the age bracket) enrolled. Conversely, the age group of 3 to 4 year olds has the lowest likelihood of being enrolled in a private school, with 6 (100.0% in the age bracket) attending a public institution.
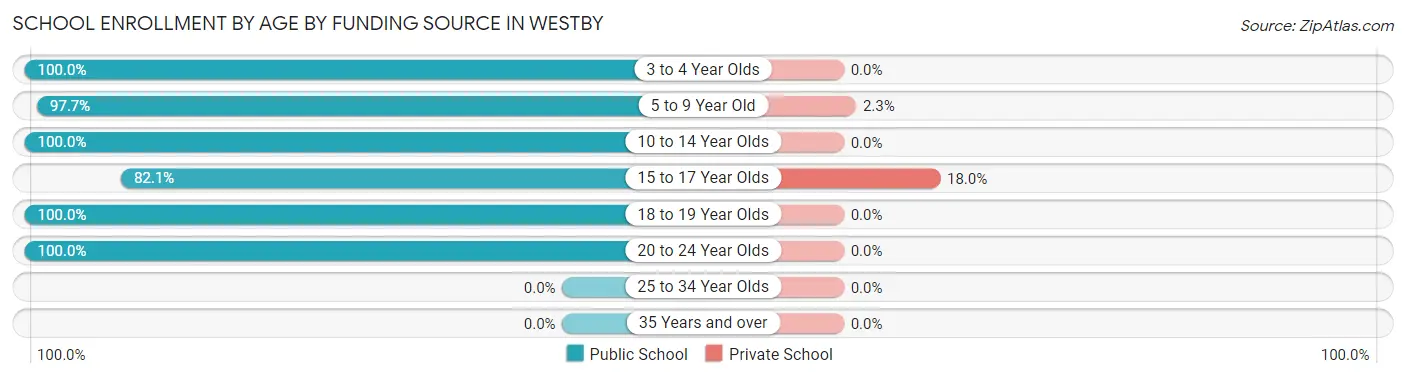
| Age Bracket | Public School | Private School |
| 3 to 4 Year Olds | 6 (100.0%) | 0 (0.0%) |
| 5 to 9 Year Old | 128 (97.7%) | 3 (2.3%) |
| 10 to 14 Year Olds | 213 (100.0%) | 0 (0.0%) |
| 15 to 17 Year Olds | 64 (82.1%) | 14 (17.9%) |
| 18 to 19 Year Olds | 14 (100.0%) | 0 (0.0%) |
| 20 to 24 Year Olds | 4 (100.0%) | 0 (0.0%) |
| 25 to 34 Year Olds | 0 (0.0%) | 0 (0.0%) |
| 35 Years and over | 0 (0.0%) | 0 (0.0%) |
| Total | 429 (96.2%) | 17 (3.8%) |
Educational Attainment by Field of Study in Westby
Business (103 | 23.1%), education (99 | 22.2%), science & technology (71 | 15.9%), arts & humanities (43 | 9.6%), and bio, nature & agricultural (36 | 8.1%) are the most common fields of study among 446 individuals in Westby who have obtained a bachelor's degree or higher.
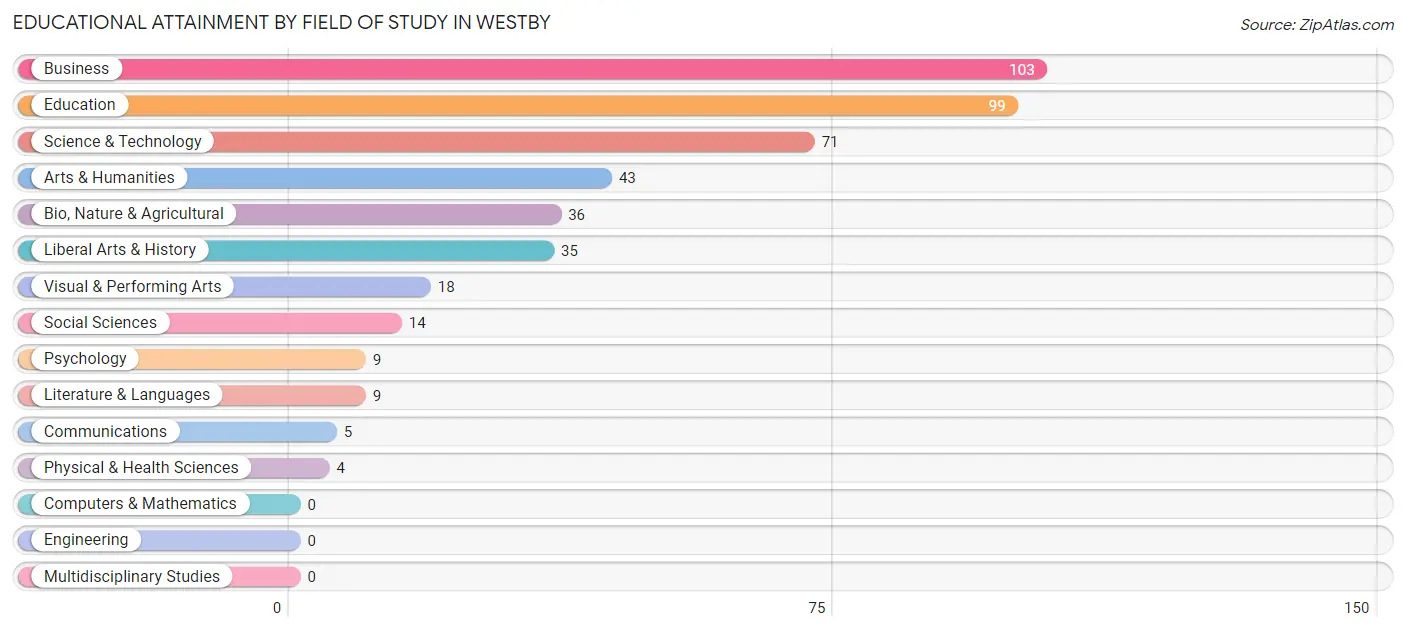
| Field of Study | # Graduates | % Graduates |
| Computers & Mathematics | 0 | 0.0% |
| Bio, Nature & Agricultural | 36 | 8.1% |
| Physical & Health Sciences | 4 | 0.9% |
| Psychology | 9 | 2.0% |
| Social Sciences | 14 | 3.1% |
| Engineering | 0 | 0.0% |
| Multidisciplinary Studies | 0 | 0.0% |
| Science & Technology | 71 | 15.9% |
| Business | 103 | 23.1% |
| Education | 99 | 22.2% |
| Literature & Languages | 9 | 2.0% |
| Liberal Arts & History | 35 | 7.9% |
| Visual & Performing Arts | 18 | 4.0% |
| Communications | 5 | 1.1% |
| Arts & Humanities | 43 | 9.6% |
| Total | 446 | 100.0% |
Transportation & Commute in Westby
Vehicle Availability by Sex in Westby
The most prevalent vehicle ownership categories in Westby are males with 2 vehicles (247, accounting for 38.5%) and females with 2 vehicles (221, making up 47.1%).
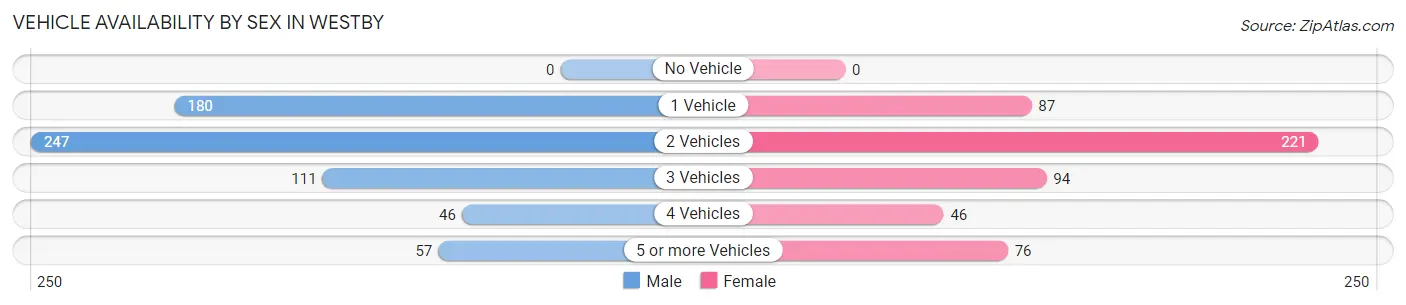
| Vehicles Available | Male | Female |
| No Vehicle | 0 (0.0%) | 0 (0.0%) |
| 1 Vehicle | 180 (28.1%) | 87 (16.6%) |
| 2 Vehicles | 247 (38.5%) | 221 (42.2%) |
| 3 Vehicles | 111 (17.3%) | 94 (17.9%) |
| 4 Vehicles | 46 (7.2%) | 46 (8.8%) |
| 5 or more Vehicles | 57 (8.9%) | 76 (14.5%) |
| Total | 641 (100.0%) | 524 (100.0%) |
Commute Time in Westby
The most frequently occuring commute durations in Westby are 10 to 14 minutes (202 commuters, 18.1%), 15 to 19 minutes (180 commuters, 16.2%), and 5 to 9 minutes (170 commuters, 15.3%).
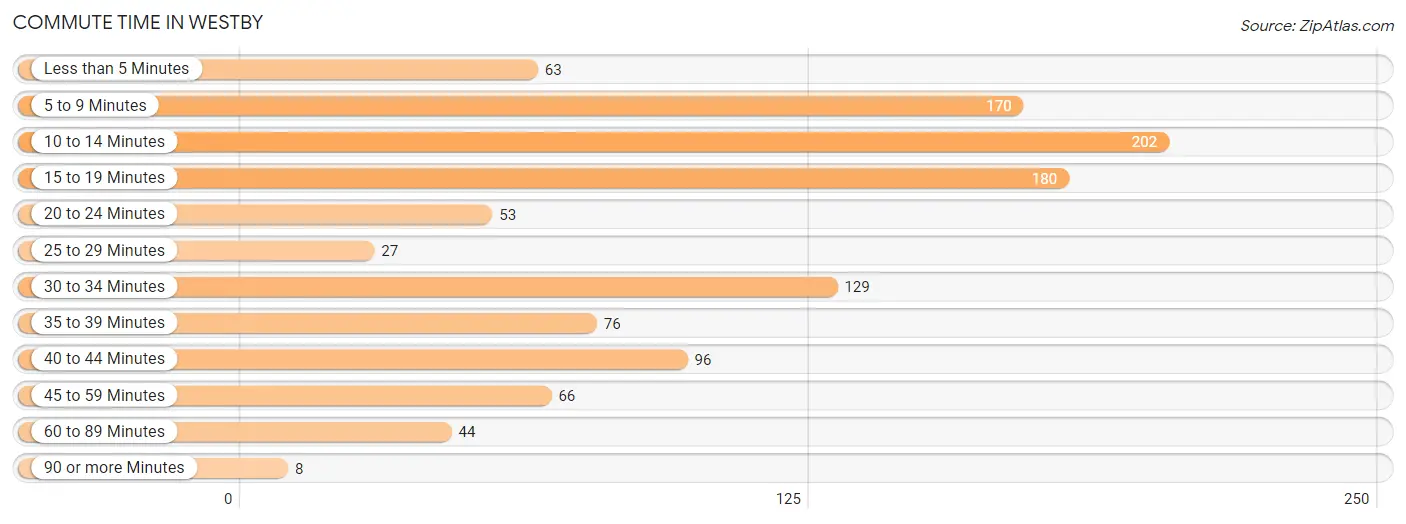
| Commute Time | # Commuters | % Commuters |
| Less than 5 Minutes | 63 | 5.7% |
| 5 to 9 Minutes | 170 | 15.3% |
| 10 to 14 Minutes | 202 | 18.1% |
| 15 to 19 Minutes | 180 | 16.2% |
| 20 to 24 Minutes | 53 | 4.8% |
| 25 to 29 Minutes | 27 | 2.4% |
| 30 to 34 Minutes | 129 | 11.6% |
| 35 to 39 Minutes | 76 | 6.8% |
| 40 to 44 Minutes | 96 | 8.6% |
| 45 to 59 Minutes | 66 | 5.9% |
| 60 to 89 Minutes | 44 | 4.0% |
| 90 or more Minutes | 8 | 0.7% |
Commute Time by Sex in Westby
The most common commute times in Westby are 10 to 14 minutes (122 commuters, 19.6%) for males and 15 to 19 minutes (123 commuters, 25.1%) for females.
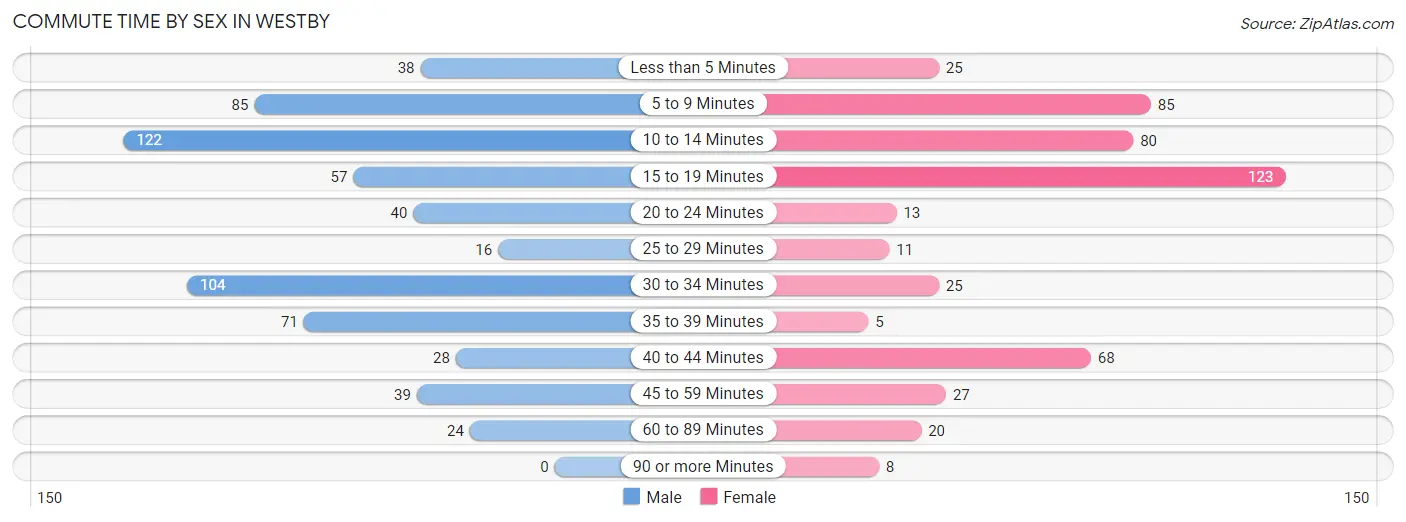
| Commute Time | Male | Female |
| Less than 5 Minutes | 38 (6.1%) | 25 (5.1%) |
| 5 to 9 Minutes | 85 (13.6%) | 85 (17.3%) |
| 10 to 14 Minutes | 122 (19.6%) | 80 (16.3%) |
| 15 to 19 Minutes | 57 (9.1%) | 123 (25.1%) |
| 20 to 24 Minutes | 40 (6.4%) | 13 (2.6%) |
| 25 to 29 Minutes | 16 (2.6%) | 11 (2.2%) |
| 30 to 34 Minutes | 104 (16.7%) | 25 (5.1%) |
| 35 to 39 Minutes | 71 (11.4%) | 5 (1.0%) |
| 40 to 44 Minutes | 28 (4.5%) | 68 (13.9%) |
| 45 to 59 Minutes | 39 (6.2%) | 27 (5.5%) |
| 60 to 89 Minutes | 24 (3.8%) | 20 (4.1%) |
| 90 or more Minutes | 0 (0.0%) | 8 (1.6%) |
Time of Departure to Work by Sex in Westby
The most frequent times of departure to work in Westby are 12:00 AM to 4:59 AM (128, 20.5%) for males and 7:30 AM to 7:59 AM (125, 25.5%) for females.
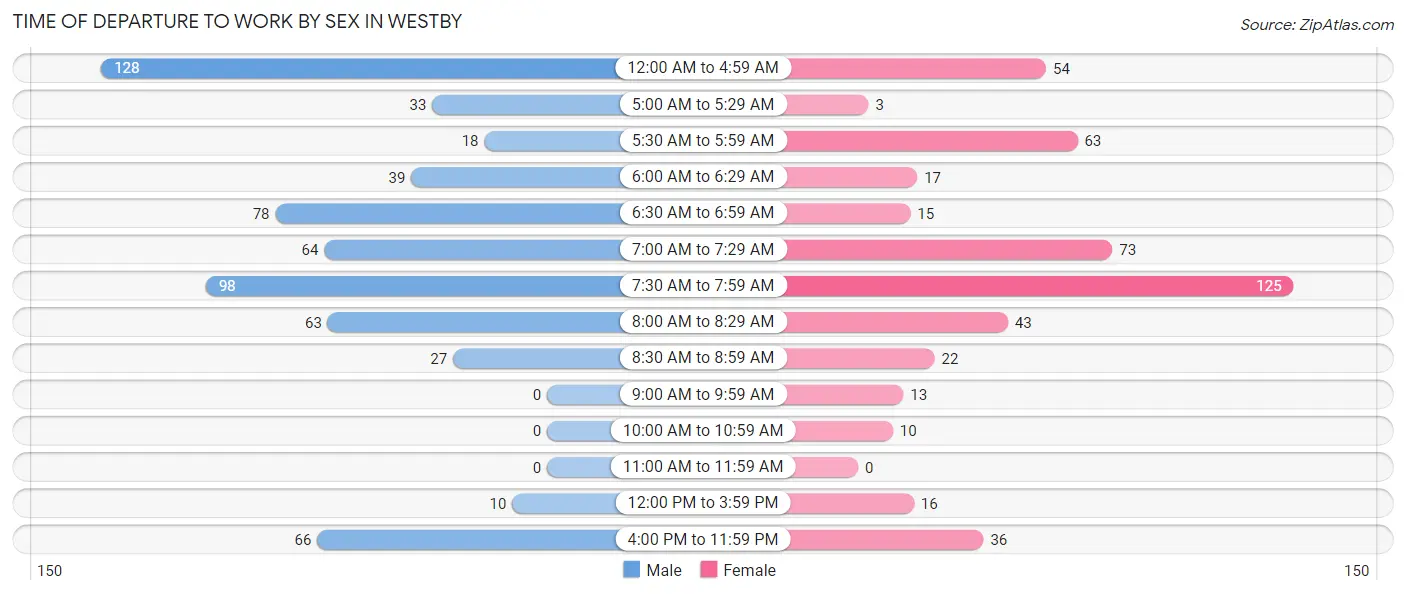
| Time of Departure | Male | Female |
| 12:00 AM to 4:59 AM | 128 (20.5%) | 54 (11.0%) |
| 5:00 AM to 5:29 AM | 33 (5.3%) | 3 (0.6%) |
| 5:30 AM to 5:59 AM | 18 (2.9%) | 63 (12.9%) |
| 6:00 AM to 6:29 AM | 39 (6.2%) | 17 (3.5%) |
| 6:30 AM to 6:59 AM | 78 (12.5%) | 15 (3.1%) |
| 7:00 AM to 7:29 AM | 64 (10.3%) | 73 (14.9%) |
| 7:30 AM to 7:59 AM | 98 (15.7%) | 125 (25.5%) |
| 8:00 AM to 8:29 AM | 63 (10.1%) | 43 (8.8%) |
| 8:30 AM to 8:59 AM | 27 (4.3%) | 22 (4.5%) |
| 9:00 AM to 9:59 AM | 0 (0.0%) | 13 (2.6%) |
| 10:00 AM to 10:59 AM | 0 (0.0%) | 10 (2.0%) |
| 11:00 AM to 11:59 AM | 0 (0.0%) | 0 (0.0%) |
| 12:00 PM to 3:59 PM | 10 (1.6%) | 16 (3.3%) |
| 4:00 PM to 11:59 PM | 66 (10.6%) | 36 (7.3%) |
| Total | 624 (100.0%) | 490 (100.0%) |
Housing Occupancy in Westby
Occupancy by Ownership in Westby
Of the total 973 dwellings in Westby, owner-occupied units account for 742 (76.3%), while renter-occupied units make up 231 (23.7%).
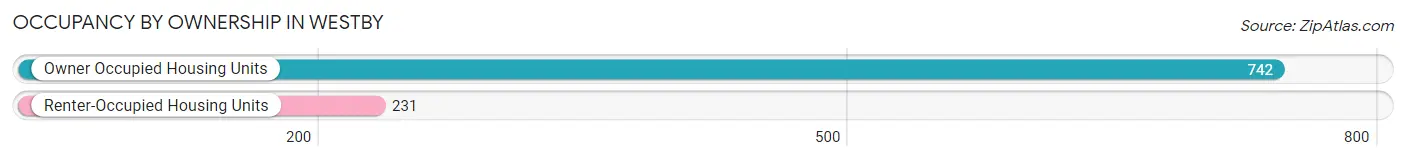
| Occupancy | # Housing Units | % Housing Units |
| Owner Occupied Housing Units | 742 | 76.3% |
| Renter-Occupied Housing Units | 231 | 23.7% |
| Total Occupied Housing Units | 973 | 100.0% |
Occupancy by Household Size in Westby
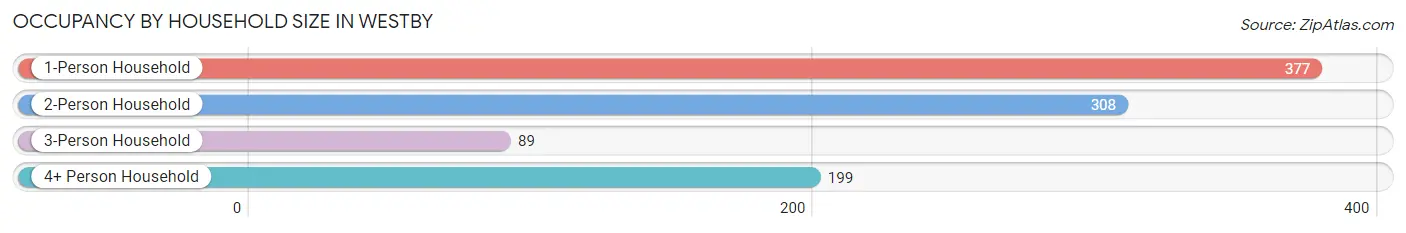
| Household Size | # Housing Units | % Housing Units |
| 1-Person Household | 377 | 38.8% |
| 2-Person Household | 308 | 31.7% |
| 3-Person Household | 89 | 9.1% |
| 4+ Person Household | 199 | 20.4% |
| Total Housing Units | 973 | 100.0% |
Occupancy by Ownership by Household Size in Westby
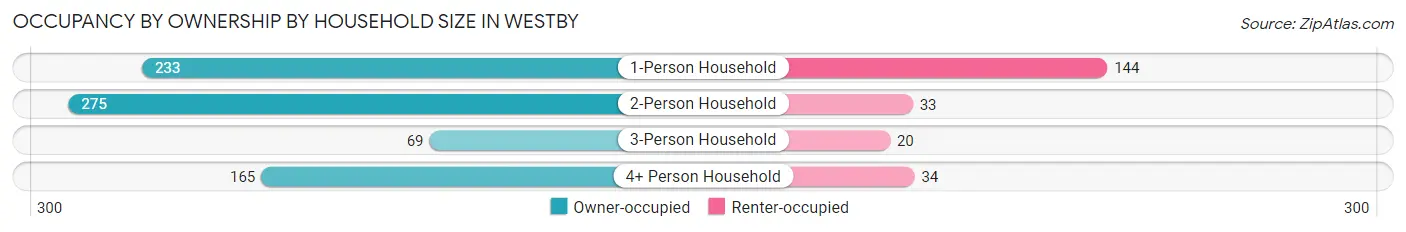
| Household Size | Owner-occupied | Renter-occupied |
| 1-Person Household | 233 (61.8%) | 144 (38.2%) |
| 2-Person Household | 275 (89.3%) | 33 (10.7%) |
| 3-Person Household | 69 (77.5%) | 20 (22.5%) |
| 4+ Person Household | 165 (82.9%) | 34 (17.1%) |
| Total Housing Units | 742 (76.3%) | 231 (23.7%) |
Occupancy by Educational Attainment in Westby
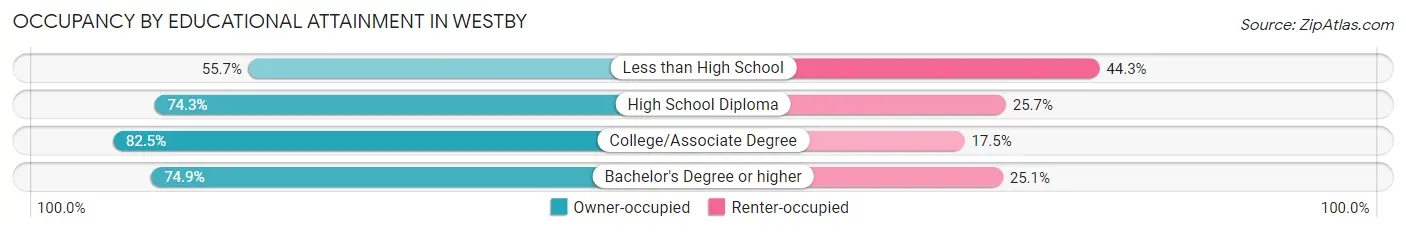
| Household Size | Owner-occupied | Renter-occupied |
| Less than High School | 34 (55.7%) | 27 (44.3%) |
| High School Diploma | 240 (74.3%) | 83 (25.7%) |
| College/Associate Degree | 292 (82.5%) | 62 (17.5%) |
| Bachelor's Degree or higher | 176 (74.9%) | 59 (25.1%) |
Occupancy by Age of Householder in Westby
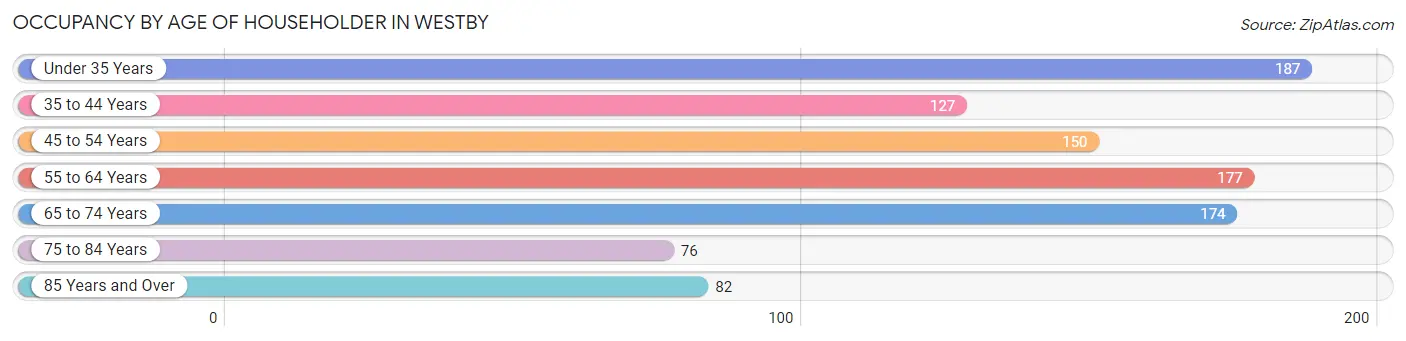
| Age Bracket | # Households | % Households |
| Under 35 Years | 187 | 19.2% |
| 35 to 44 Years | 127 | 13.1% |
| 45 to 54 Years | 150 | 15.4% |
| 55 to 64 Years | 177 | 18.2% |
| 65 to 74 Years | 174 | 17.9% |
| 75 to 84 Years | 76 | 7.8% |
| 85 Years and Over | 82 | 8.4% |
| Total | 973 | 100.0% |
Housing Finances in Westby
Median Income by Occupancy in Westby
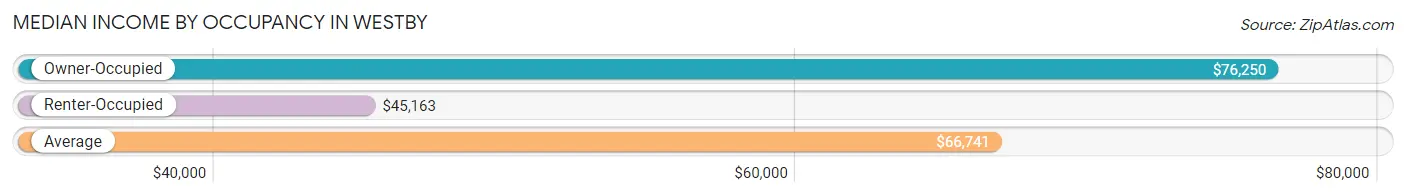
| Occupancy Type | # Households | Median Income |
| Owner-Occupied | 742 (76.3%) | $76,250 |
| Renter-Occupied | 231 (23.7%) | $45,163 |
| Average | 973 (100.0%) | $66,741 |
Occupancy by Householder Income Bracket in Westby
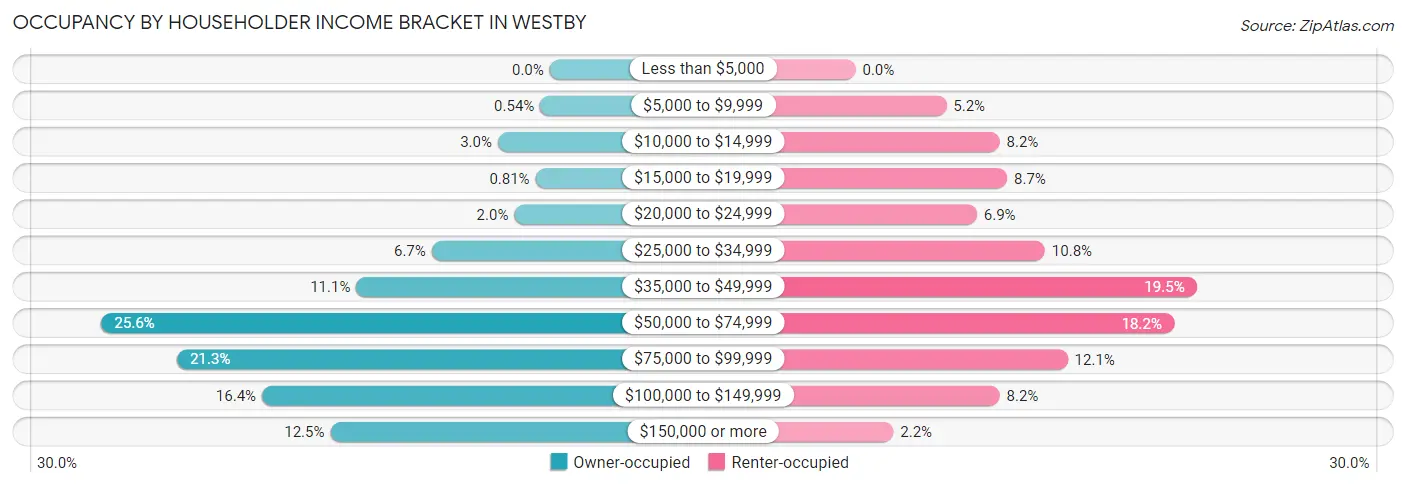
| Income Bracket | Owner-occupied | Renter-occupied |
| Less than $5,000 | 0 (0.0%) | 0 (0.0%) |
| $5,000 to $9,999 | 4 (0.5%) | 12 (5.2%) |
| $10,000 to $14,999 | 22 (3.0%) | 19 (8.2%) |
| $15,000 to $19,999 | 6 (0.8%) | 20 (8.7%) |
| $20,000 to $24,999 | 15 (2.0%) | 16 (6.9%) |
| $25,000 to $34,999 | 50 (6.7%) | 25 (10.8%) |
| $35,000 to $49,999 | 82 (11.1%) | 45 (19.5%) |
| $50,000 to $74,999 | 190 (25.6%) | 42 (18.2%) |
| $75,000 to $99,999 | 158 (21.3%) | 28 (12.1%) |
| $100,000 to $149,999 | 122 (16.4%) | 19 (8.2%) |
| $150,000 or more | 93 (12.5%) | 5 (2.2%) |
| Total | 742 (100.0%) | 231 (100.0%) |
Monthly Housing Cost Tiers in Westby
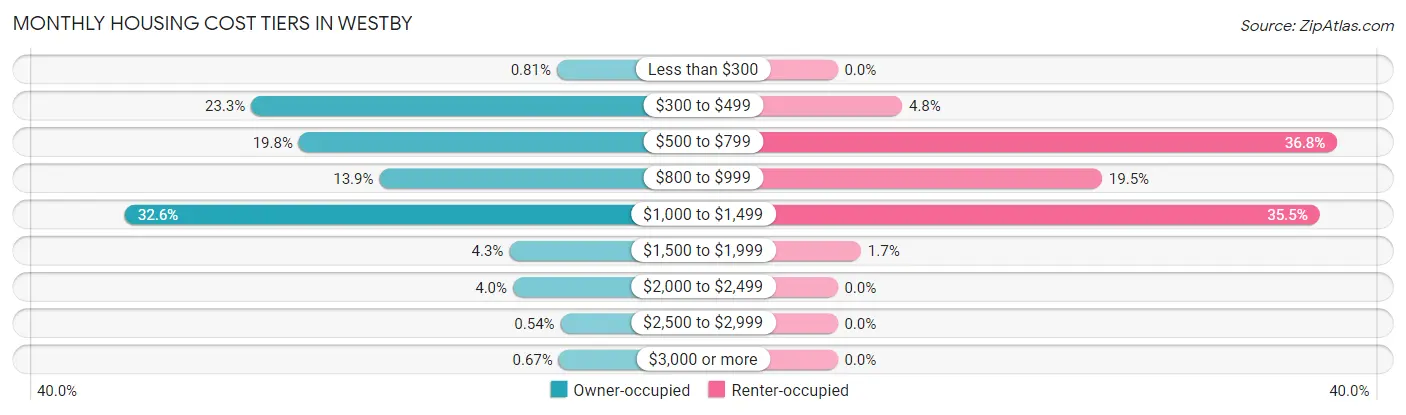
| Monthly Cost | Owner-occupied | Renter-occupied |
| Less than $300 | 6 (0.8%) | 0 (0.0%) |
| $300 to $499 | 173 (23.3%) | 11 (4.8%) |
| $500 to $799 | 147 (19.8%) | 85 (36.8%) |
| $800 to $999 | 103 (13.9%) | 45 (19.5%) |
| $1,000 to $1,499 | 242 (32.6%) | 82 (35.5%) |
| $1,500 to $1,999 | 32 (4.3%) | 4 (1.7%) |
| $2,000 to $2,499 | 30 (4.0%) | 0 (0.0%) |
| $2,500 to $2,999 | 4 (0.5%) | 0 (0.0%) |
| $3,000 or more | 5 (0.7%) | 0 (0.0%) |
| Total | 742 (100.0%) | 231 (100.0%) |
Physical Housing Characteristics in Westby
Housing Structures in Westby
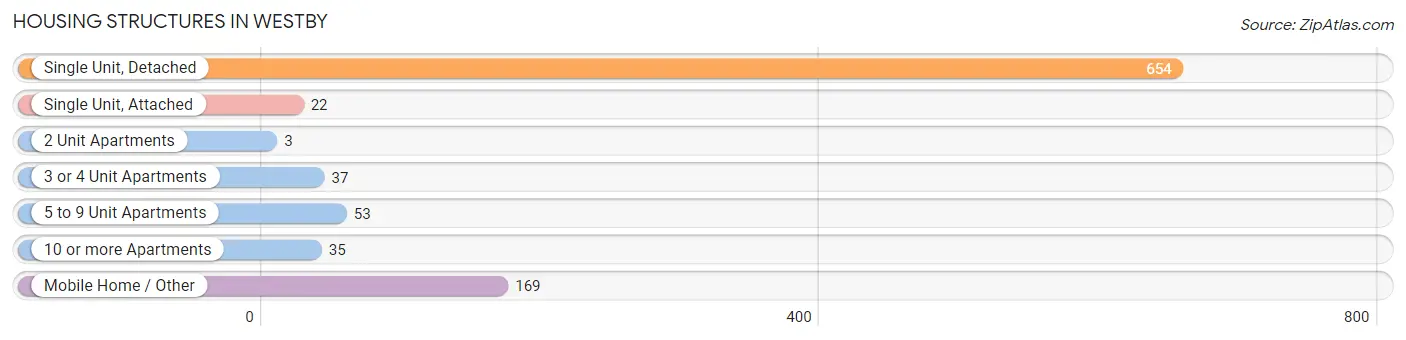
| Structure Type | # Housing Units | % Housing Units |
| Single Unit, Detached | 654 | 67.2% |
| Single Unit, Attached | 22 | 2.3% |
| 2 Unit Apartments | 3 | 0.3% |
| 3 or 4 Unit Apartments | 37 | 3.8% |
| 5 to 9 Unit Apartments | 53 | 5.4% |
| 10 or more Apartments | 35 | 3.6% |
| Mobile Home / Other | 169 | 17.4% |
| Total | 973 | 100.0% |
Housing Structures by Occupancy in Westby
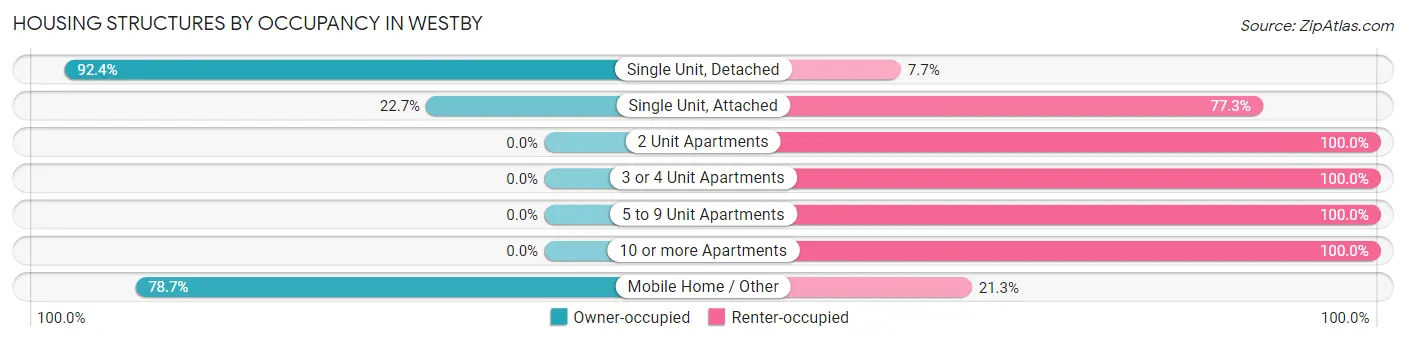
| Structure Type | Owner-occupied | Renter-occupied |
| Single Unit, Detached | 604 (92.3%) | 50 (7.6%) |
| Single Unit, Attached | 5 (22.7%) | 17 (77.3%) |
| 2 Unit Apartments | 0 (0.0%) | 3 (100.0%) |
| 3 or 4 Unit Apartments | 0 (0.0%) | 37 (100.0%) |
| 5 to 9 Unit Apartments | 0 (0.0%) | 53 (100.0%) |
| 10 or more Apartments | 0 (0.0%) | 35 (100.0%) |
| Mobile Home / Other | 133 (78.7%) | 36 (21.3%) |
| Total | 742 (76.3%) | 231 (23.7%) |
Housing Structures by Number of Rooms in Westby
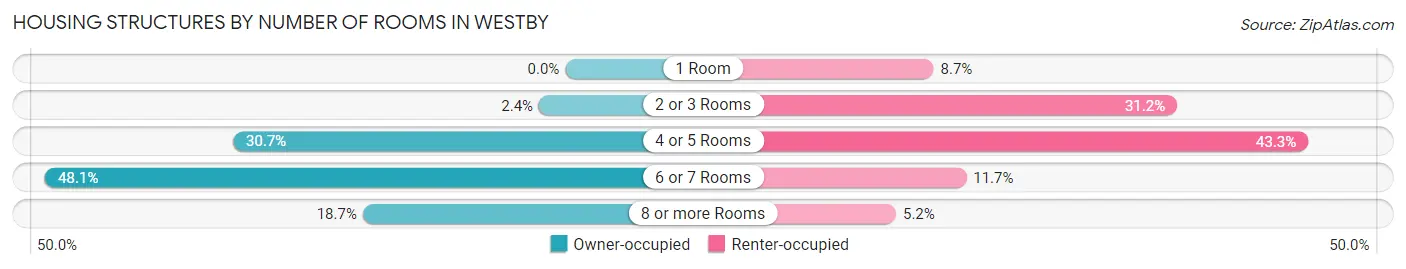
| Number of Rooms | Owner-occupied | Renter-occupied |
| 1 Room | 0 (0.0%) | 20 (8.7%) |
| 2 or 3 Rooms | 18 (2.4%) | 72 (31.2%) |
| 4 or 5 Rooms | 228 (30.7%) | 100 (43.3%) |
| 6 or 7 Rooms | 357 (48.1%) | 27 (11.7%) |
| 8 or more Rooms | 139 (18.7%) | 12 (5.2%) |
| Total | 742 (100.0%) | 231 (100.0%) |
Housing Structure by Heating Type in Westby
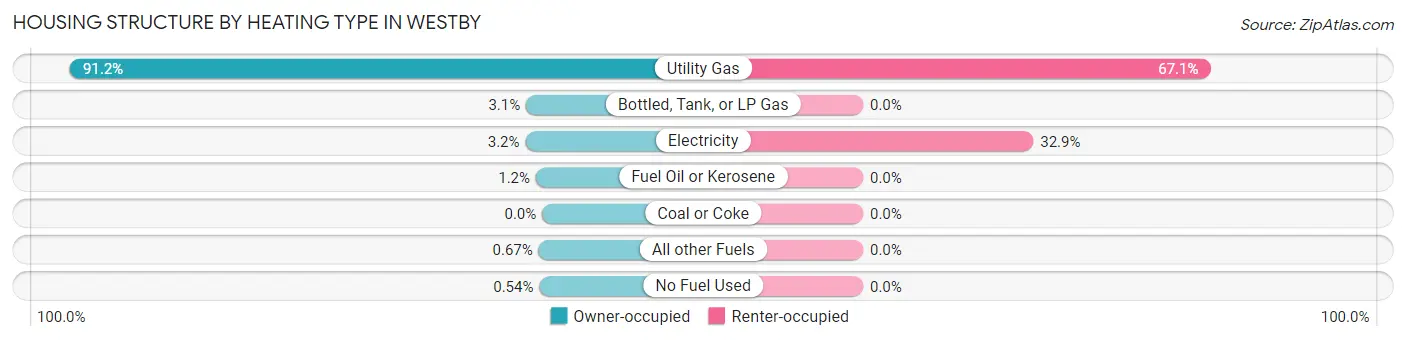
| Heating Type | Owner-occupied | Renter-occupied |
| Utility Gas | 677 (91.2%) | 155 (67.1%) |
| Bottled, Tank, or LP Gas | 23 (3.1%) | 0 (0.0%) |
| Electricity | 24 (3.2%) | 76 (32.9%) |
| Fuel Oil or Kerosene | 9 (1.2%) | 0 (0.0%) |
| Coal or Coke | 0 (0.0%) | 0 (0.0%) |
| All other Fuels | 5 (0.7%) | 0 (0.0%) |
| No Fuel Used | 4 (0.5%) | 0 (0.0%) |
| Total | 742 (100.0%) | 231 (100.0%) |
Household Vehicle Usage in Westby
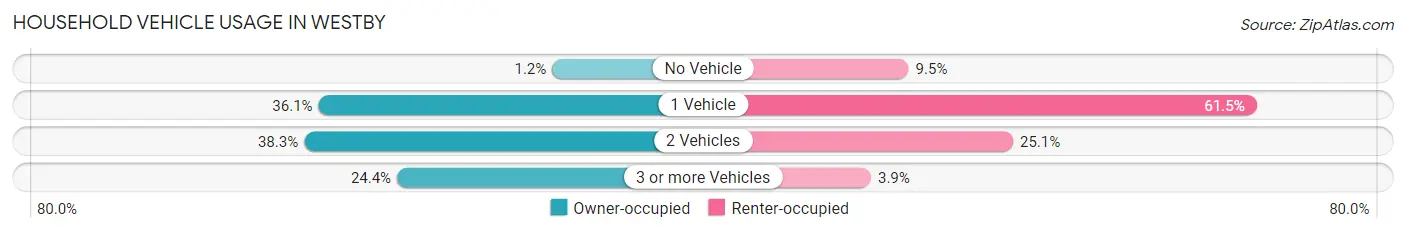
| Vehicles per Household | Owner-occupied | Renter-occupied |
| No Vehicle | 9 (1.2%) | 22 (9.5%) |
| 1 Vehicle | 268 (36.1%) | 142 (61.5%) |
| 2 Vehicles | 284 (38.3%) | 58 (25.1%) |
| 3 or more Vehicles | 181 (24.4%) | 9 (3.9%) |
| Total | 742 (100.0%) | 231 (100.0%) |
Real Estate & Mortgages in Westby
Real Estate and Mortgage Overview in Westby
| Characteristic | Without Mortgage | With Mortgage |
| Housing Units | 294 | 448 |
| Median Property Value | $95,000 | $149,400 |
| Median Household Income | $59,286 | $80 |
| Monthly Housing Costs | $437 | $5 |
| Real Estate Taxes | $1,765 | $0 |
Property Value by Mortgage Status in Westby
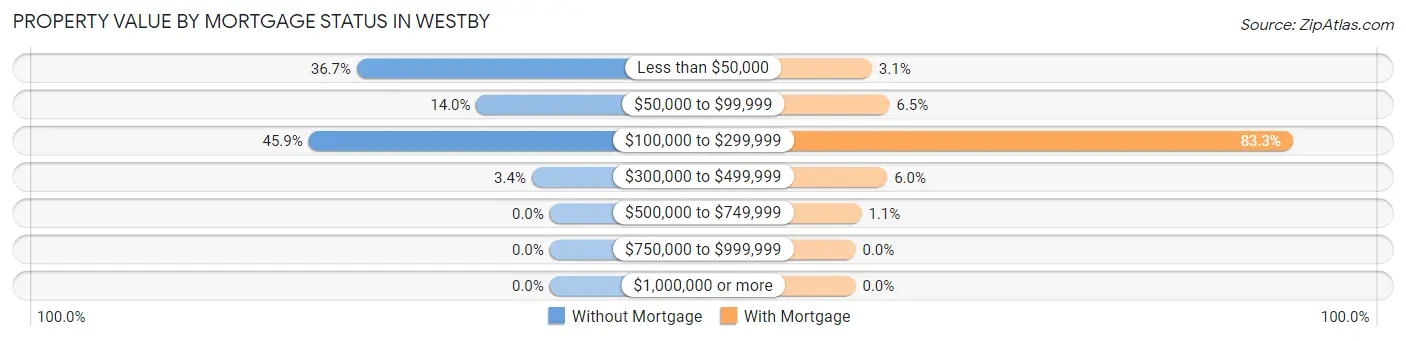
| Property Value | Without Mortgage | With Mortgage |
| Less than $50,000 | 108 (36.7%) | 14 (3.1%) |
| $50,000 to $99,999 | 41 (14.0%) | 29 (6.5%) |
| $100,000 to $299,999 | 135 (45.9%) | 373 (83.3%) |
| $300,000 to $499,999 | 10 (3.4%) | 27 (6.0%) |
| $500,000 to $749,999 | 0 (0.0%) | 5 (1.1%) |
| $750,000 to $999,999 | 0 (0.0%) | 0 (0.0%) |
| $1,000,000 or more | 0 (0.0%) | 0 (0.0%) |
| Total | 294 (100.0%) | 448 (100.0%) |
Household Income by Mortgage Status in Westby
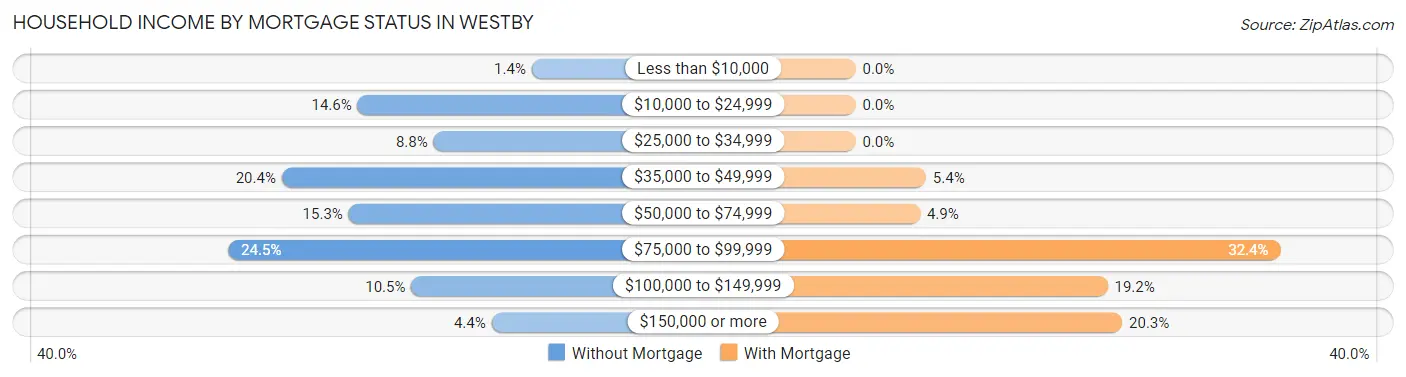
| Household Income | Without Mortgage | With Mortgage |
| Less than $10,000 | 4 (1.4%) | 0 (0.0%) |
| $10,000 to $24,999 | 43 (14.6%) | 0 (0.0%) |
| $25,000 to $34,999 | 26 (8.8%) | 0 (0.0%) |
| $35,000 to $49,999 | 60 (20.4%) | 24 (5.4%) |
| $50,000 to $74,999 | 45 (15.3%) | 22 (4.9%) |
| $75,000 to $99,999 | 72 (24.5%) | 145 (32.4%) |
| $100,000 to $149,999 | 31 (10.5%) | 86 (19.2%) |
| $150,000 or more | 13 (4.4%) | 91 (20.3%) |
| Total | 294 (100.0%) | 448 (100.0%) |
Property Value to Household Income Ratio in Westby
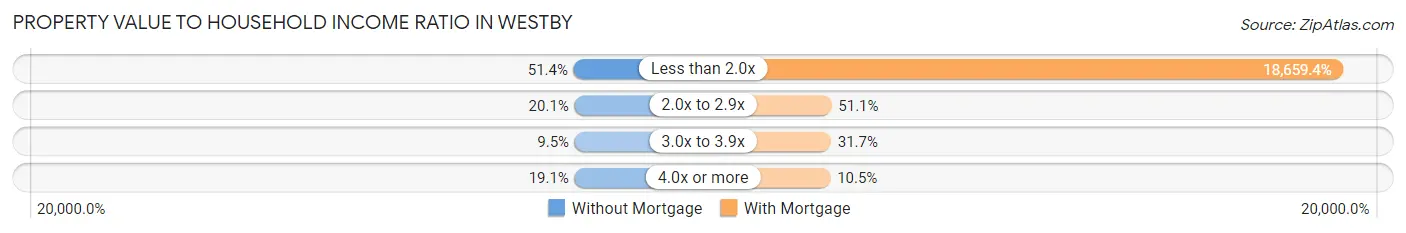
| Value-to-Income Ratio | Without Mortgage | With Mortgage |
| Less than 2.0x | 151 (51.4%) | 83,594 (18,659.4%) |
| 2.0x to 2.9x | 59 (20.1%) | 229 (51.1%) |
| 3.0x to 3.9x | 28 (9.5%) | 142 (31.7%) |
| 4.0x or more | 56 (19.1%) | 47 (10.5%) |
| Total | 294 (100.0%) | 448 (100.0%) |
Real Estate Taxes by Mortgage Status in Westby
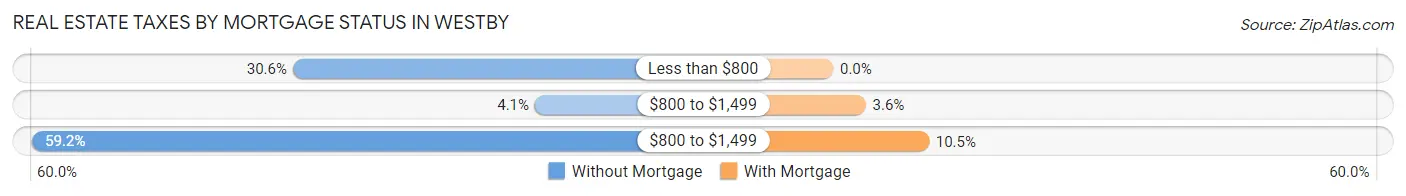
| Property Taxes | Without Mortgage | With Mortgage |
| Less than $800 | 90 (30.6%) | 0 (0.0%) |
| $800 to $1,499 | 12 (4.1%) | 16 (3.6%) |
| $800 to $1,499 | 174 (59.2%) | 47 (10.5%) |
| Total | 294 (100.0%) | 448 (100.0%) |
Health & Disability in Westby
Health Insurance Coverage by Age in Westby
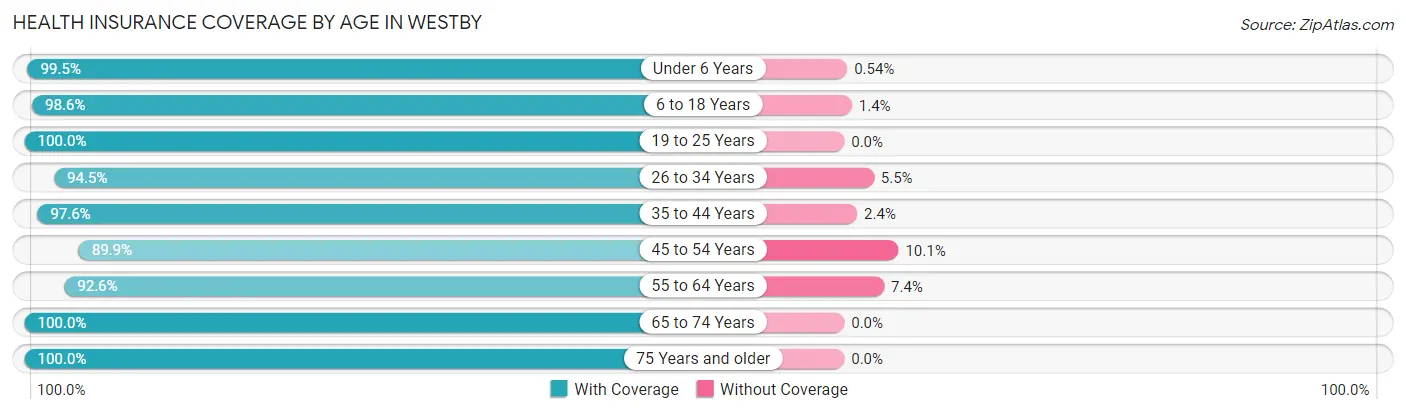
| Age Bracket | With Coverage | Without Coverage |
| Under 6 Years | 183 (99.5%) | 1 (0.5%) |
| 6 to 18 Years | 420 (98.6%) | 6 (1.4%) |
| 19 to 25 Years | 131 (100.0%) | 0 (0.0%) |
| 26 to 34 Years | 257 (94.5%) | 15 (5.5%) |
| 35 to 44 Years | 244 (97.6%) | 6 (2.4%) |
| 45 to 54 Years | 240 (89.9%) | 27 (10.1%) |
| 55 to 64 Years | 262 (92.6%) | 21 (7.4%) |
| 65 to 74 Years | 271 (100.0%) | 0 (0.0%) |
| 75 Years and older | 234 (100.0%) | 0 (0.0%) |
| Total | 2,242 (96.7%) | 76 (3.3%) |
Health Insurance Coverage by Citizenship Status in Westby
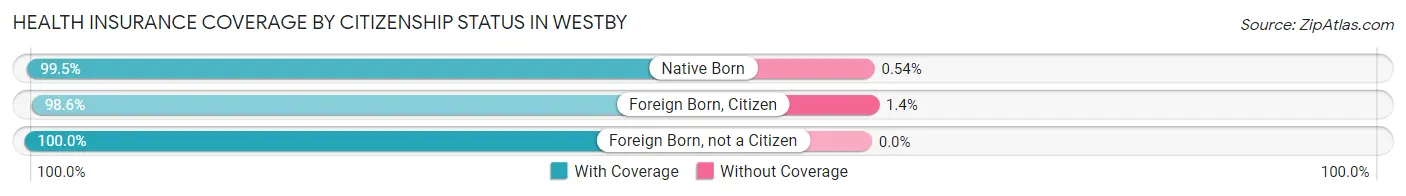
| Citizenship Status | With Coverage | Without Coverage |
| Native Born | 183 (99.5%) | 1 (0.5%) |
| Foreign Born, Citizen | 420 (98.6%) | 6 (1.4%) |
| Foreign Born, not a Citizen | 131 (100.0%) | 0 (0.0%) |
Health Insurance Coverage by Household Income in Westby
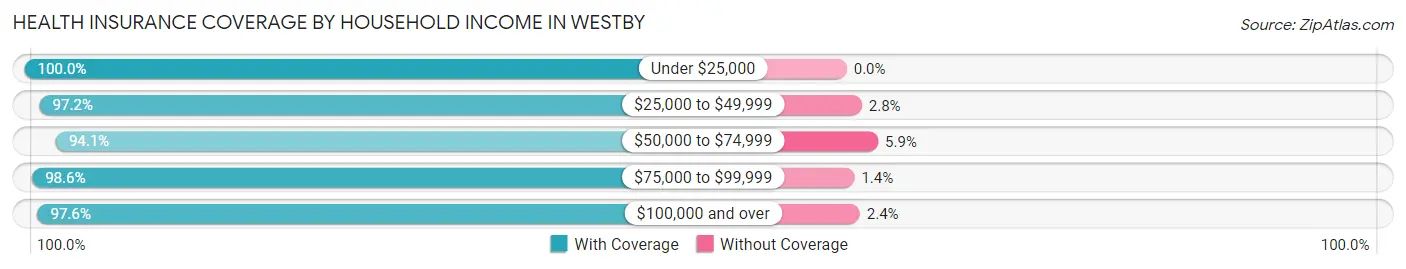
| Household Income | With Coverage | Without Coverage |
| Under $25,000 | 143 (100.0%) | 0 (0.0%) |
| $25,000 to $49,999 | 379 (97.2%) | 11 (2.8%) |
| $50,000 to $74,999 | 400 (94.1%) | 25 (5.9%) |
| $75,000 to $99,999 | 546 (98.6%) | 8 (1.4%) |
| $100,000 and over | 761 (97.6%) | 19 (2.4%) |
Public vs Private Health Insurance Coverage by Age in Westby
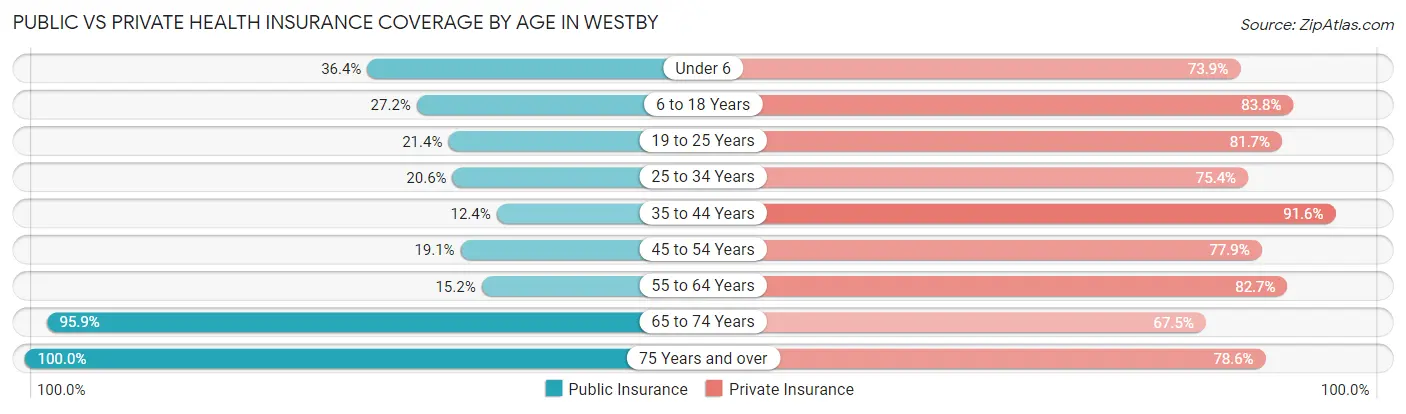
| Age Bracket | Public Insurance | Private Insurance |
| Under 6 | 67 (36.4%) | 136 (73.9%) |
| 6 to 18 Years | 116 (27.2%) | 357 (83.8%) |
| 19 to 25 Years | 28 (21.4%) | 107 (81.7%) |
| 25 to 34 Years | 56 (20.6%) | 205 (75.4%) |
| 35 to 44 Years | 31 (12.4%) | 229 (91.6%) |
| 45 to 54 Years | 51 (19.1%) | 208 (77.9%) |
| 55 to 64 Years | 43 (15.2%) | 234 (82.7%) |
| 65 to 74 Years | 260 (95.9%) | 183 (67.5%) |
| 75 Years and over | 234 (100.0%) | 184 (78.6%) |
| Total | 886 (38.2%) | 1,843 (79.5%) |
Disability Status by Sex by Age in Westby
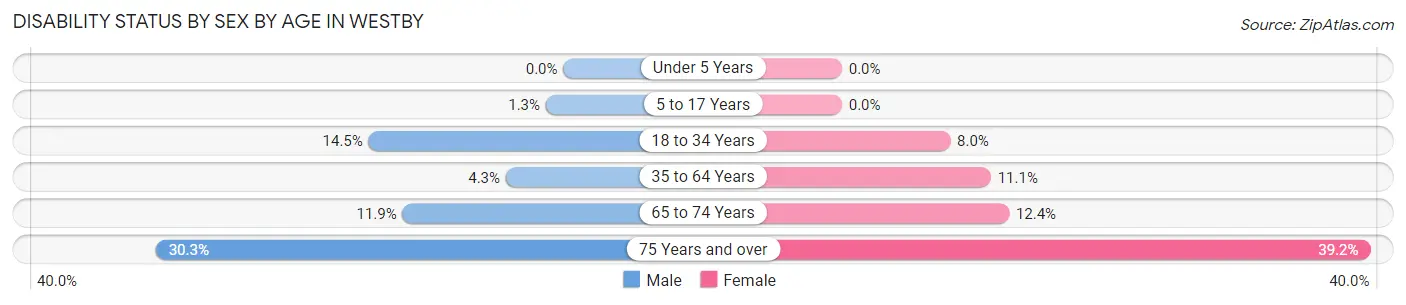
| Age Bracket | Male | Female |
| Under 5 Years | 0 (0.0%) | 0 (0.0%) |
| 5 to 17 Years | 3 (1.3%) | 0 (0.0%) |
| 18 to 34 Years | 35 (14.5%) | 16 (8.0%) |
| 35 to 64 Years | 16 (4.3%) | 47 (11.1%) |
| 65 to 74 Years | 16 (11.9%) | 17 (12.4%) |
| 75 Years and over | 23 (30.3%) | 62 (39.2%) |
Disability Class by Sex by Age in Westby
Disability Class: Hearing Difficulty
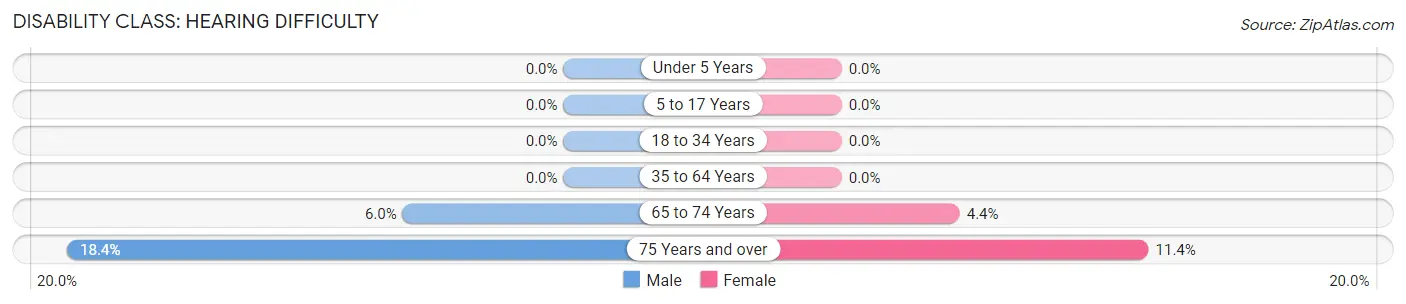
| Age Bracket | Male | Female |
| Under 5 Years | 0 (0.0%) | 0 (0.0%) |
| 5 to 17 Years | 0 (0.0%) | 0 (0.0%) |
| 18 to 34 Years | 0 (0.0%) | 0 (0.0%) |
| 35 to 64 Years | 0 (0.0%) | 0 (0.0%) |
| 65 to 74 Years | 8 (6.0%) | 6 (4.4%) |
| 75 Years and over | 14 (18.4%) | 18 (11.4%) |
Disability Class: Vision Difficulty
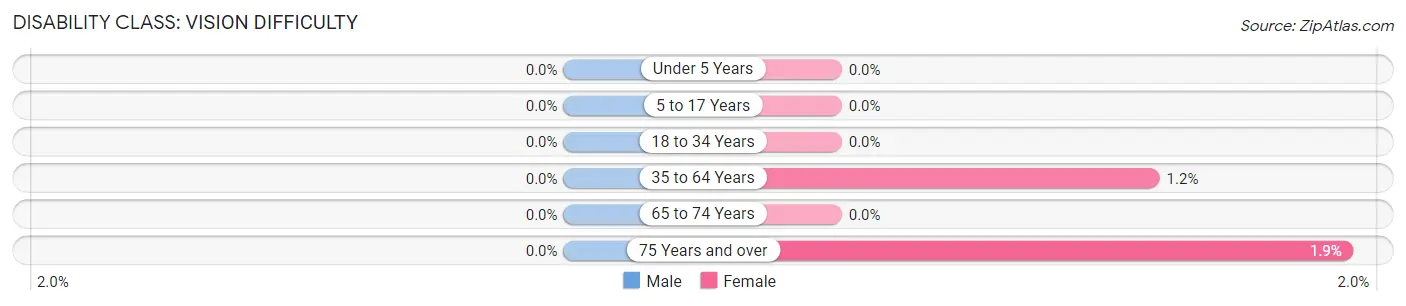
| Age Bracket | Male | Female |
| Under 5 Years | 0 (0.0%) | 0 (0.0%) |
| 5 to 17 Years | 0 (0.0%) | 0 (0.0%) |
| 18 to 34 Years | 0 (0.0%) | 0 (0.0%) |
| 35 to 64 Years | 0 (0.0%) | 5 (1.2%) |
| 65 to 74 Years | 0 (0.0%) | 0 (0.0%) |
| 75 Years and over | 0 (0.0%) | 3 (1.9%) |
Disability Class: Cognitive Difficulty
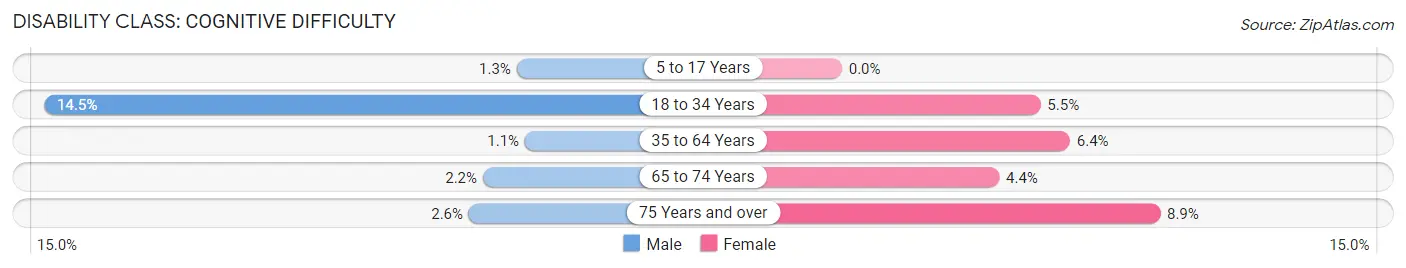
| Age Bracket | Male | Female |
| 5 to 17 Years | 3 (1.3%) | 0 (0.0%) |
| 18 to 34 Years | 35 (14.5%) | 11 (5.5%) |
| 35 to 64 Years | 4 (1.1%) | 27 (6.4%) |
| 65 to 74 Years | 3 (2.2%) | 6 (4.4%) |
| 75 Years and over | 2 (2.6%) | 14 (8.9%) |
Disability Class: Ambulatory Difficulty
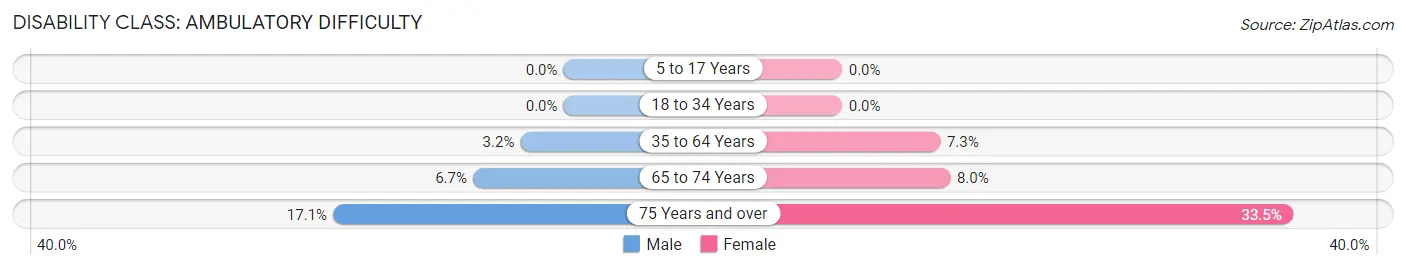
| Age Bracket | Male | Female |
| 5 to 17 Years | 0 (0.0%) | 0 (0.0%) |
| 18 to 34 Years | 0 (0.0%) | 0 (0.0%) |
| 35 to 64 Years | 12 (3.2%) | 31 (7.3%) |
| 65 to 74 Years | 9 (6.7%) | 11 (8.0%) |
| 75 Years and over | 13 (17.1%) | 53 (33.5%) |
Disability Class: Self-Care Difficulty
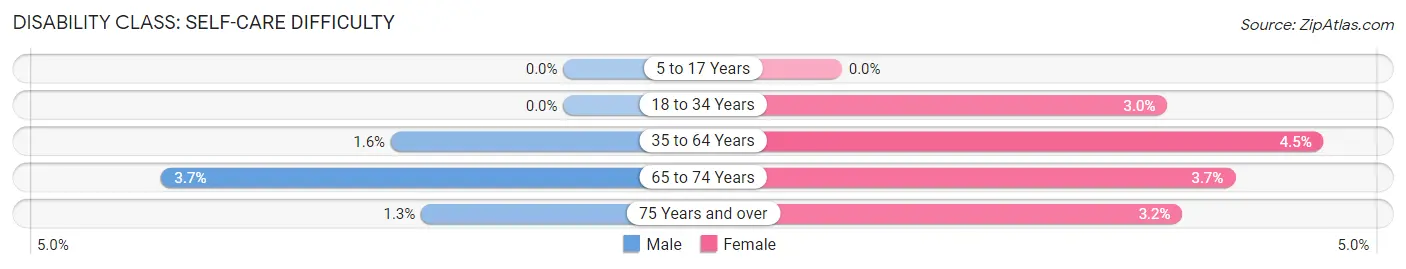
| Age Bracket | Male | Female |
| 5 to 17 Years | 0 (0.0%) | 0 (0.0%) |
| 18 to 34 Years | 0 (0.0%) | 6 (3.0%) |
| 35 to 64 Years | 6 (1.6%) | 19 (4.5%) |
| 65 to 74 Years | 5 (3.7%) | 5 (3.6%) |
| 75 Years and over | 1 (1.3%) | 5 (3.2%) |
Technology Access in Westby
Computing Device Access in Westby
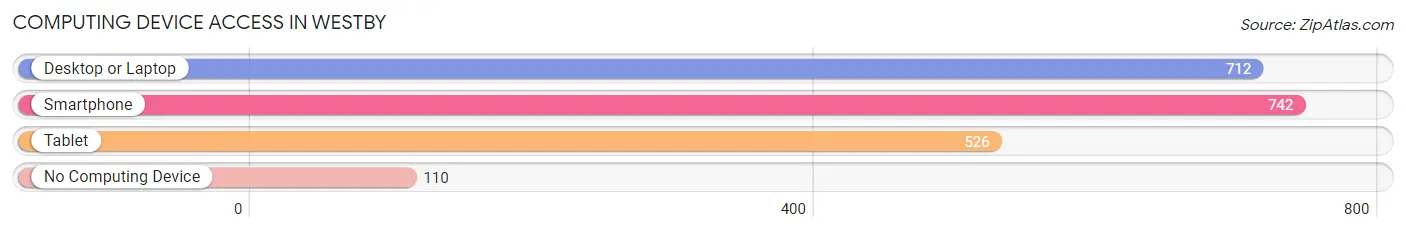
| Device Type | # Households | % Households |
| Desktop or Laptop | 712 | 73.2% |
| Smartphone | 742 | 76.3% |
| Tablet | 526 | 54.1% |
| No Computing Device | 110 | 11.3% |
| Total | 973 | 100.0% |
Internet Access in Westby
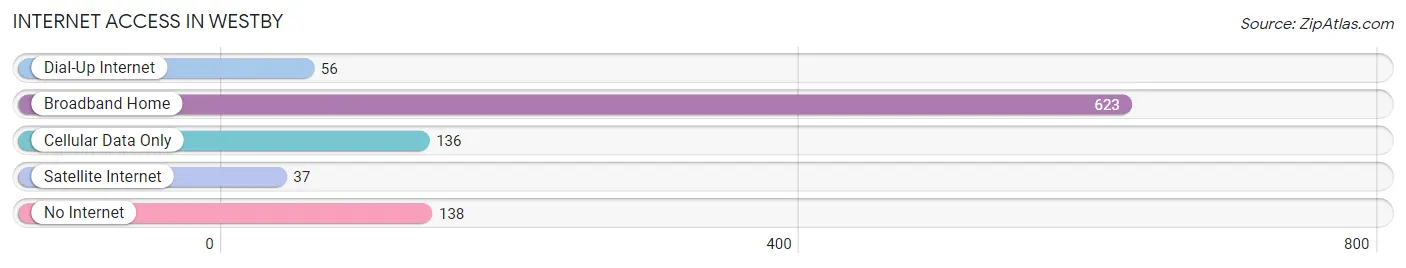
| Internet Type | # Households | % Households |
| Dial-Up Internet | 56 | 5.8% |
| Broadband Home | 623 | 64.0% |
| Cellular Data Only | 136 | 14.0% |
| Satellite Internet | 37 | 3.8% |
| No Internet | 138 | 14.2% |
| Total | 973 | 100.0% |
Westby Summary
Westby, Wisconsin is a small town located in the southwestern corner of the state. It is situated in the rolling hills of the Driftless Area, a region of the Midwest that was not glaciated during the last ice age. The town is located in Vernon County, which is part of the La Crosse-Eau Claire metropolitan area. As of the 2010 census, the population of Westby was 1,717.
Geography
Westby is located at 43°45'N 91°17'W (43.75, -91.28). It is situated in the rolling hills of the Driftless Area, a region of the Midwest that was not glaciated during the last ice age. The town is located in Vernon County, which is part of the La Crosse-Eau Claire metropolitan area. The town is bordered by the towns of Coon, Genoa, and Viroqua. The Kickapoo River runs through the town, and the Kickapoo Valley Reserve is located nearby.
History
Westby was founded in 1854 by Norwegian immigrants. The town was named after Westby, Norway, the hometown of the first settlers. The first settlers were mostly farmers, and the town quickly grew to become a center of commerce and industry. In the late 19th century, Westby was home to several sawmills, a cheese factory, and a brickyard.
In the early 20th century, Westby became a popular tourist destination. The town was home to several resorts, including the Westby House, which was built in 1910. The Westby House was a popular destination for visitors from all over the Midwest.
Economy
Westby’s economy is largely based on agriculture. The town is home to several dairy farms, as well as a number of other farms that produce corn, soybeans, and other crops. The town is also home to several small businesses, including a grocery store, a hardware store, and a restaurant.
Demographics
As of the 2010 census, the population of Westby was 1,717. The racial makeup of the town was 97.2% White, 0.3% African American, 0.3% Native American, 0.3% Asian, 0.2% from other races, and 1.7% from two or more races. Hispanic or Latino of any race were 1.2% of the population.
The median income for a household in Westby was $45,938, and the median income for a family was $51,250. The per capita income for the town was $20,945. About 8.2% of families and 10.2% of the population were below the poverty line, including 14.2% of those under age 18 and 8.3% of those age 65 or over.
Conclusion
Westby, Wisconsin is a small town located in the southwestern corner of the state. It is situated in the rolling hills of the Driftless Area, a region of the Midwest that was not glaciated during the last ice age. The town is home to a diverse population and a strong agricultural economy. Westby has a long history of welcoming immigrants and visitors, and it continues to be a popular destination for tourists from all over the Midwest.
Common Questions
What is Per Capita Income in Westby?
Per Capita income in Westby is $33,937.
What is the Median Family Income in Westby?
Median Family Income in Westby is $81,389.
What is the Median Household income in Westby?
Median Household Income in Westby is $66,741.
What is Income or Wage Gap in Westby?
Income or Wage Gap in Westby is 36.1%.
Women in Westby earn 63.9 cents for every dollar earned by a man.
What is Inequality or Gini Index in Westby?
Inequality or Gini Index in Westby is 0.35.
What is the Total Population of Westby?
Total Population of Westby is 2,318.
What is the Total Male Population of Westby?
Total Male Population of Westby is 1,144.
What is the Total Female Population of Westby?
Total Female Population of Westby is 1,174.
What is the Ratio of Males per 100 Females in Westby?
There are 97.44 Males per 100 Females in Westby.
What is the Ratio of Females per 100 Males in Westby?
There are 102.62 Females per 100 Males in Westby.
What is the Median Population Age in Westby?
Median Population Age in Westby is 40.5 Years.
What is the Average Family Size in Westby
Average Family Size in Westby is 3.3 People.
What is the Average Household Size in Westby
Average Household Size in Westby is 2.4 People.
How Large is the Labor Force in Westby?
There are 1,218 People in the Labor Forcein in Westby.
What is the Percentage of People in the Labor Force in Westby?
67.5% of People are in the Labor Force in Westby.
What is the Unemployment Rate in Westby?
Unemployment Rate in Westby is 2.5%.