Fredonia, WI Map & Demographics
Fredonia Map
Fredonia Overview
$40,622
PER CAPITA INCOME
$110,481
AVG FAMILY INCOME
$86,518
AVG HOUSEHOLD INCOME
27.3%
WAGE / INCOME GAP [ % ]
72.7¢/ $1
WAGE / INCOME GAP [ $ ]
0.40
INEQUALITY / GINI INDEX
2,446
TOTAL POPULATION
1,227
MALE POPULATION
1,219
FEMALE POPULATION
100.66
MALES / 100 FEMALES
99.35
FEMALES / 100 MALES
36.2
MEDIAN AGE
3.4
AVG FAMILY SIZE
2.9
AVG HOUSEHOLD SIZE
1,498
LABOR FORCE [ PEOPLE ]
76.0%
PERCENT IN LABOR FORCE
4.0%
UNEMPLOYMENT RATE
Fredonia Zip Codes
Fredonia Area Codes
Income in Fredonia
Income Overview in Fredonia
Per Capita Income in Fredonia is $40,622, while median incomes of families and households are $110,481 and $86,518 respectively.
| Characteristic | Number | Measure |
| Per Capita Income | 2,446 | $40,622 |
| Median Family Income | 632 | $110,481 |
| Mean Family Income | 632 | $125,198 |
| Median Household Income | 845 | $86,518 |
| Mean Household Income | 845 | $110,218 |
| Income Deficit | 632 | $0 |
| Wage / Income Gap (%) | 2,446 | 27.30% |
| Wage / Income Gap ($) | 2,446 | 72.70¢ per $1 |
| Gini / Inequality Index | 2,446 | 0.40 |
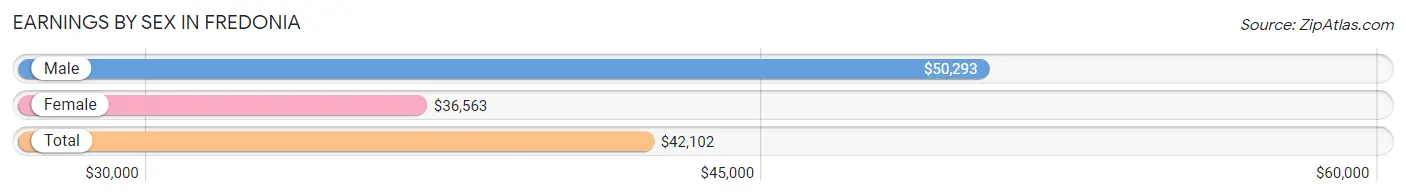
Earnings by Sex in Fredonia
Average Earnings in Fredonia are $42,102, $50,293 for men and $36,563 for women, a difference of 27.3%.
| Sex | Number | Average Earnings |
| Male | 797 (52.3%) | $50,293 |
| Female | 728 (47.7%) | $36,563 |
| Total | 1,525 (100.0%) | $42,102 |
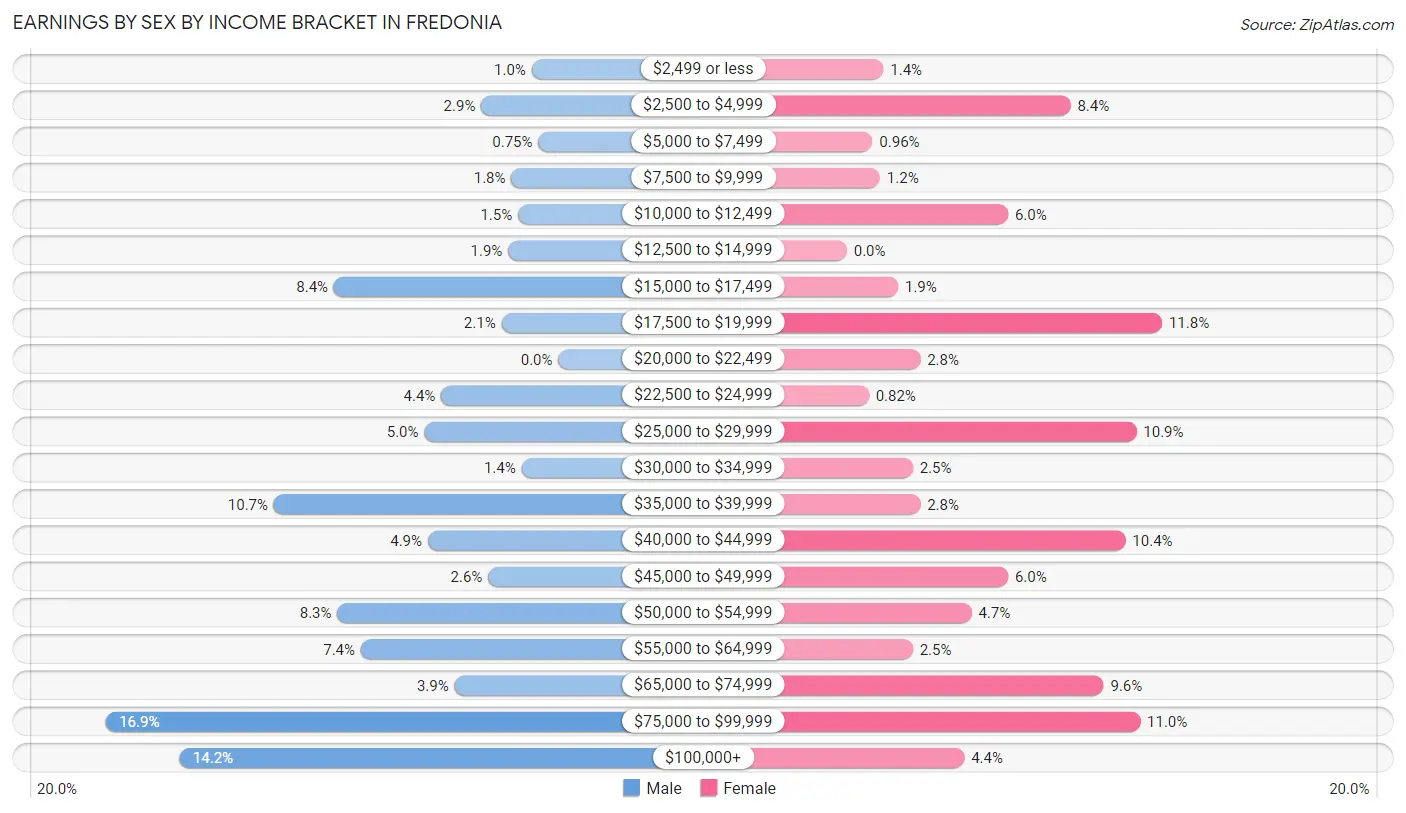
Earnings by Sex by Income Bracket in Fredonia
The most common earnings brackets in Fredonia are $75,000 to $99,999 for men (135 | 16.9%) and $17,500 to $19,999 for women (86 | 11.8%).
| Income | Male | Female |
| $2,499 or less | 8 (1.0%) | 10 (1.4%) |
| $2,500 to $4,999 | 23 (2.9%) | 61 (8.4%) |
| $5,000 to $7,499 | 6 (0.7%) | 7 (1.0%) |
| $7,500 to $9,999 | 14 (1.8%) | 9 (1.2%) |
| $10,000 to $12,499 | 12 (1.5%) | 44 (6.0%) |
| $12,500 to $14,999 | 15 (1.9%) | 0 (0.0%) |
| $15,000 to $17,499 | 67 (8.4%) | 14 (1.9%) |
| $17,500 to $19,999 | 17 (2.1%) | 86 (11.8%) |
| $20,000 to $22,499 | 0 (0.0%) | 20 (2.8%) |
| $22,500 to $24,999 | 35 (4.4%) | 6 (0.8%) |
| $25,000 to $29,999 | 40 (5.0%) | 79 (10.8%) |
| $30,000 to $34,999 | 11 (1.4%) | 18 (2.5%) |
| $35,000 to $39,999 | 85 (10.7%) | 20 (2.8%) |
| $40,000 to $44,999 | 39 (4.9%) | 76 (10.4%) |
| $45,000 to $49,999 | 21 (2.6%) | 44 (6.0%) |
| $50,000 to $54,999 | 66 (8.3%) | 34 (4.7%) |
| $55,000 to $64,999 | 59 (7.4%) | 18 (2.5%) |
| $65,000 to $74,999 | 31 (3.9%) | 70 (9.6%) |
| $75,000 to $99,999 | 135 (16.9%) | 80 (11.0%) |
| $100,000+ | 113 (14.2%) | 32 (4.4%) |
| Total | 797 (100.0%) | 728 (100.0%) |
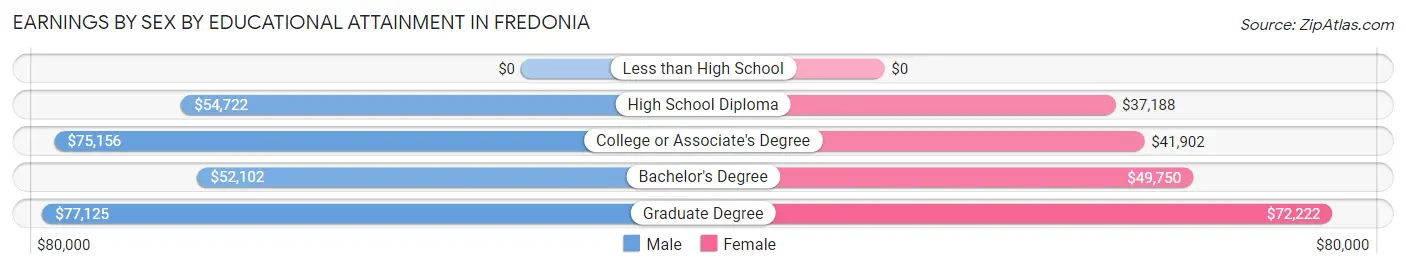
Earnings by Sex by Educational Attainment in Fredonia
Average earnings in Fredonia are $60,878 for men and $45,083 for women, a difference of 26.0%. Men with an educational attainment of graduate degree enjoy the highest average annual earnings of $77,125, while those with bachelor's degree education earn the least with $52,102. Women with an educational attainment of graduate degree earn the most with the average annual earnings of $72,222, while those with high school diploma education have the smallest earnings of $37,188.
| Educational Attainment | Male Income | Female Income |
| Less than High School | - | - |
| High School Diploma | $54,722 | $37,188 |
| College or Associate's Degree | $75,156 | $41,902 |
| Bachelor's Degree | $52,102 | $49,750 |
| Graduate Degree | $77,125 | $72,222 |
| Total | $60,878 | $45,083 |
Family Income in Fredonia
Family Income Brackets in Fredonia
According to the Fredonia family income data, there are 160 families falling into the $100,000 to $149,999 income range, which is the most common income bracket and makes up 25.3% of all families.
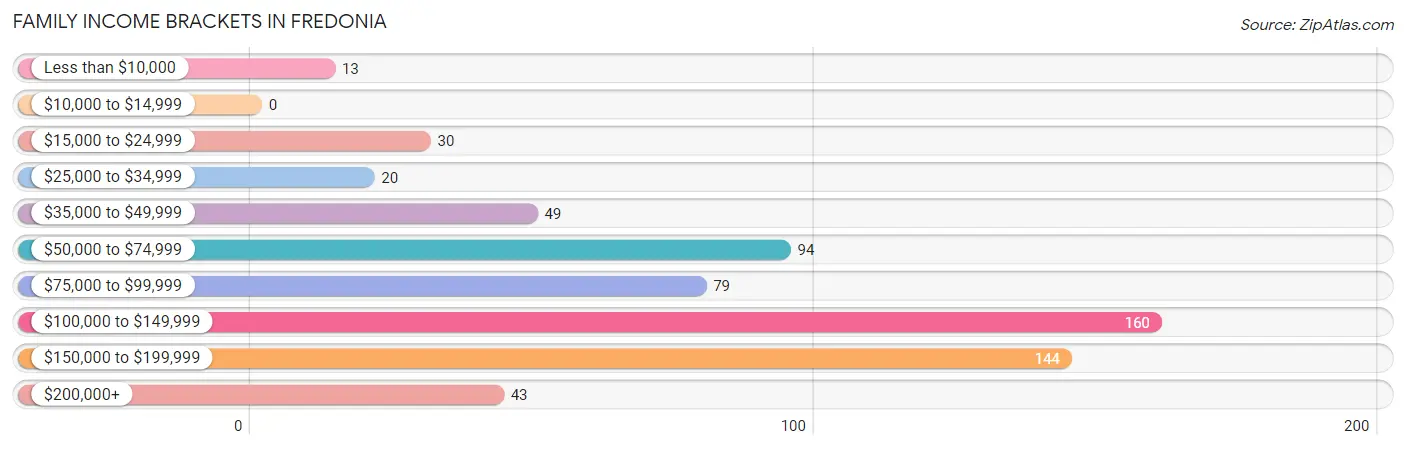
| Income Bracket | # Families | % Families |
| Less than $10,000 | 13 | 2.1% |
| $10,000 to $14,999 | 0 | 0.0% |
| $15,000 to $24,999 | 30 | 4.7% |
| $25,000 to $34,999 | 20 | 3.2% |
| $35,000 to $49,999 | 49 | 7.8% |
| $50,000 to $74,999 | 94 | 14.9% |
| $75,000 to $99,999 | 79 | 12.5% |
| $100,000 to $149,999 | 160 | 25.3% |
| $150,000 to $199,999 | 144 | 22.8% |
| $200,000+ | 43 | 6.8% |
Family Income by Famaliy Size in Fredonia
5-person families (27 | 4.3%) account for the highest median family income in Fredonia with $168,661 per family, while 3-person families (160 | 25.3%) have the highest median income of $43,125 per family member.
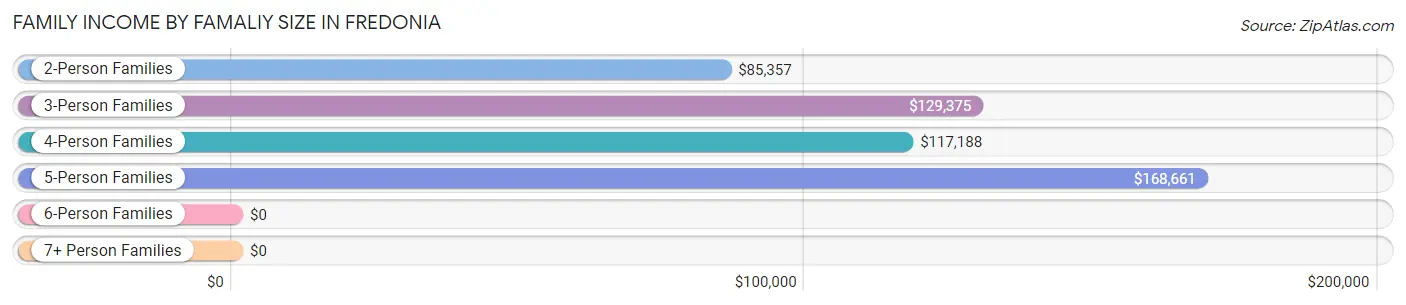
| Income Bracket | # Families | Median Income |
| 2-Person Families | 264 (41.8%) | $85,357 |
| 3-Person Families | 160 (25.3%) | $129,375 |
| 4-Person Families | 163 (25.8%) | $117,188 |
| 5-Person Families | 27 (4.3%) | $168,661 |
| 6-Person Families | 5 (0.8%) | $0 |
| 7+ Person Families | 13 (2.1%) | $0 |
| Total | 632 (100.0%) | $110,481 |
Family Income by Number of Earners in Fredonia
The median family income in Fredonia is $110,481, with families comprising 3+ earners (123) having the highest median family income of $167,798, while families with no earners (66) have the lowest median family income of $47,500, accounting for 19.5% and 10.4% of families, respectively.
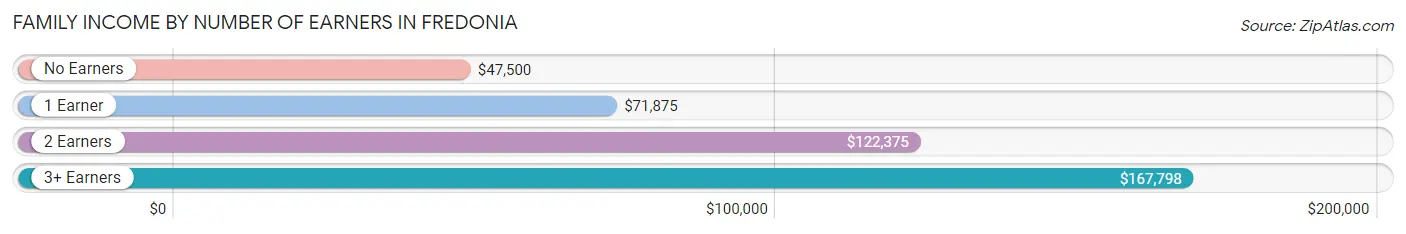
| Number of Earners | # Families | Median Income |
| No Earners | 66 (10.4%) | $47,500 |
| 1 Earner | 174 (27.5%) | $71,875 |
| 2 Earners | 269 (42.6%) | $122,375 |
| 3+ Earners | 123 (19.5%) | $167,798 |
| Total | 632 (100.0%) | $110,481 |
Household Income in Fredonia
Household Income Brackets in Fredonia
With 175 households falling in the category, the $100,000 to $149,999 income range is the most frequent in Fredonia, accounting for 20.7% of all households. In contrast, only 4 households (0.5%) fall into the $10,000 to $14,999 income bracket, making it the least populous group.
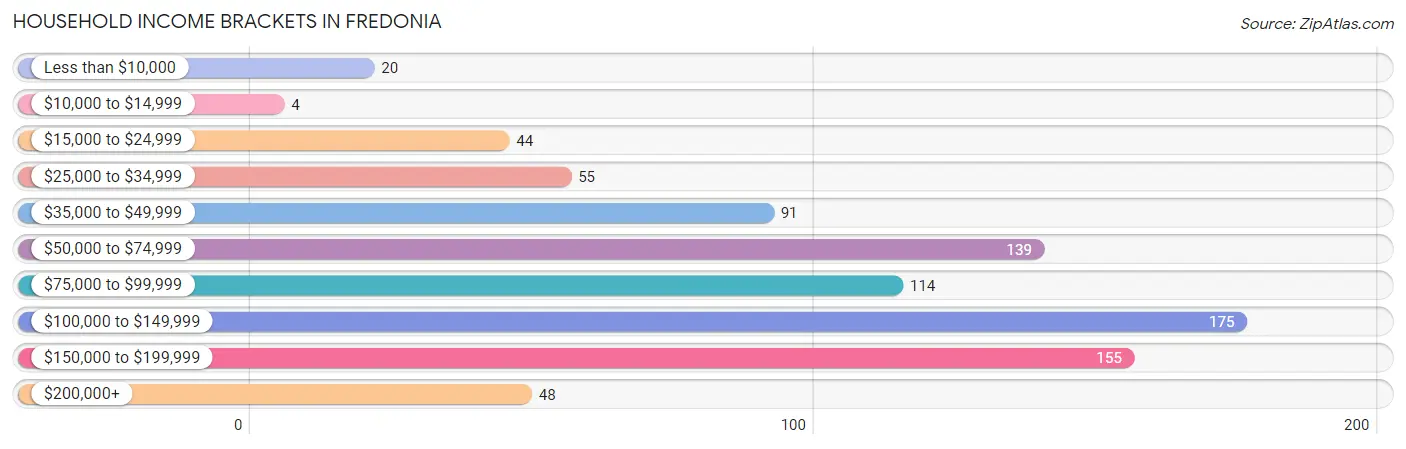
| Income Bracket | # Households | % Households |
| Less than $10,000 | 20 | 2.4% |
| $10,000 to $14,999 | 4 | 0.5% |
| $15,000 to $24,999 | 44 | 5.2% |
| $25,000 to $34,999 | 55 | 6.5% |
| $35,000 to $49,999 | 91 | 10.8% |
| $50,000 to $74,999 | 139 | 16.4% |
| $75,000 to $99,999 | 114 | 13.5% |
| $100,000 to $149,999 | 175 | 20.7% |
| $150,000 to $199,999 | 155 | 18.3% |
| $200,000+ | 48 | 5.7% |
Household Income by Householder Age in Fredonia
The median household income in Fredonia is $86,518, with the highest median household income of $113,021 found in the 45 to 64 years age bracket for the primary householder. A total of 335 households (39.6%) fall into this category. Meanwhile, the 65+ years age bracket for the primary householder has the lowest median household income of $66,563, with 182 households (21.5%) in this group.
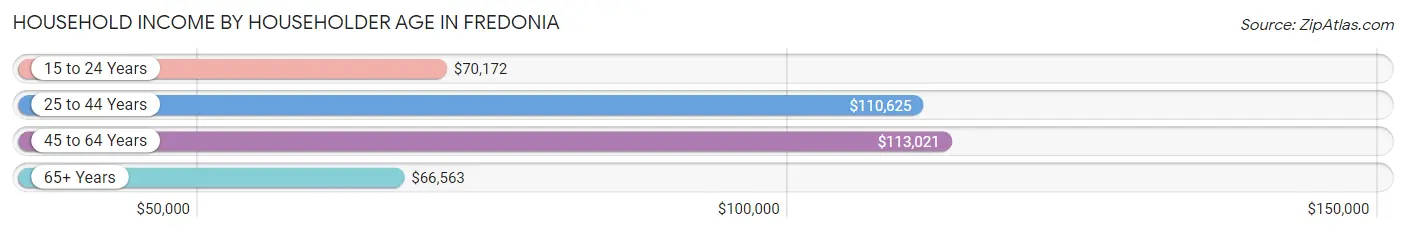
| Income Bracket | # Households | Median Income |
| 15 to 24 Years | 54 (6.4%) | $70,172 |
| 25 to 44 Years | 274 (32.4%) | $110,625 |
| 45 to 64 Years | 335 (39.6%) | $113,021 |
| 65+ Years | 182 (21.5%) | $66,563 |
| Total | 845 (100.0%) | $86,518 |
Poverty in Fredonia
Income Below Poverty by Sex and Age in Fredonia
With 5.7% poverty level for males and 10.6% for females among the residents of Fredonia, under 5 year old males and 15 year old females are the most vulnerable to poverty, with 27 males (39.1%) and 8 females (38.1%) in their respective age groups living below the poverty level.
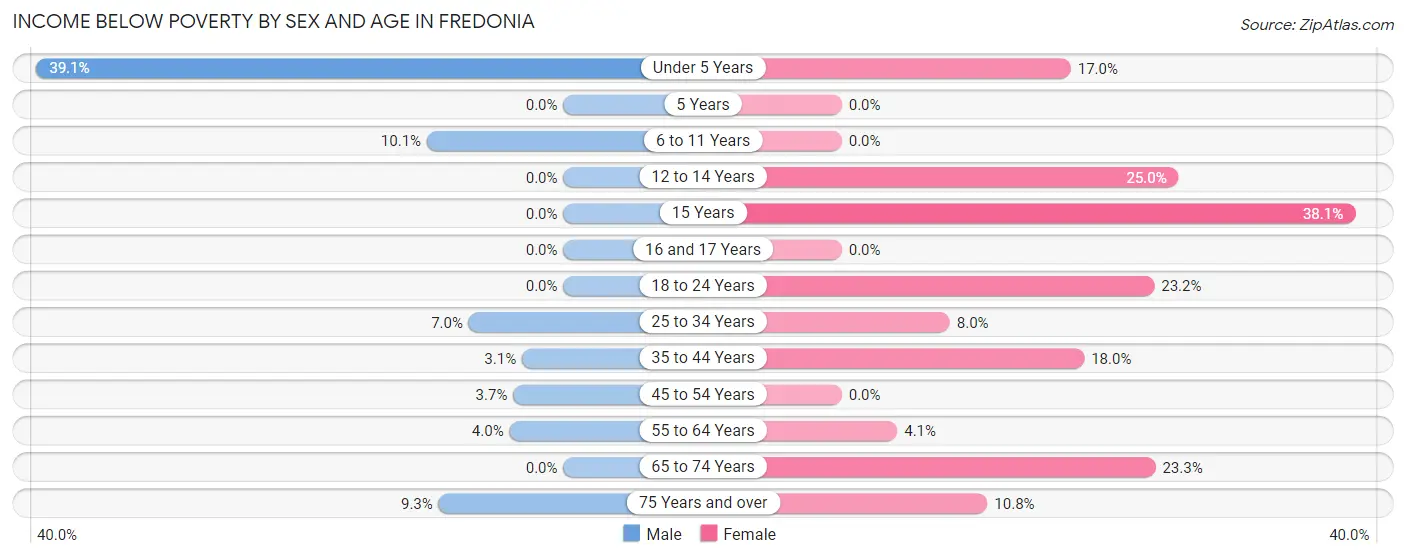
| Age Bracket | Male | Female |
| Under 5 Years | 27 (39.1%) | 17 (17.0%) |
| 5 Years | 0 (0.0%) | 0 (0.0%) |
| 6 to 11 Years | 8 (10.1%) | 0 (0.0%) |
| 12 to 14 Years | 0 (0.0%) | 7 (25.0%) |
| 15 Years | 0 (0.0%) | 8 (38.1%) |
| 16 and 17 Years | 0 (0.0%) | 0 (0.0%) |
| 18 to 24 Years | 0 (0.0%) | 29 (23.2%) |
| 25 to 34 Years | 12 (7.0%) | 13 (8.0%) |
| 35 to 44 Years | 5 (3.1%) | 27 (18.0%) |
| 45 to 54 Years | 7 (3.7%) | 0 (0.0%) |
| 55 to 64 Years | 6 (4.0%) | 7 (4.1%) |
| 65 to 74 Years | 0 (0.0%) | 17 (23.3%) |
| 75 Years and over | 5 (9.3%) | 4 (10.8%) |
| Total | 70 (5.7%) | 129 (10.6%) |
Income Above Poverty by Sex and Age in Fredonia
According to the poverty statistics in Fredonia, males aged 5 years and females aged 5 years are the age groups that are most secure financially, with 100.0% of males and 100.0% of females in these age groups living above the poverty line.
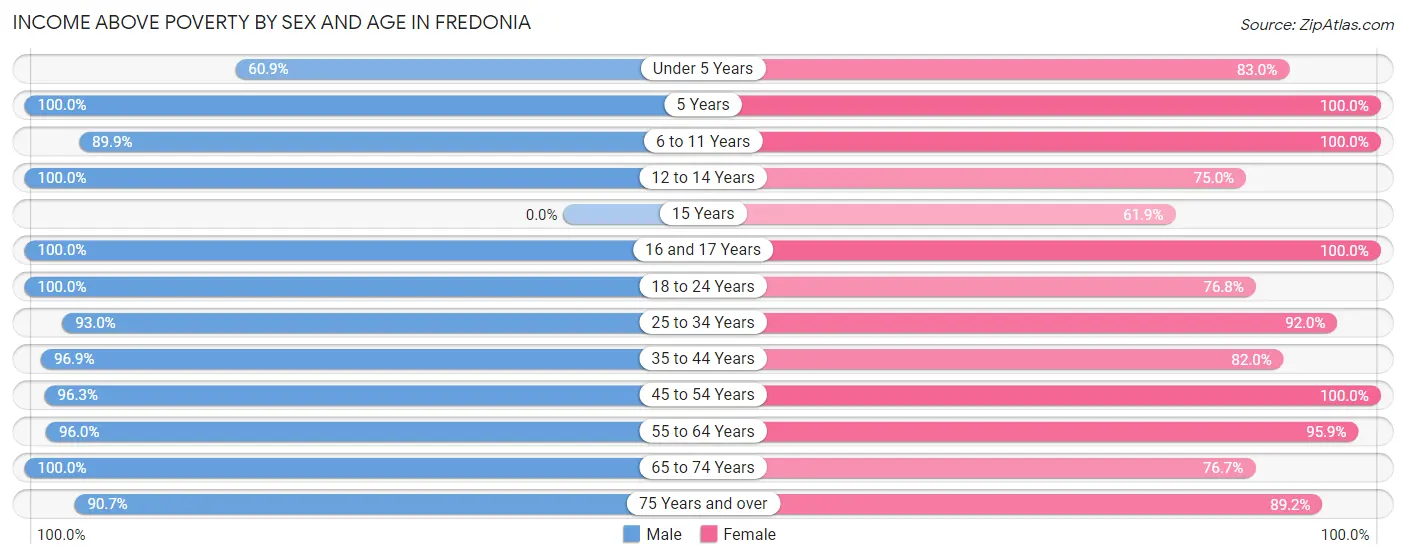
| Age Bracket | Male | Female |
| Under 5 Years | 42 (60.9%) | 83 (83.0%) |
| 5 Years | 9 (100.0%) | 28 (100.0%) |
| 6 to 11 Years | 71 (89.9%) | 76 (100.0%) |
| 12 to 14 Years | 65 (100.0%) | 21 (75.0%) |
| 15 Years | 0 (0.0%) | 13 (61.9%) |
| 16 and 17 Years | 10 (100.0%) | 61 (100.0%) |
| 18 to 24 Years | 175 (100.0%) | 96 (76.8%) |
| 25 to 34 Years | 159 (93.0%) | 149 (92.0%) |
| 35 to 44 Years | 158 (96.9%) | 123 (82.0%) |
| 45 to 54 Years | 181 (96.3%) | 188 (100.0%) |
| 55 to 64 Years | 144 (96.0%) | 163 (95.9%) |
| 65 to 74 Years | 94 (100.0%) | 56 (76.7%) |
| 75 Years and over | 49 (90.7%) | 33 (89.2%) |
| Total | 1,157 (94.3%) | 1,090 (89.4%) |
Income Below Poverty Among Married-Couple Families in Fredonia
The poverty statistics for married-couple families in Fredonia show that 5.9% or 31 of the total 528 families live below the poverty line. Families with 1 or 2 children have the highest poverty rate of 13.4%, comprising of 28 families. On the other hand, families with 3 or 4 children have the lowest poverty rate of 0.0%, which includes 0 families.
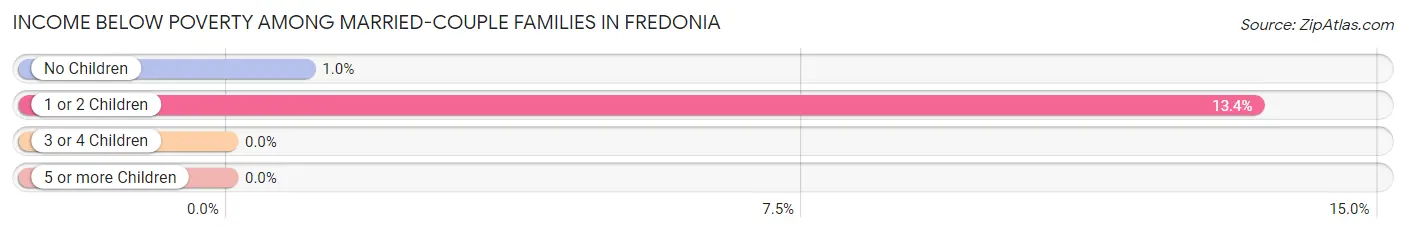
| Children | Above Poverty | Below Poverty |
| No Children | 294 (99.0%) | 3 (1.0%) |
| 1 or 2 Children | 181 (86.6%) | 28 (13.4%) |
| 3 or 4 Children | 22 (100.0%) | 0 (0.0%) |
| 5 or more Children | 0 (0.0%) | 0 (0.0%) |
| Total | 497 (94.1%) | 31 (5.9%) |
Income Below Poverty Among Single-Parent Households in Fredonia
According to the poverty data in Fredonia, 14.7% or 5 single-father households and 11.4% or 8 single-mother households are living below the poverty line. Among single-father households, those with no children have the highest poverty rate, with 5 households (20.8%) experiencing poverty. Likewise, among single-mother households, those with 5 or more children have the highest poverty rate, with 8 households (100.0%) falling below the poverty line.
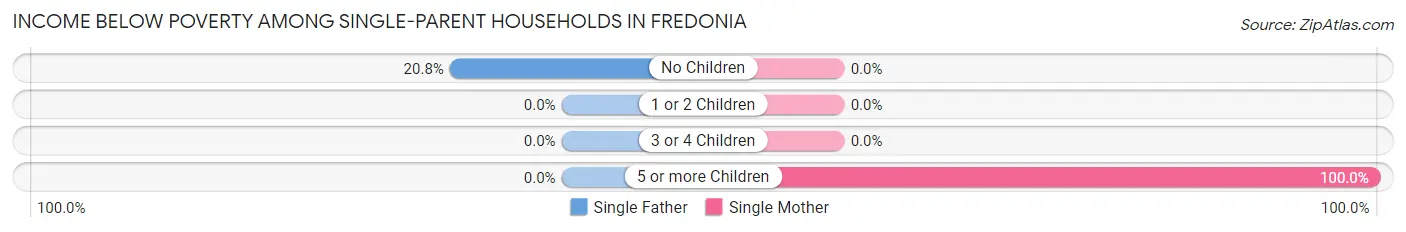
| Children | Single Father | Single Mother |
| No Children | 5 (20.8%) | 0 (0.0%) |
| 1 or 2 Children | 0 (0.0%) | 0 (0.0%) |
| 3 or 4 Children | 0 (0.0%) | 0 (0.0%) |
| 5 or more Children | 0 (0.0%) | 8 (100.0%) |
| Total | 5 (14.7%) | 8 (11.4%) |
Income Below Poverty Among Married-Couple vs Single-Parent Households in Fredonia
The poverty data for Fredonia shows that 31 of the married-couple family households (5.9%) and 13 of the single-parent households (12.5%) are living below the poverty level. Within the married-couple family households, those with 1 or 2 children have the highest poverty rate, with 28 households (13.4%) falling below the poverty line. Among the single-parent households, those with 5 or more children have the highest poverty rate, with 8 household (100.0%) living below poverty.
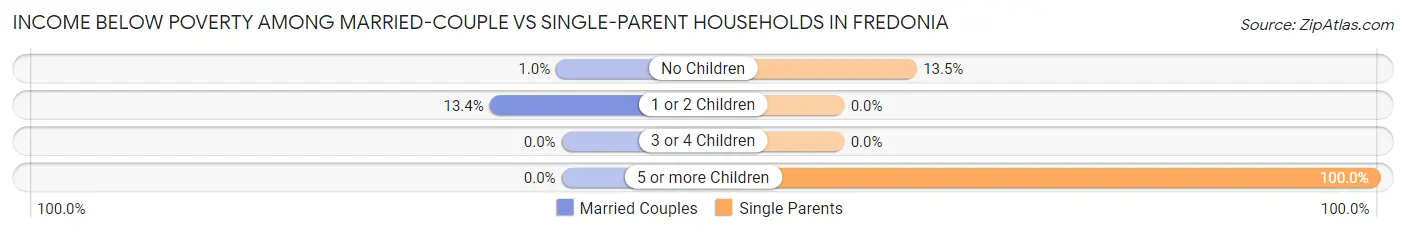
| Children | Married-Couple Families | Single-Parent Households |
| No Children | 3 (1.0%) | 5 (13.5%) |
| 1 or 2 Children | 28 (13.4%) | 0 (0.0%) |
| 3 or 4 Children | 0 (0.0%) | 0 (0.0%) |
| 5 or more Children | 0 (0.0%) | 8 (100.0%) |
| Total | 31 (5.9%) | 13 (12.5%) |
Race in Fredonia
The most populous races in Fredonia are White / Caucasian (2,084 | 85.2%), Two or more Races (214 | 8.7%), and Hispanic or Latino (211 | 8.6%).
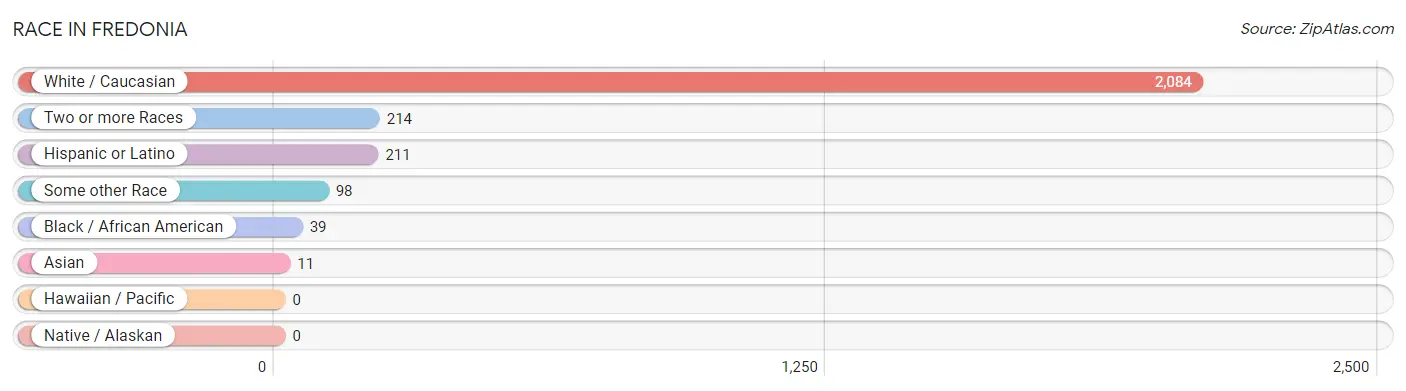
| Race | # Population | % Population |
| Asian | 11 | 0.4% |
| Black / African American | 39 | 1.6% |
| Hawaiian / Pacific | 0 | 0.0% |
| Hispanic or Latino | 211 | 8.6% |
| Native / Alaskan | 0 | 0.0% |
| White / Caucasian | 2,084 | 85.2% |
| Two or more Races | 214 | 8.7% |
| Some other Race | 98 | 4.0% |
| Total | 2,446 | 100.0% |
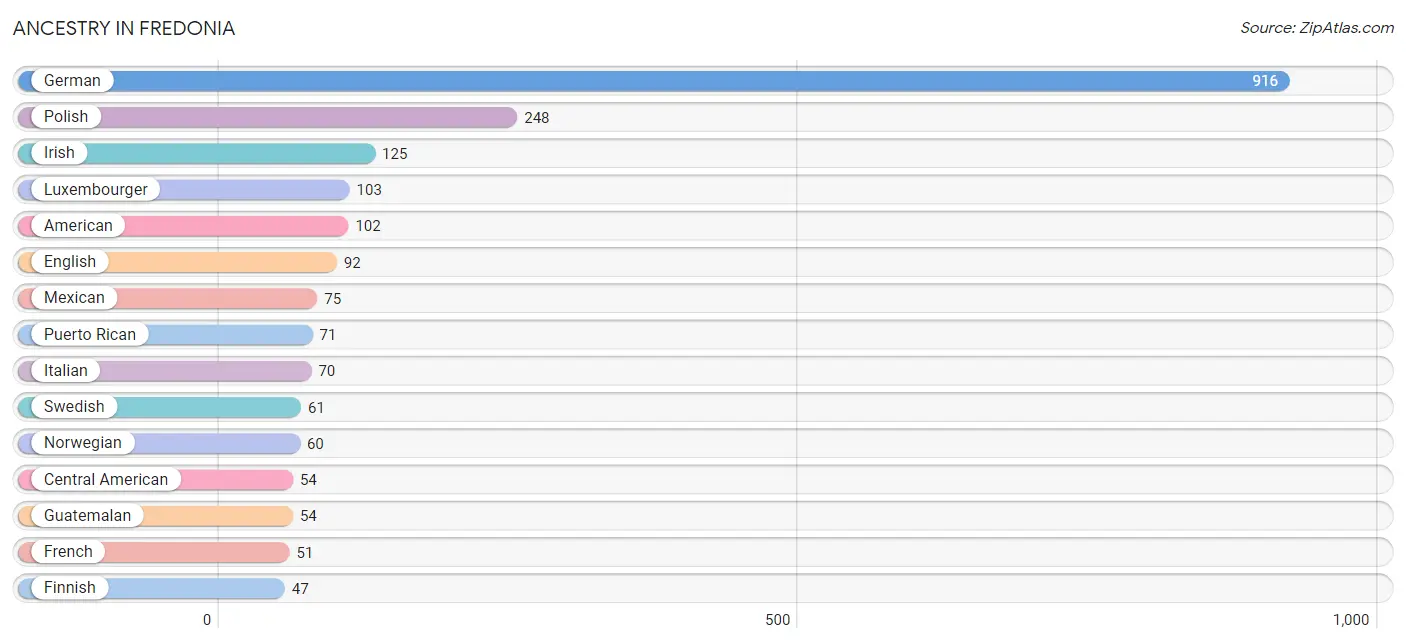
Ancestry in Fredonia
The most populous ancestries reported in Fredonia are German (916 | 37.4%), Polish (248 | 10.1%), Irish (125 | 5.1%), Luxembourger (103 | 4.2%), and American (102 | 4.2%), together accounting for 61.1% of all Fredonia residents.
| Ancestry | # Population | % Population |
| American | 102 | 4.2% |
| Austrian | 14 | 0.6% |
| Belgian | 11 | 0.4% |
| Bhutanese | 22 | 0.9% |
| Brazilian | 11 | 0.4% |
| British | 9 | 0.4% |
| Central American | 54 | 2.2% |
| Cherokee | 4 | 0.2% |
| Czech | 19 | 0.8% |
| Czechoslovakian | 5 | 0.2% |
| Danish | 6 | 0.3% |
| Dutch | 28 | 1.1% |
| Eastern European | 14 | 0.6% |
| English | 92 | 3.8% |
| European | 11 | 0.4% |
| Finnish | 47 | 1.9% |
| French | 51 | 2.1% |
| French American Indian | 14 | 0.6% |
| French Canadian | 18 | 0.7% |
| German | 916 | 37.4% |
| Greek | 8 | 0.3% |
| Guatemalan | 54 | 2.2% |
| Hungarian | 10 | 0.4% |
| Irish | 125 | 5.1% |
| Israeli | 5 | 0.2% |
| Italian | 70 | 2.9% |
| Lithuanian | 40 | 1.6% |
| Luxembourger | 103 | 4.2% |
| Mexican | 75 | 3.1% |
| Norwegian | 60 | 2.5% |
| Polish | 248 | 10.1% |
| Portuguese | 9 | 0.4% |
| Puerto Rican | 71 | 2.9% |
| Russian | 7 | 0.3% |
| Scandinavian | 5 | 0.2% |
| Scotch-Irish | 15 | 0.6% |
| Scottish | 29 | 1.2% |
| Slovak | 4 | 0.2% |
| Swedish | 61 | 2.5% |
| Thai | 7 | 0.3% | View All 40 Rows |
Immigrants in Fredonia
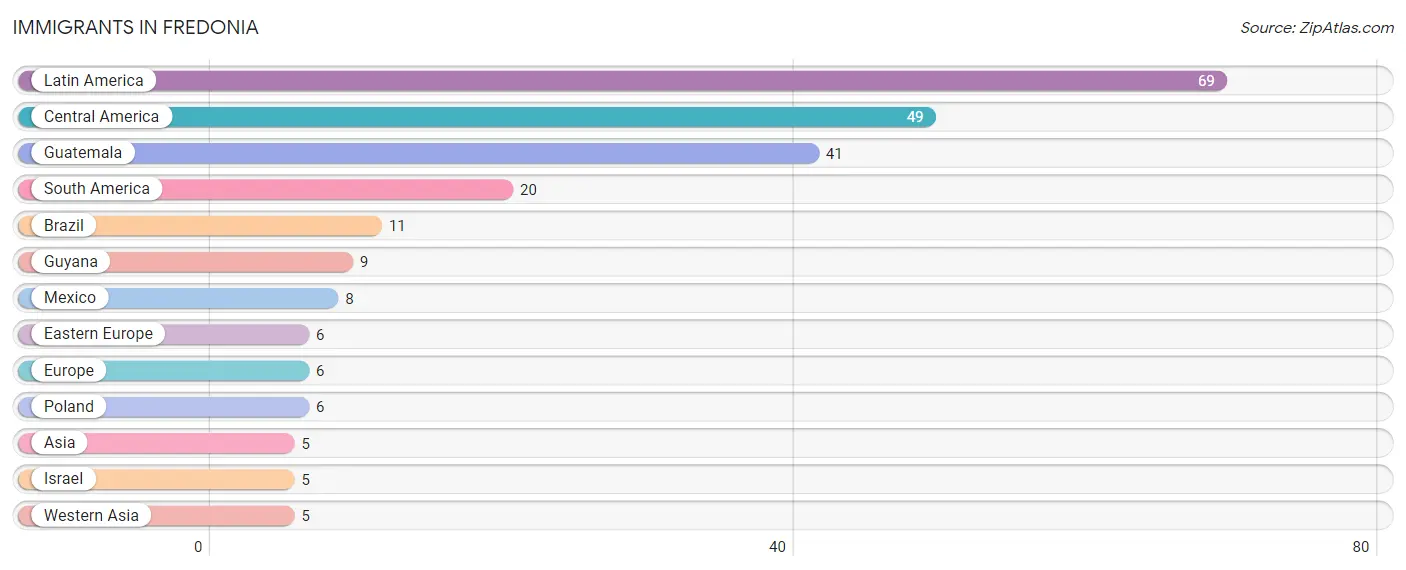
The most numerous immigrant groups reported in Fredonia came from Latin America (69 | 2.8%), Central America (49 | 2.0%), Guatemala (41 | 1.7%), South America (20 | 0.8%), and Brazil (11 | 0.4%), together accounting for 7.8% of all Fredonia residents.
| Immigration Origin | # Population | % Population |
| Asia | 5 | 0.2% |
| Brazil | 11 | 0.4% |
| Central America | 49 | 2.0% |
| Eastern Europe | 6 | 0.3% |
| Europe | 6 | 0.3% |
| Guatemala | 41 | 1.7% |
| Guyana | 9 | 0.4% |
| Israel | 5 | 0.2% |
| Latin America | 69 | 2.8% |
| Mexico | 8 | 0.3% |
| Poland | 6 | 0.3% |
| South America | 20 | 0.8% |
| Western Asia | 5 | 0.2% | View All 13 Rows |
Sex and Age in Fredonia
Sex and Age in Fredonia
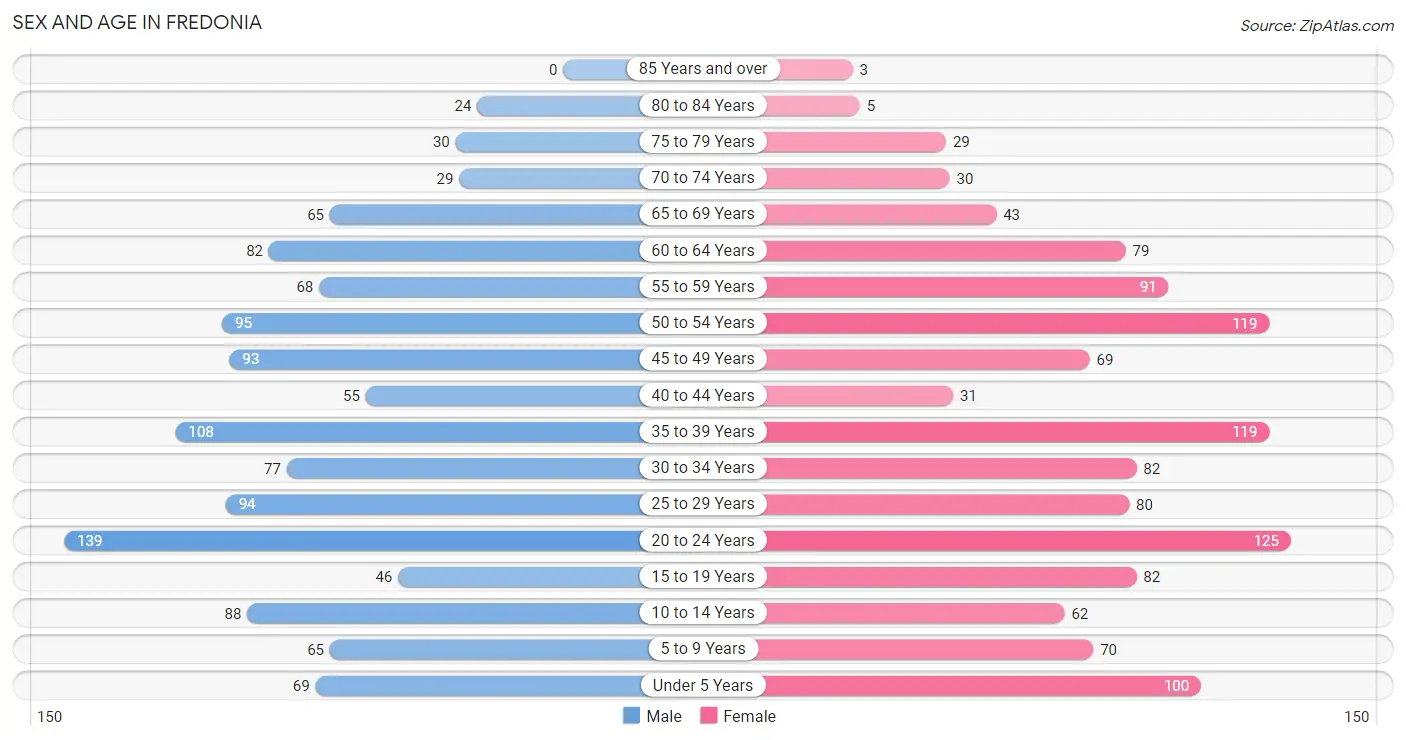
The most populous age groups in Fredonia are 20 to 24 Years (139 | 11.3%) for men and 20 to 24 Years (125 | 10.2%) for women.
| Age Bracket | Male | Female |
| Under 5 Years | 69 (5.6%) | 100 (8.2%) |
| 5 to 9 Years | 65 (5.3%) | 70 (5.7%) |
| 10 to 14 Years | 88 (7.2%) | 62 (5.1%) |
| 15 to 19 Years | 46 (3.7%) | 82 (6.7%) |
| 20 to 24 Years | 139 (11.3%) | 125 (10.2%) |
| 25 to 29 Years | 94 (7.7%) | 80 (6.6%) |
| 30 to 34 Years | 77 (6.3%) | 82 (6.7%) |
| 35 to 39 Years | 108 (8.8%) | 119 (9.8%) |
| 40 to 44 Years | 55 (4.5%) | 31 (2.5%) |
| 45 to 49 Years | 93 (7.6%) | 69 (5.7%) |
| 50 to 54 Years | 95 (7.7%) | 119 (9.8%) |
| 55 to 59 Years | 68 (5.5%) | 91 (7.5%) |
| 60 to 64 Years | 82 (6.7%) | 79 (6.5%) |
| 65 to 69 Years | 65 (5.3%) | 43 (3.5%) |
| 70 to 74 Years | 29 (2.4%) | 30 (2.5%) |
| 75 to 79 Years | 30 (2.4%) | 29 (2.4%) |
| 80 to 84 Years | 24 (2.0%) | 5 (0.4%) |
| 85 Years and over | 0 (0.0%) | 3 (0.3%) |
| Total | 1,227 (100.0%) | 1,219 (100.0%) |
Families and Households in Fredonia
Median Family Size in Fredonia
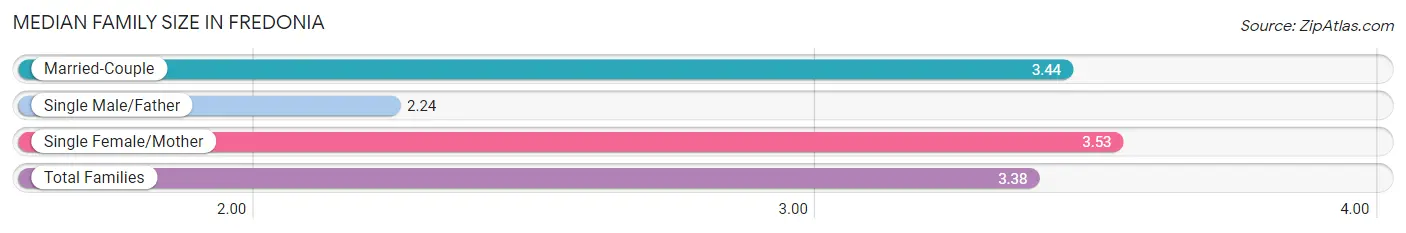
The median family size in Fredonia is 3.38 persons per family, with single female/mother families (70 | 11.1%) accounting for the largest median family size of 3.53 persons per family. On the other hand, single male/father families (34 | 5.4%) represent the smallest median family size with 2.24 persons per family.
| Family Type | # Families | Family Size |
| Married-Couple | 528 (83.5%) | 3.44 |
| Single Male/Father | 34 (5.4%) | 2.24 |
| Single Female/Mother | 70 (11.1%) | 3.53 |
| Total Families | 632 (100.0%) | 3.38 |
Median Household Size in Fredonia
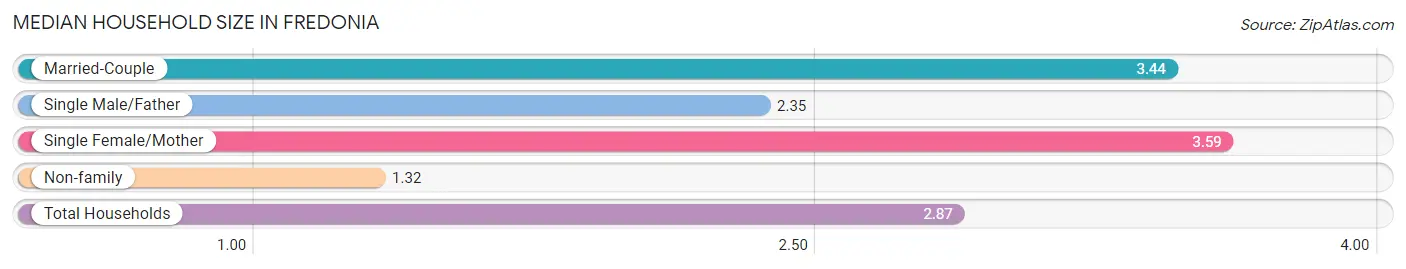
The median household size in Fredonia is 2.87 persons per household, with single female/mother households (70 | 8.3%) accounting for the largest median household size of 3.59 persons per household. non-family households (213 | 25.2%) represent the smallest median household size with 1.32 persons per household.
| Household Type | # Households | Household Size |
| Married-Couple | 528 (62.5%) | 3.44 |
| Single Male/Father | 34 (4.0%) | 2.35 |
| Single Female/Mother | 70 (8.3%) | 3.59 |
| Non-family | 213 (25.2%) | 1.32 |
| Total Households | 845 (100.0%) | 2.87 |
Household Size by Marriage Status in Fredonia
Out of a total of 845 households in Fredonia, 632 (74.8%) are family households, while 213 (25.2%) are nonfamily households. The most numerous type of family households are 2-person households, comprising 256, and the most common type of nonfamily households are 1-person households, comprising 146.
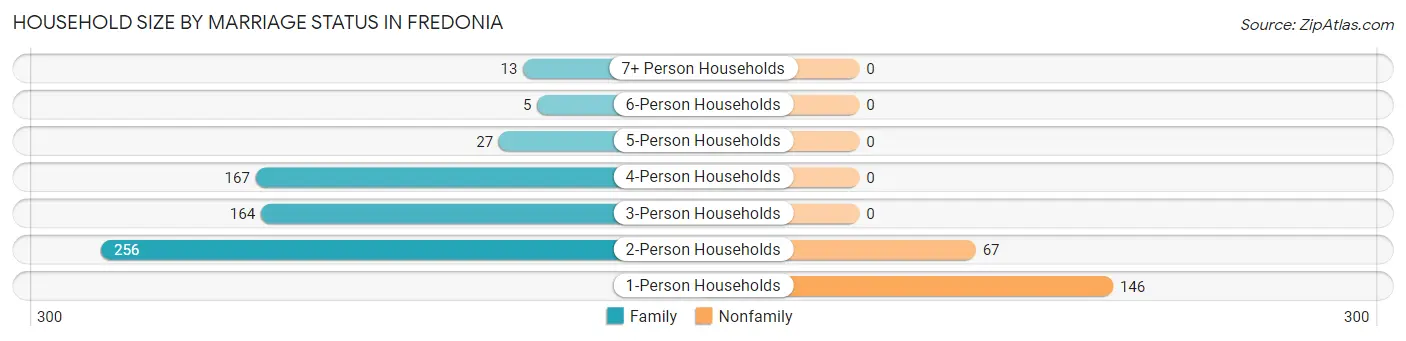
| Household Size | Family Households | Nonfamily Households |
| 1-Person Households | - | 146 (17.3%) |
| 2-Person Households | 256 (30.3%) | 67 (7.9%) |
| 3-Person Households | 164 (19.4%) | 0 (0.0%) |
| 4-Person Households | 167 (19.8%) | 0 (0.0%) |
| 5-Person Households | 27 (3.2%) | 0 (0.0%) |
| 6-Person Households | 5 (0.6%) | 0 (0.0%) |
| 7+ Person Households | 13 (1.5%) | 0 (0.0%) |
| Total | 632 (74.8%) | 213 (25.2%) |
Female Fertility in Fredonia
Fertility by Age in Fredonia
Average fertility rate in Fredonia is 38.0 births per 1,000 women. Women in the age bracket of 20 to 34 years have the highest fertility rate with 80.0 births per 1,000 women. Women in the age bracket of 20 to 34 years acount for 100.0% of all women with births.
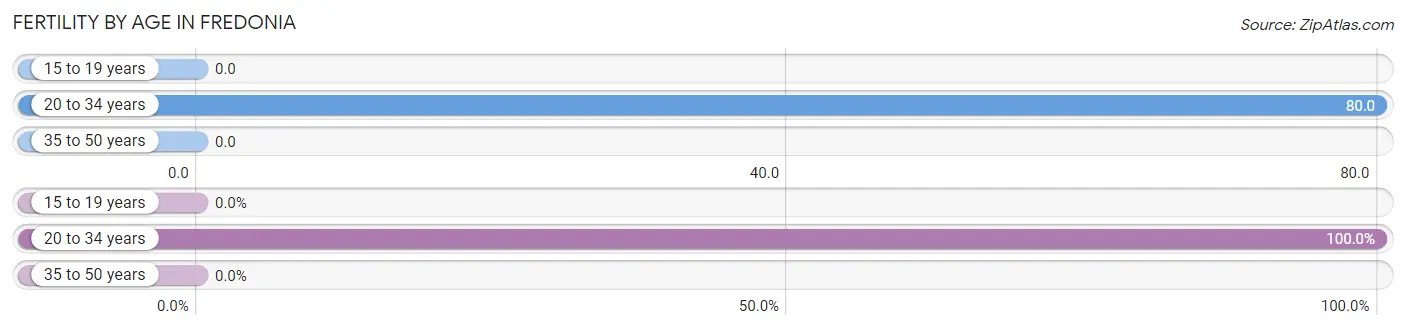
| Age Bracket | Women with Births | Births / 1,000 Women |
| 15 to 19 years | 0 (0.0%) | 0.0 |
| 20 to 34 years | 23 (100.0%) | 80.0 |
| 35 to 50 years | 0 (0.0%) | 0.0 |
| Total | 23 (100.0%) | 38.0 |
Fertility by Age by Marriage Status in Fredonia
65.2% of women with births (23) in Fredonia are married. The highest percentage of unmarried women with births falls into 20 to 34 years age bracket with 34.8% of them unmarried at the time of birth, while the lowest percentage of unmarried women with births belong to 20 to 34 years age bracket with 34.8% of them unmarried.
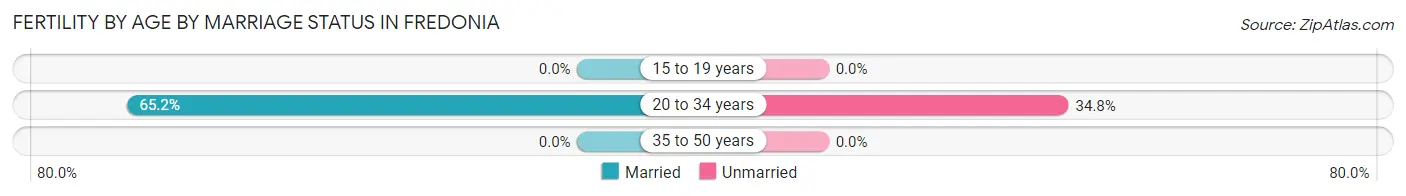
| Age Bracket | Married | Unmarried |
| 15 to 19 years | 0 (0.0%) | 0 (0.0%) |
| 20 to 34 years | 15 (65.2%) | 8 (34.8%) |
| 35 to 50 years | 0 (0.0%) | 0 (0.0%) |
| Total | 15 (65.2%) | 8 (34.8%) |
Fertility by Education in Fredonia
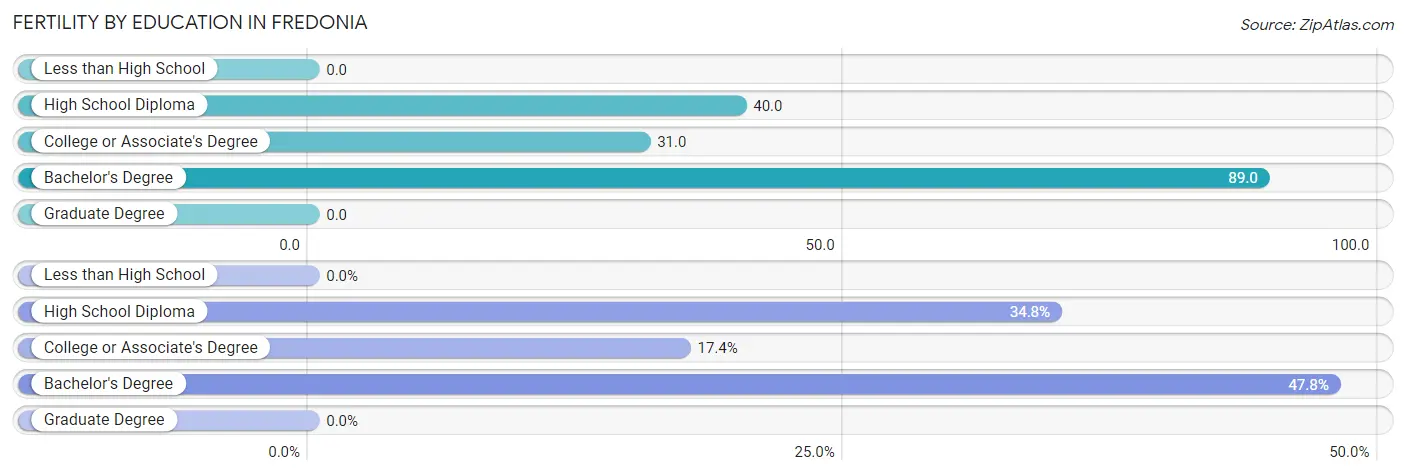
| Educational Attainment | Women with Births | Births / 1,000 Women |
| Less than High School | 0 (0.0%) | 0.0 |
| High School Diploma | 8 (34.8%) | 40.0 |
| College or Associate's Degree | 4 (17.4%) | 31.0 |
| Bachelor's Degree | 11 (47.8%) | 89.0 |
| Graduate Degree | 0 (0.0%) | 0.0 |
| Total | 23 (100.0%) | 38.0 |
Fertility by Education by Marriage Status in Fredonia
34.8% of women with births in Fredonia are unmarried. Women with the educational attainment of college or associate's degree are most likely to be married with 100.0% of them married at childbirth, while women with the educational attainment of high school diploma are least likely to be married with 100.0% of them unmarried at childbirth.
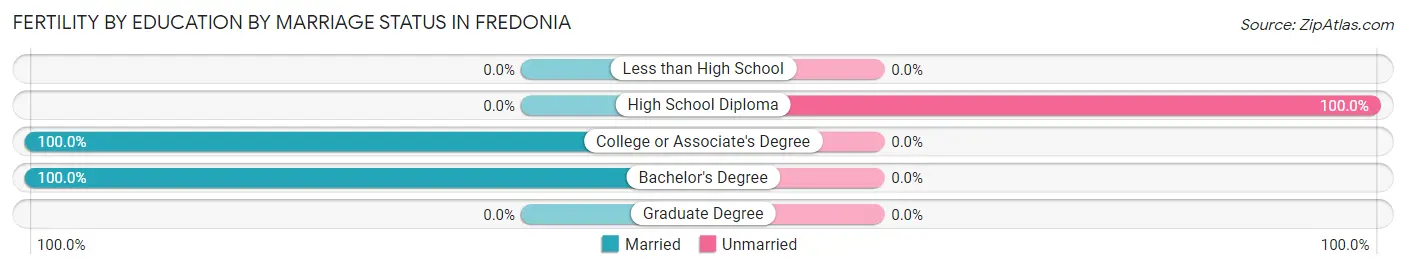
| Educational Attainment | Married | Unmarried |
| Less than High School | 0 (0.0%) | 0 (0.0%) |
| High School Diploma | 0 (0.0%) | 8 (100.0%) |
| College or Associate's Degree | 4 (100.0%) | 0 (0.0%) |
| Bachelor's Degree | 11 (100.0%) | 0 (0.0%) |
| Graduate Degree | 0 (0.0%) | 0 (0.0%) |
| Total | 15 (65.2%) | 8 (34.8%) |
Employment Characteristics in Fredonia
Employment by Class of Employer in Fredonia
Among the 1,433 employed individuals in Fredonia, private company employees (1,199 | 83.7%), self-employed (not incorporated) (70 | 4.9%), and not-for-profit organizations (64 | 4.5%) make up the most common classes of employment.
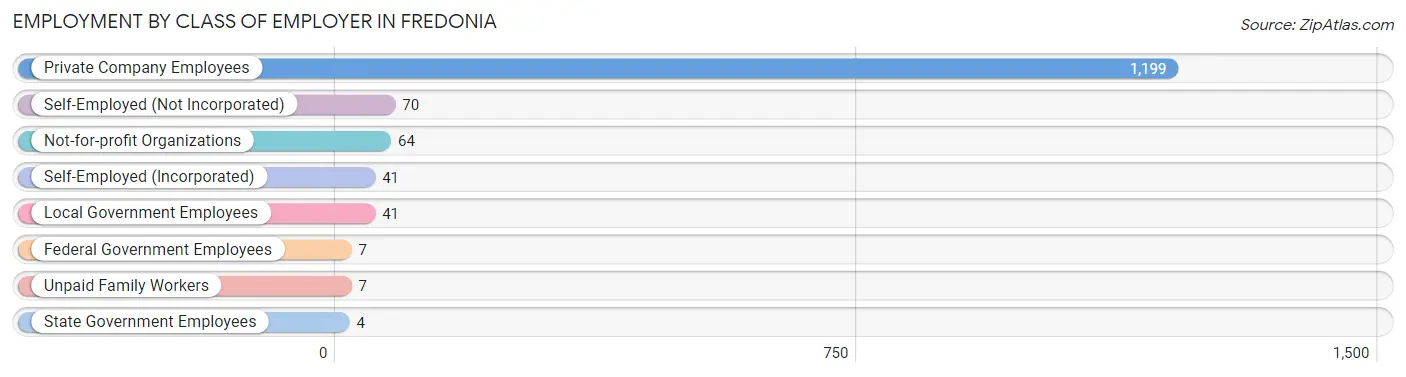
| Employer Class | # Employees | % Employees |
| Private Company Employees | 1,199 | 83.7% |
| Self-Employed (Incorporated) | 41 | 2.9% |
| Self-Employed (Not Incorporated) | 70 | 4.9% |
| Not-for-profit Organizations | 64 | 4.5% |
| Local Government Employees | 41 | 2.9% |
| State Government Employees | 4 | 0.3% |
| Federal Government Employees | 7 | 0.5% |
| Unpaid Family Workers | 7 | 0.5% |
| Total | 1,433 | 100.0% |
Employment Status by Age in Fredonia
According to the labor force statistics for Fredonia, out of the total population over 16 years of age (1,971), 76.0% or 1,498 individuals are in the labor force, with 4.0% or 60 of them unemployed. The age group with the highest labor force participation rate is 20 to 24 years, with 97.7% or 258 individuals in the labor force. Within the labor force, the 20 to 24 years age range has the highest percentage of unemployed individuals, with 21.3% or 55 of them being unemployed.
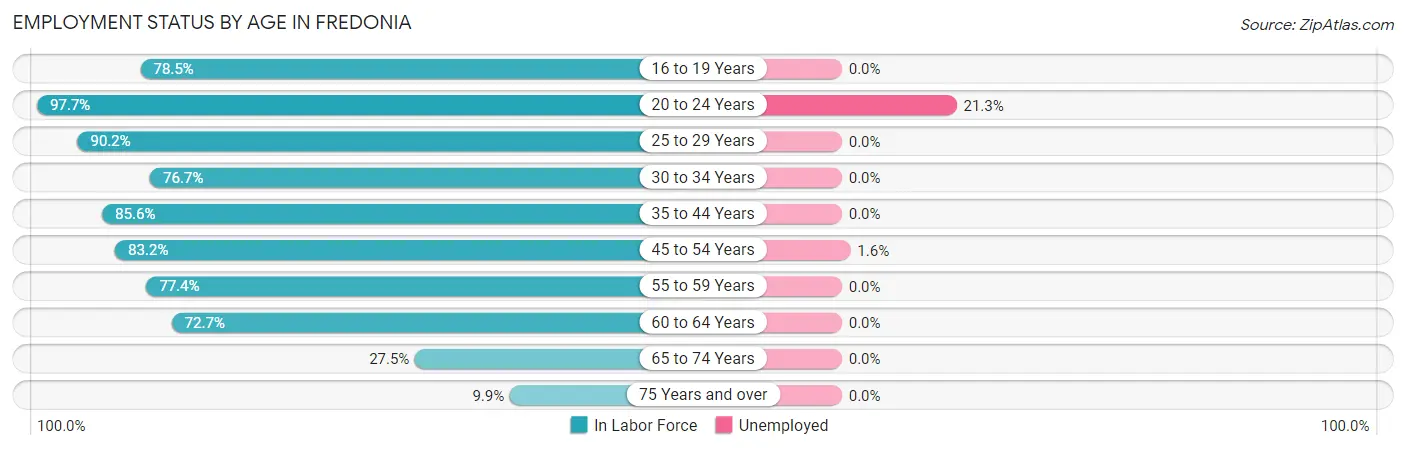
| Age Bracket | In Labor Force | Unemployed |
| 16 to 19 Years | 84 (78.5%) | 0 (0.0%) |
| 20 to 24 Years | 258 (97.7%) | 55 (21.3%) |
| 25 to 29 Years | 157 (90.2%) | 0 (0.0%) |
| 30 to 34 Years | 122 (76.7%) | 0 (0.0%) |
| 35 to 44 Years | 268 (85.6%) | 0 (0.0%) |
| 45 to 54 Years | 313 (83.2%) | 5 (1.6%) |
| 55 to 59 Years | 123 (77.4%) | 0 (0.0%) |
| 60 to 64 Years | 117 (72.7%) | 0 (0.0%) |
| 65 to 74 Years | 46 (27.5%) | 0 (0.0%) |
| 75 Years and over | 9 (9.9%) | 0 (0.0%) |
| Total | 1,498 (76.0%) | 60 (4.0%) |
Employment Status by Educational Attainment in Fredonia
According to labor force statistics for Fredonia, 82.0% of individuals (1,100) out of the total population between 25 and 64 years of age (1,342) are in the labor force, with 0.5% or 6 of them being unemployed. The group with the highest labor force participation rate are those with the educational attainment of bachelor's degree or higher, with 94.2% or 326 individuals in the labor force. Within the labor force, individuals with college / associate degree education have the highest percentage of unemployment, with 1.5% or 5 of them being unemployed.
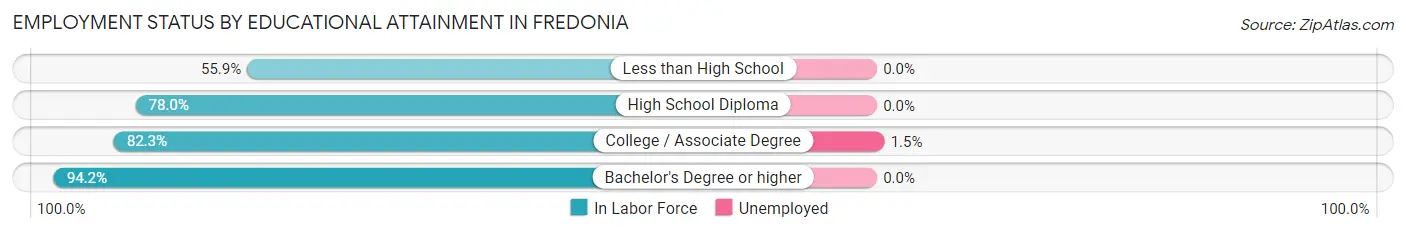
| Educational Attainment | In Labor Force | Unemployed |
| Less than High School | 52 (55.9%) | 0 (0.0%) |
| High School Diploma | 379 (78.0%) | 0 (0.0%) |
| College / Associate Degree | 343 (82.3%) | 6 (1.5%) |
| Bachelor's Degree or higher | 326 (94.2%) | 0 (0.0%) |
| Total | 1,100 (82.0%) | 7 (0.5%) |
Employment Occupations by Sex in Fredonia
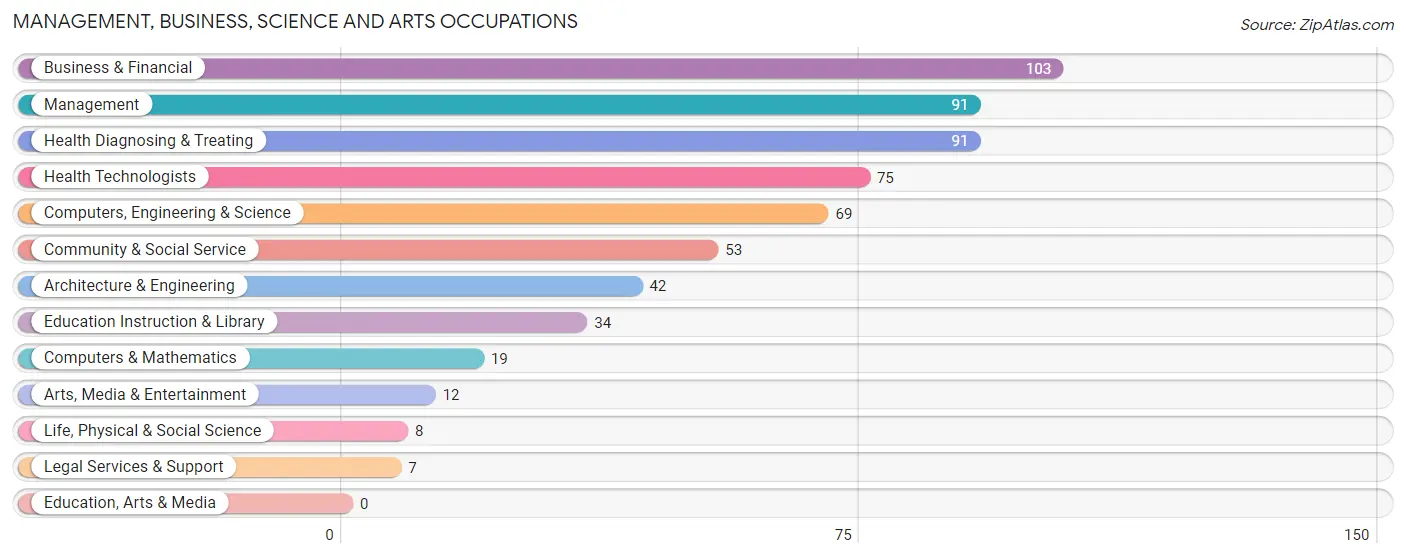
Management, Business, Science and Arts Occupations
The most common Management, Business, Science and Arts occupations in Fredonia are Business & Financial (103 | 7.2%), Management (91 | 6.3%), Health Diagnosing & Treating (91 | 6.3%), Health Technologists (75 | 5.2%), and Computers, Engineering & Science (69 | 4.8%).
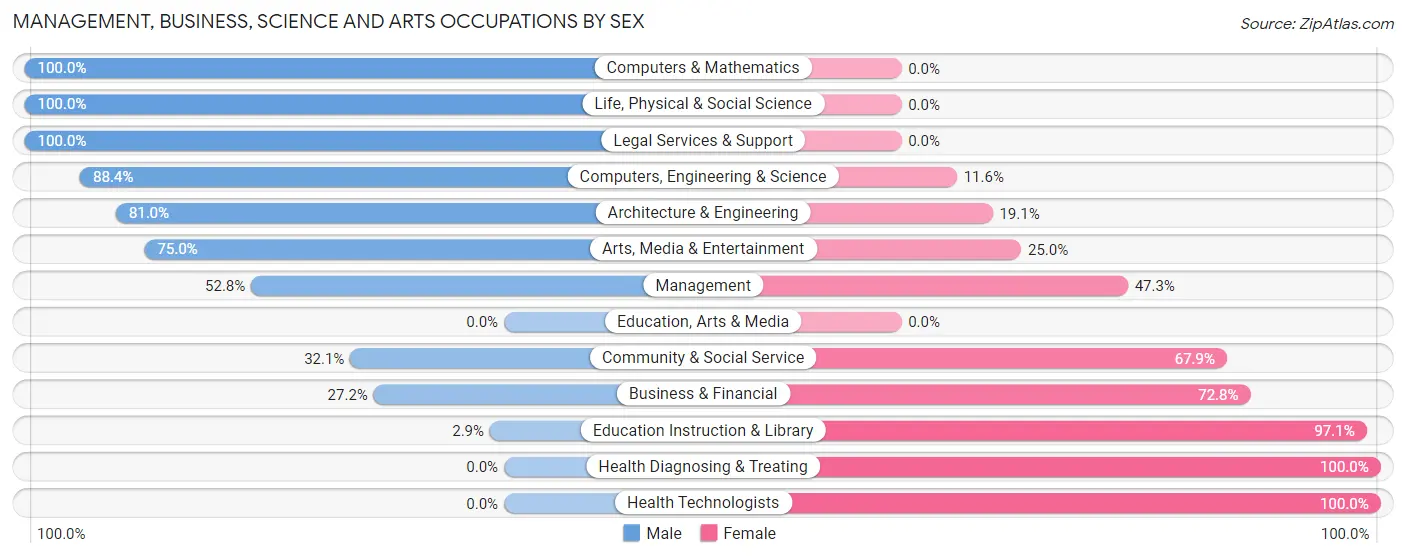
Management, Business, Science and Arts Occupations by Sex
Within the Management, Business, Science and Arts occupations in Fredonia, the most male-oriented occupations are Computers & Mathematics (100.0%), Life, Physical & Social Science (100.0%), and Legal Services & Support (100.0%), while the most female-oriented occupations are Health Diagnosing & Treating (100.0%), Health Technologists (100.0%), and Education Instruction & Library (97.1%).
| Occupation | Male | Female |
| Management | 48 (52.7%) | 43 (47.2%) |
| Business & Financial | 28 (27.2%) | 75 (72.8%) |
| Computers, Engineering & Science | 61 (88.4%) | 8 (11.6%) |
| Computers & Mathematics | 19 (100.0%) | 0 (0.0%) |
| Architecture & Engineering | 34 (80.9%) | 8 (19.1%) |
| Life, Physical & Social Science | 8 (100.0%) | 0 (0.0%) |
| Community & Social Service | 17 (32.1%) | 36 (67.9%) |
| Education, Arts & Media | 0 (0.0%) | 0 (0.0%) |
| Legal Services & Support | 7 (100.0%) | 0 (0.0%) |
| Education Instruction & Library | 1 (2.9%) | 33 (97.1%) |
| Arts, Media & Entertainment | 9 (75.0%) | 3 (25.0%) |
| Health Diagnosing & Treating | 0 (0.0%) | 91 (100.0%) |
| Health Technologists | 0 (0.0%) | 75 (100.0%) |
| Total (Category) | 154 (37.8%) | 253 (62.2%) |
| Total (Overall) | 733 (51.0%) | 704 (49.0%) |
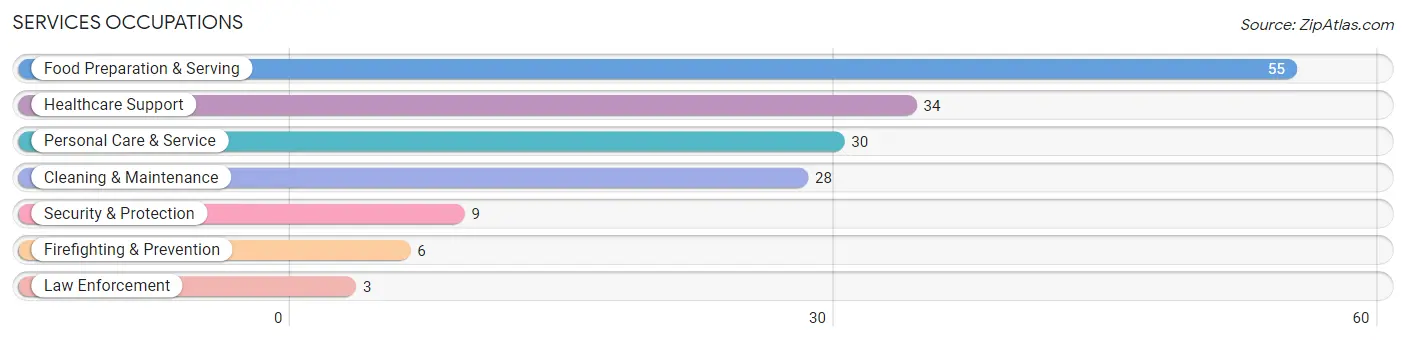
Services Occupations
The most common Services occupations in Fredonia are Food Preparation & Serving (55 | 3.8%), Healthcare Support (34 | 2.4%), Personal Care & Service (30 | 2.1%), Cleaning & Maintenance (28 | 1.9%), and Security & Protection (9 | 0.6%).
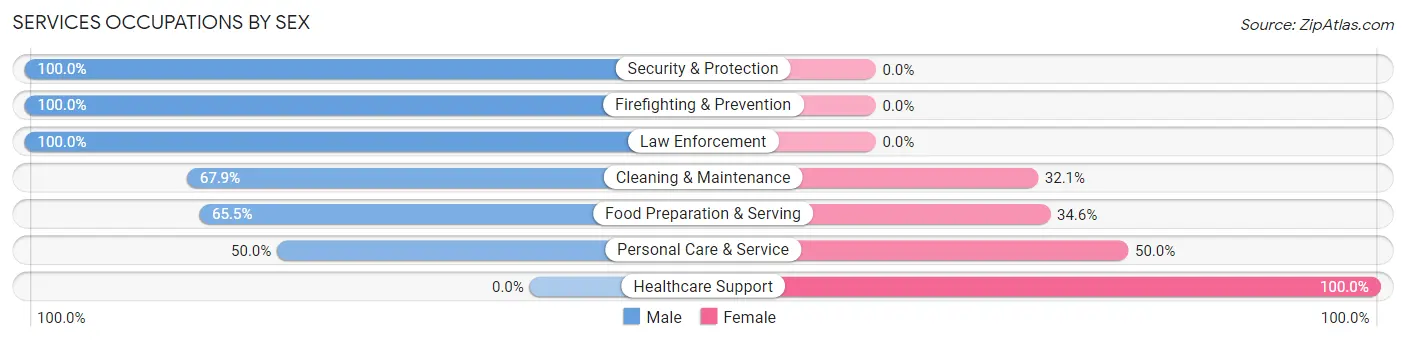
Services Occupations by Sex
Within the Services occupations in Fredonia, the most male-oriented occupations are Security & Protection (100.0%), Firefighting & Prevention (100.0%), and Law Enforcement (100.0%), while the most female-oriented occupations are Healthcare Support (100.0%), Personal Care & Service (50.0%), and Food Preparation & Serving (34.5%).
| Occupation | Male | Female |
| Healthcare Support | 0 (0.0%) | 34 (100.0%) |
| Security & Protection | 9 (100.0%) | 0 (0.0%) |
| Firefighting & Prevention | 6 (100.0%) | 0 (0.0%) |
| Law Enforcement | 3 (100.0%) | 0 (0.0%) |
| Food Preparation & Serving | 36 (65.4%) | 19 (34.5%) |
| Cleaning & Maintenance | 19 (67.9%) | 9 (32.1%) |
| Personal Care & Service | 15 (50.0%) | 15 (50.0%) |
| Total (Category) | 79 (50.6%) | 77 (49.4%) |
| Total (Overall) | 733 (51.0%) | 704 (49.0%) |
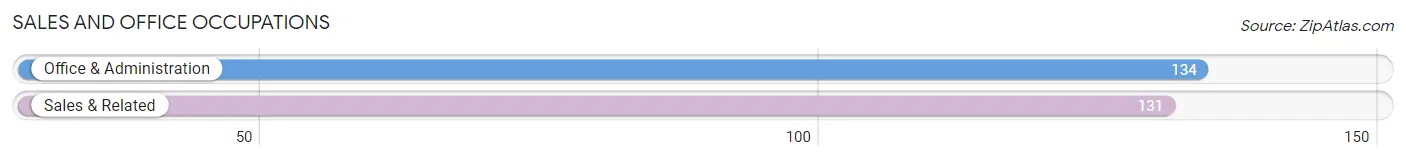
Sales and Office Occupations
The most common Sales and Office occupations in Fredonia are Office & Administration (134 | 9.3%), and Sales & Related (131 | 9.1%).
Sales and Office Occupations by Sex
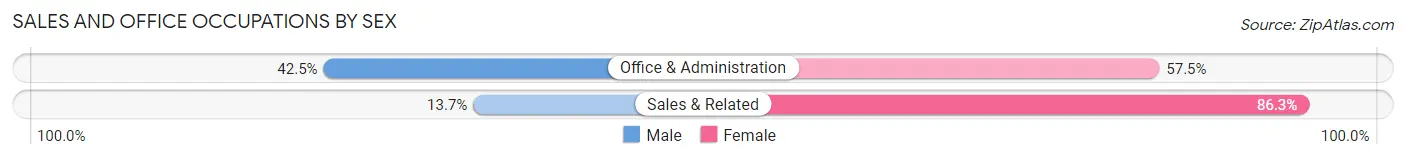
| Occupation | Male | Female |
| Sales & Related | 18 (13.7%) | 113 (86.3%) |
| Office & Administration | 57 (42.5%) | 77 (57.5%) |
| Total (Category) | 75 (28.3%) | 190 (71.7%) |
| Total (Overall) | 733 (51.0%) | 704 (49.0%) |
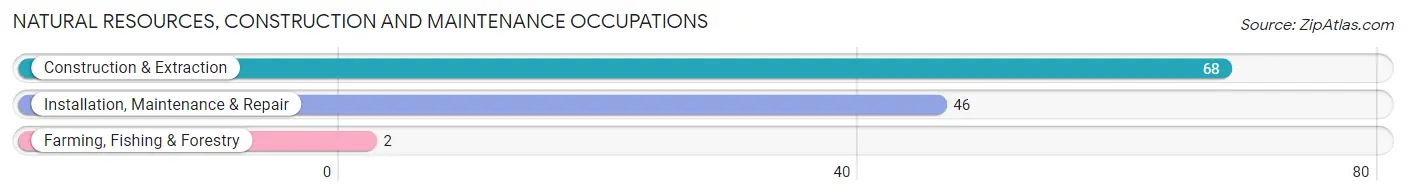
Natural Resources, Construction and Maintenance Occupations
The most common Natural Resources, Construction and Maintenance occupations in Fredonia are Construction & Extraction (68 | 4.7%), Installation, Maintenance & Repair (46 | 3.2%), and Farming, Fishing & Forestry (2 | 0.1%).
Natural Resources, Construction and Maintenance Occupations by Sex
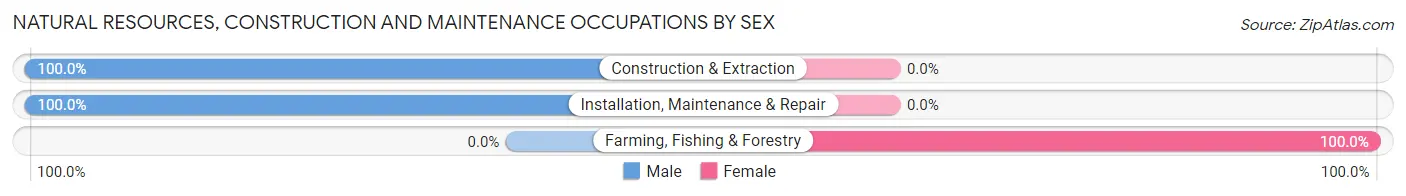
| Occupation | Male | Female |
| Farming, Fishing & Forestry | 0 (0.0%) | 2 (100.0%) |
| Construction & Extraction | 68 (100.0%) | 0 (0.0%) |
| Installation, Maintenance & Repair | 46 (100.0%) | 0 (0.0%) |
| Total (Category) | 114 (98.3%) | 2 (1.7%) |
| Total (Overall) | 733 (51.0%) | 704 (49.0%) |
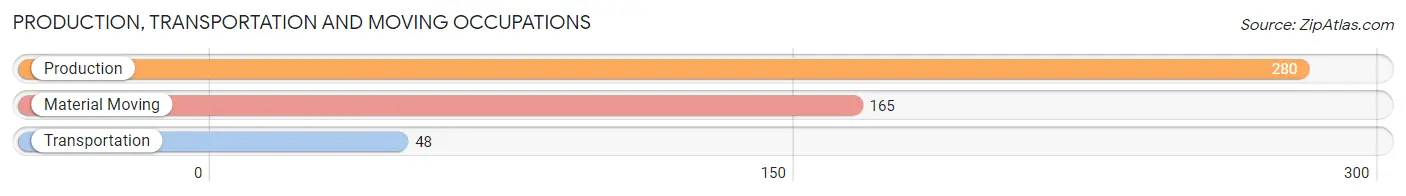
Production, Transportation and Moving Occupations
The most common Production, Transportation and Moving occupations in Fredonia are Production (280 | 19.5%), Material Moving (165 | 11.5%), and Transportation (48 | 3.3%).
Production, Transportation and Moving Occupations by Sex
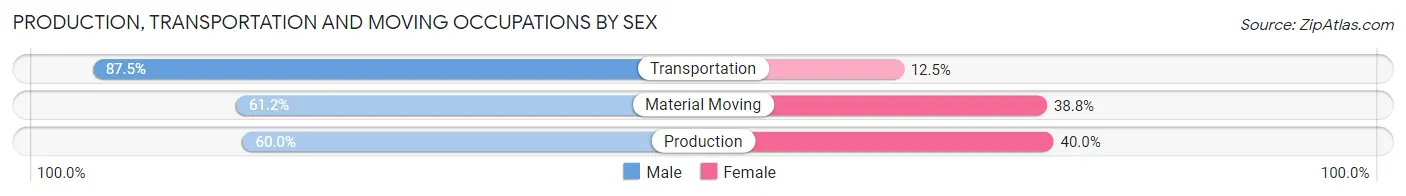
| Occupation | Male | Female |
| Production | 168 (60.0%) | 112 (40.0%) |
| Transportation | 42 (87.5%) | 6 (12.5%) |
| Material Moving | 101 (61.2%) | 64 (38.8%) |
| Total (Category) | 311 (63.1%) | 182 (36.9%) |
| Total (Overall) | 733 (51.0%) | 704 (49.0%) |
Employment Industries by Sex in Fredonia
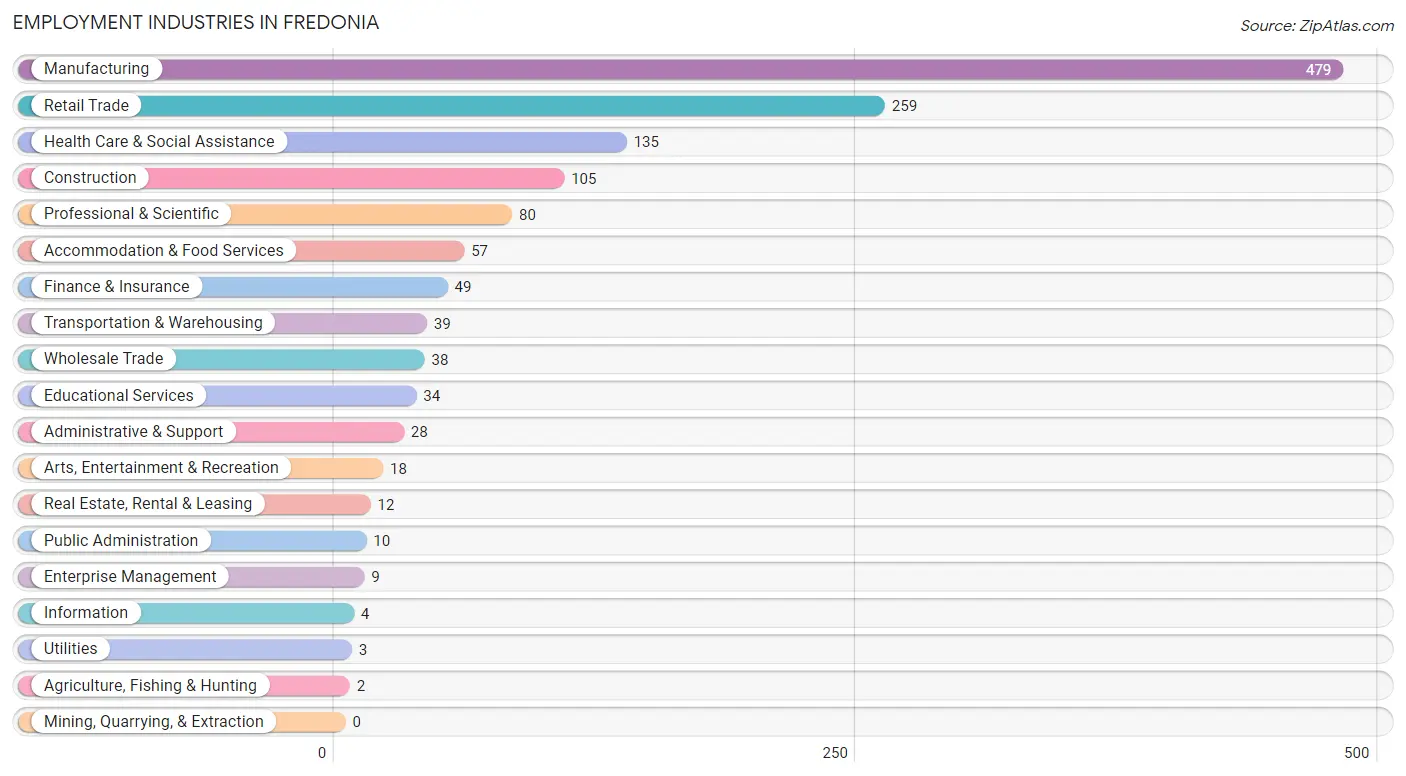
Employment Industries in Fredonia
The major employment industries in Fredonia include Manufacturing (479 | 33.3%), Retail Trade (259 | 18.0%), Health Care & Social Assistance (135 | 9.4%), Construction (105 | 7.3%), and Professional & Scientific (80 | 5.6%).
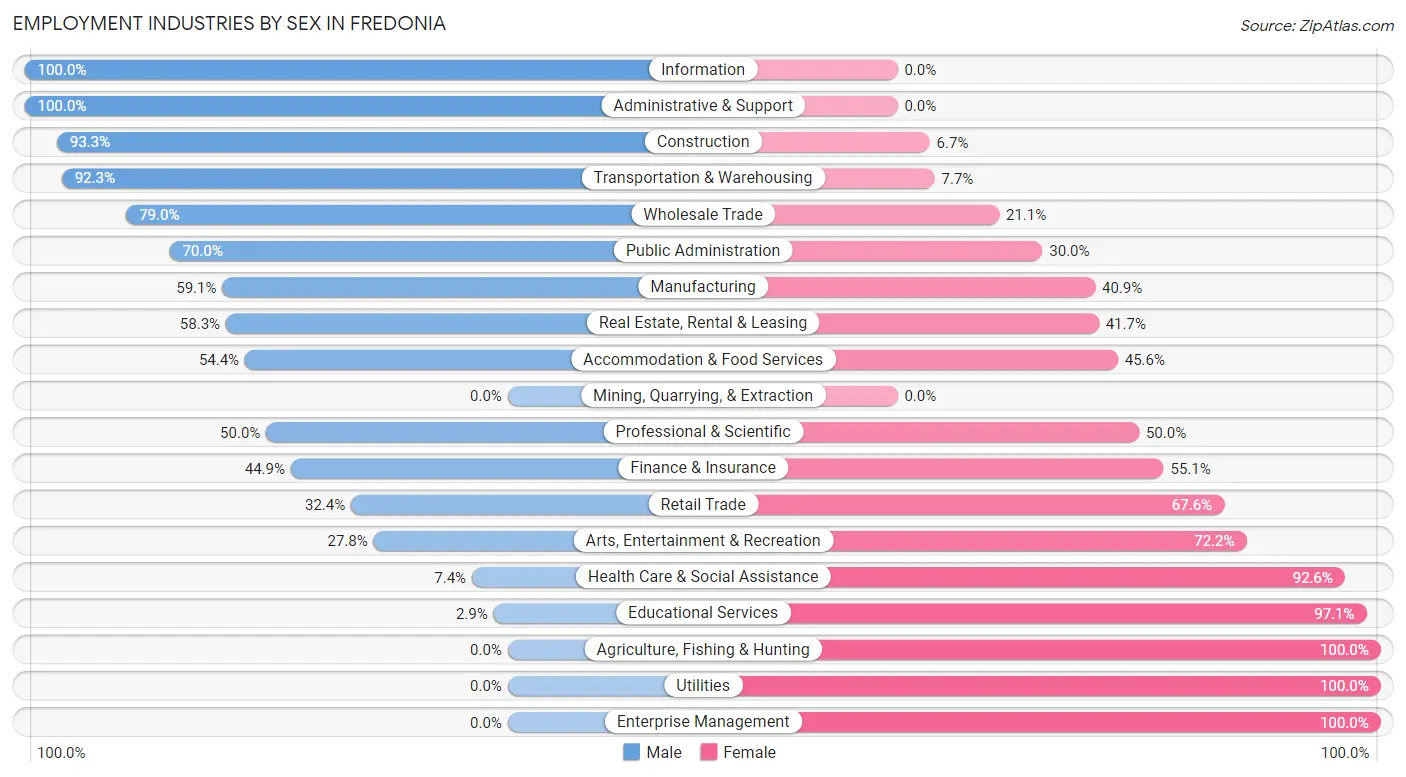
Employment Industries by Sex in Fredonia
The Fredonia industries that see more men than women are Information (100.0%), Administrative & Support (100.0%), and Construction (93.3%), whereas the industries that tend to have a higher number of women are Agriculture, Fishing & Hunting (100.0%), Utilities (100.0%), and Enterprise Management (100.0%).
| Industry | Male | Female |
| Agriculture, Fishing & Hunting | 0 (0.0%) | 2 (100.0%) |
| Mining, Quarrying, & Extraction | 0 (0.0%) | 0 (0.0%) |
| Construction | 98 (93.3%) | 7 (6.7%) |
| Manufacturing | 283 (59.1%) | 196 (40.9%) |
| Wholesale Trade | 30 (78.9%) | 8 (21.0%) |
| Retail Trade | 84 (32.4%) | 175 (67.6%) |
| Transportation & Warehousing | 36 (92.3%) | 3 (7.7%) |
| Utilities | 0 (0.0%) | 3 (100.0%) |
| Information | 4 (100.0%) | 0 (0.0%) |
| Finance & Insurance | 22 (44.9%) | 27 (55.1%) |
| Real Estate, Rental & Leasing | 7 (58.3%) | 5 (41.7%) |
| Professional & Scientific | 40 (50.0%) | 40 (50.0%) |
| Enterprise Management | 0 (0.0%) | 9 (100.0%) |
| Administrative & Support | 28 (100.0%) | 0 (0.0%) |
| Educational Services | 1 (2.9%) | 33 (97.1%) |
| Health Care & Social Assistance | 10 (7.4%) | 125 (92.6%) |
| Arts, Entertainment & Recreation | 5 (27.8%) | 13 (72.2%) |
| Accommodation & Food Services | 31 (54.4%) | 26 (45.6%) |
| Public Administration | 7 (70.0%) | 3 (30.0%) |
| Total | 733 (51.0%) | 704 (49.0%) |
Education in Fredonia
School Enrollment in Fredonia
The most common levels of schooling among the 599 students in Fredonia are college / undergraduate (164 | 27.4%), high school (144 | 24.0%), and middle school (120 | 20.0%).
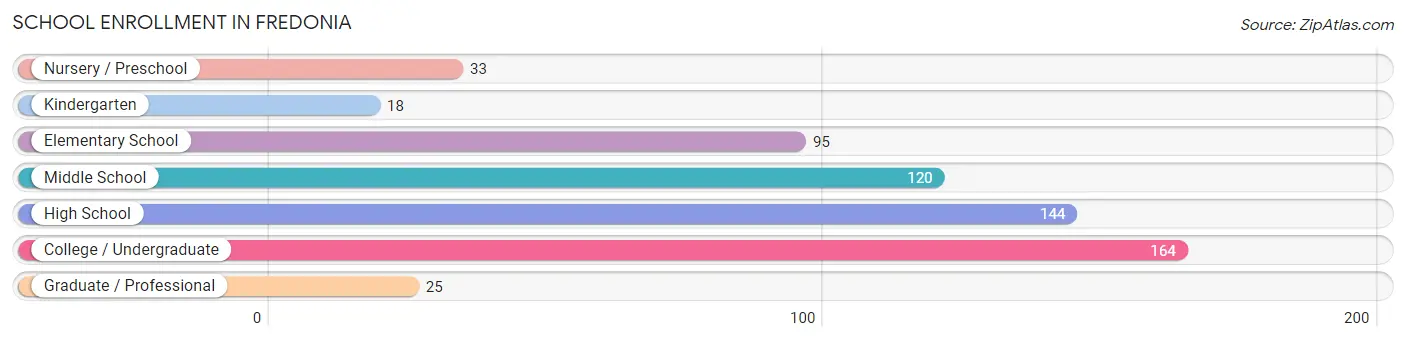
| School Level | # Students | % Students |
| Nursery / Preschool | 33 | 5.5% |
| Kindergarten | 18 | 3.0% |
| Elementary School | 95 | 15.9% |
| Middle School | 120 | 20.0% |
| High School | 144 | 24.0% |
| College / Undergraduate | 164 | 27.4% |
| Graduate / Professional | 25 | 4.2% |
| Total | 599 | 100.0% |
School Enrollment by Age by Funding Source in Fredonia
Out of a total of 599 students who are enrolled in schools in Fredonia, 52 (8.7%) attend a private institution, while the remaining 547 (91.3%) are enrolled in public schools. The age group of 3 to 4 year olds has the highest likelihood of being enrolled in private schools, with 10 (55.6% in the age bracket) enrolled. Conversely, the age group of 18 to 19 year olds has the lowest likelihood of being enrolled in a private school, with 27 (100.0% in the age bracket) attending a public institution.
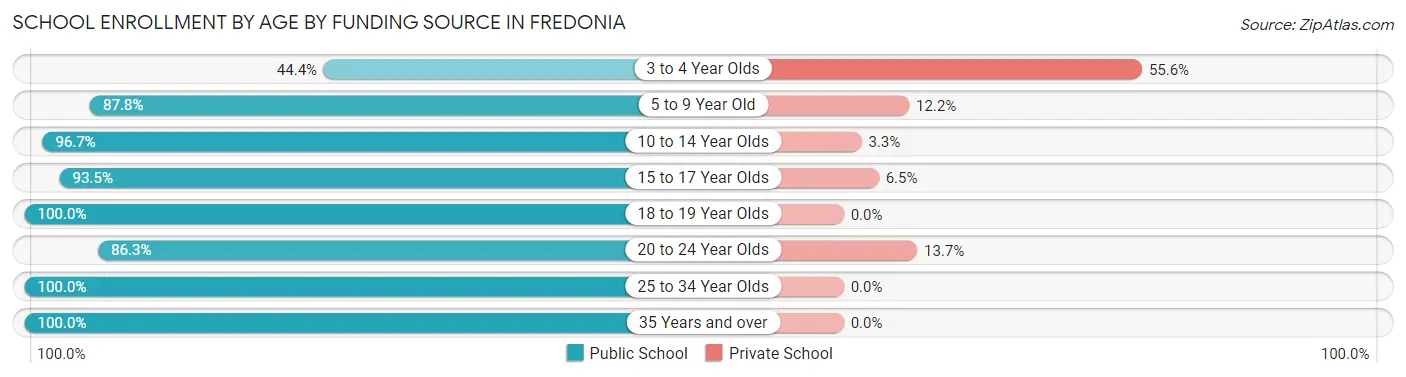
| Age Bracket | Public School | Private School |
| 3 to 4 Year Olds | 8 (44.4%) | 10 (55.6%) |
| 5 to 9 Year Old | 108 (87.8%) | 15 (12.2%) |
| 10 to 14 Year Olds | 145 (96.7%) | 5 (3.3%) |
| 15 to 17 Year Olds | 86 (93.5%) | 6 (6.5%) |
| 18 to 19 Year Olds | 27 (100.0%) | 0 (0.0%) |
| 20 to 24 Year Olds | 101 (86.3%) | 16 (13.7%) |
| 25 to 34 Year Olds | 29 (100.0%) | 0 (0.0%) |
| 35 Years and over | 43 (100.0%) | 0 (0.0%) |
| Total | 547 (91.3%) | 52 (8.7%) |
Educational Attainment by Field of Study in Fredonia
Business (117 | 27.6%), education (81 | 19.1%), science & technology (57 | 13.4%), arts & humanities (28 | 6.6%), and bio, nature & agricultural (25 | 5.9%) are the most common fields of study among 424 individuals in Fredonia who have obtained a bachelor's degree or higher.
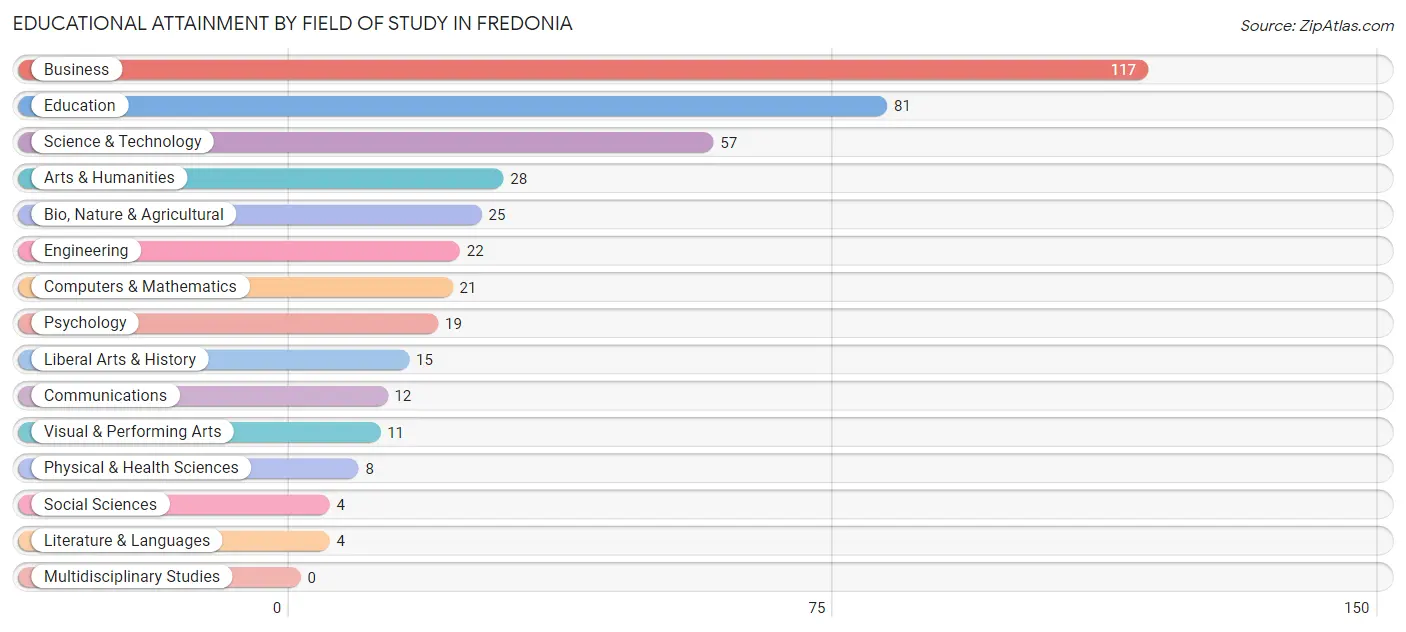
| Field of Study | # Graduates | % Graduates |
| Computers & Mathematics | 21 | 5.0% |
| Bio, Nature & Agricultural | 25 | 5.9% |
| Physical & Health Sciences | 8 | 1.9% |
| Psychology | 19 | 4.5% |
| Social Sciences | 4 | 0.9% |
| Engineering | 22 | 5.2% |
| Multidisciplinary Studies | 0 | 0.0% |
| Science & Technology | 57 | 13.4% |
| Business | 117 | 27.6% |
| Education | 81 | 19.1% |
| Literature & Languages | 4 | 0.9% |
| Liberal Arts & History | 15 | 3.5% |
| Visual & Performing Arts | 11 | 2.6% |
| Communications | 12 | 2.8% |
| Arts & Humanities | 28 | 6.6% |
| Total | 424 | 100.0% |
Transportation & Commute in Fredonia
Vehicle Availability by Sex in Fredonia
The most prevalent vehicle ownership categories in Fredonia are males with 2 vehicles (369, accounting for 50.6%) and females with 2 vehicles (337, making up 52.4%).
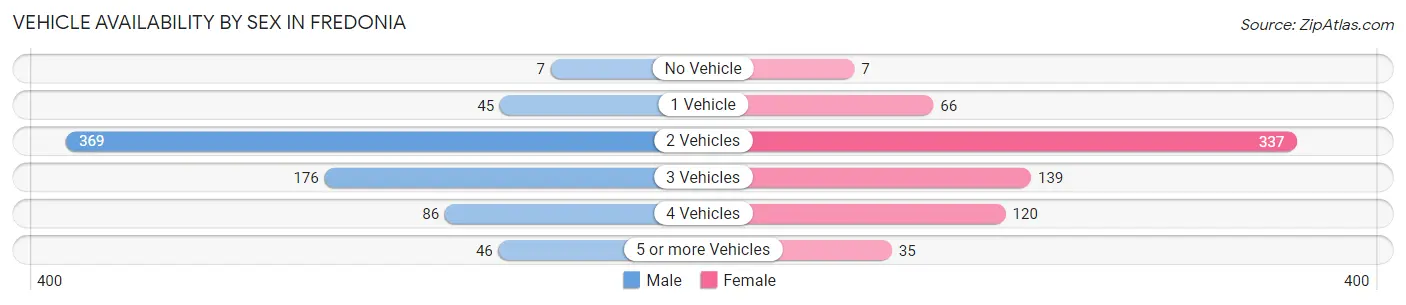
| Vehicles Available | Male | Female |
| No Vehicle | 7 (1.0%) | 7 (1.0%) |
| 1 Vehicle | 45 (6.2%) | 66 (9.4%) |
| 2 Vehicles | 369 (50.6%) | 337 (47.9%) |
| 3 Vehicles | 176 (24.1%) | 139 (19.7%) |
| 4 Vehicles | 86 (11.8%) | 120 (17.1%) |
| 5 or more Vehicles | 46 (6.3%) | 35 (5.0%) |
| Total | 729 (100.0%) | 704 (100.0%) |
Commute Time in Fredonia
The most frequently occuring commute durations in Fredonia are 15 to 19 minutes (308 commuters, 23.1%), 10 to 14 minutes (246 commuters, 18.4%), and 20 to 24 minutes (159 commuters, 11.9%).
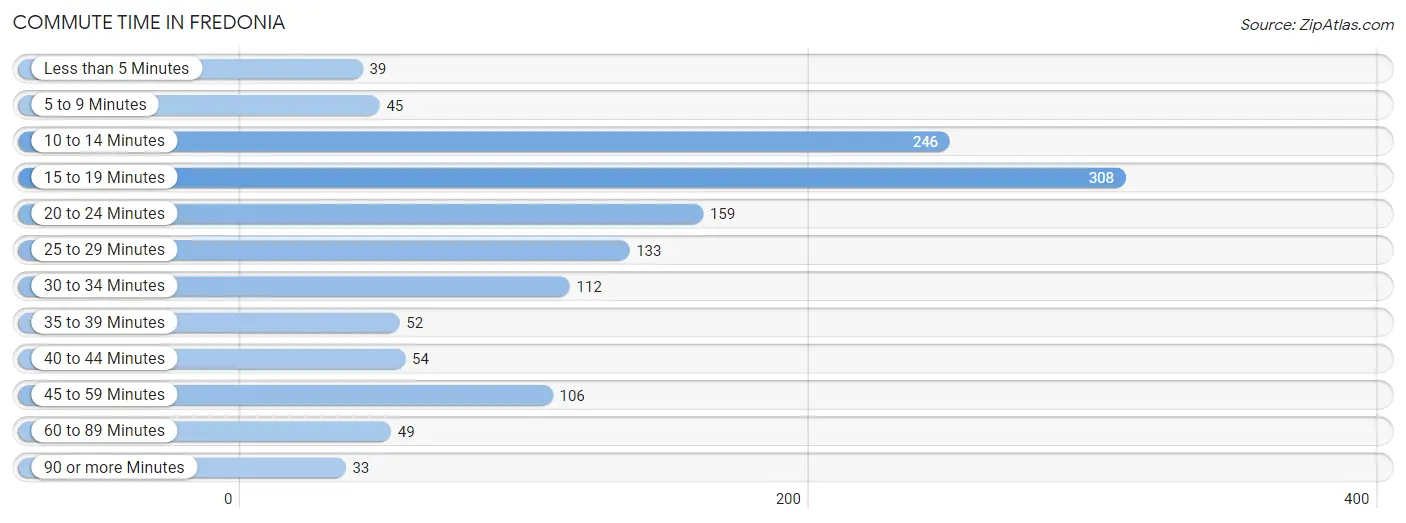
| Commute Time | # Commuters | % Commuters |
| Less than 5 Minutes | 39 | 2.9% |
| 5 to 9 Minutes | 45 | 3.4% |
| 10 to 14 Minutes | 246 | 18.4% |
| 15 to 19 Minutes | 308 | 23.1% |
| 20 to 24 Minutes | 159 | 11.9% |
| 25 to 29 Minutes | 133 | 10.0% |
| 30 to 34 Minutes | 112 | 8.4% |
| 35 to 39 Minutes | 52 | 3.9% |
| 40 to 44 Minutes | 54 | 4.0% |
| 45 to 59 Minutes | 106 | 7.9% |
| 60 to 89 Minutes | 49 | 3.7% |
| 90 or more Minutes | 33 | 2.5% |
Commute Time by Sex in Fredonia
The most common commute times in Fredonia are 15 to 19 minutes (167 commuters, 24.5%) for males and 10 to 14 minutes (145 commuters, 22.1%) for females.
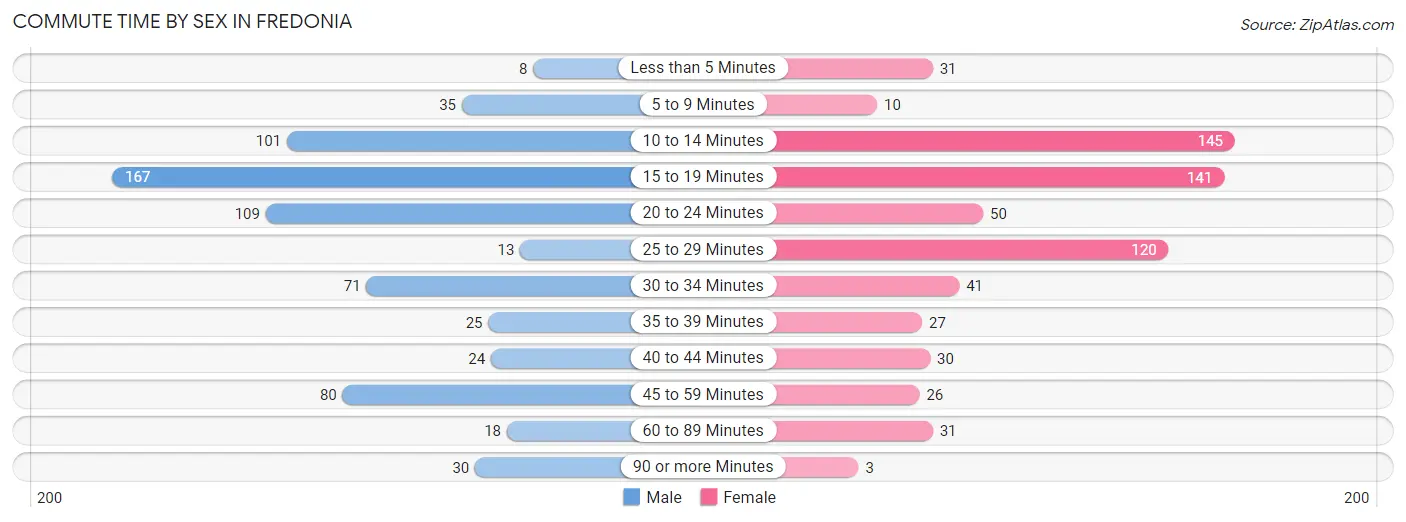
| Commute Time | Male | Female |
| Less than 5 Minutes | 8 (1.2%) | 31 (4.7%) |
| 5 to 9 Minutes | 35 (5.1%) | 10 (1.5%) |
| 10 to 14 Minutes | 101 (14.8%) | 145 (22.1%) |
| 15 to 19 Minutes | 167 (24.5%) | 141 (21.5%) |
| 20 to 24 Minutes | 109 (16.0%) | 50 (7.6%) |
| 25 to 29 Minutes | 13 (1.9%) | 120 (18.3%) |
| 30 to 34 Minutes | 71 (10.4%) | 41 (6.3%) |
| 35 to 39 Minutes | 25 (3.7%) | 27 (4.1%) |
| 40 to 44 Minutes | 24 (3.5%) | 30 (4.6%) |
| 45 to 59 Minutes | 80 (11.7%) | 26 (4.0%) |
| 60 to 89 Minutes | 18 (2.6%) | 31 (4.7%) |
| 90 or more Minutes | 30 (4.4%) | 3 (0.5%) |
Time of Departure to Work by Sex in Fredonia
The most frequent times of departure to work in Fredonia are 6:30 AM to 6:59 AM (88, 12.9%) for males and 12:00 AM to 4:59 AM (138, 21.1%) for females.
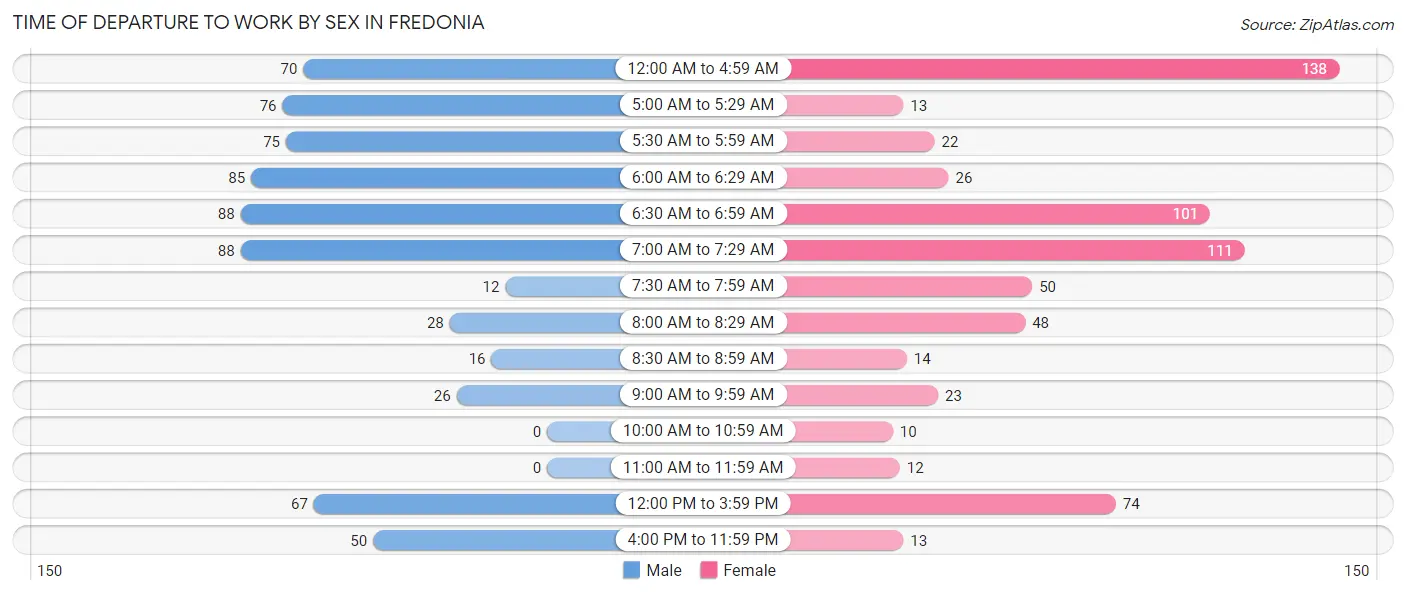
| Time of Departure | Male | Female |
| 12:00 AM to 4:59 AM | 70 (10.3%) | 138 (21.1%) |
| 5:00 AM to 5:29 AM | 76 (11.2%) | 13 (2.0%) |
| 5:30 AM to 5:59 AM | 75 (11.0%) | 22 (3.4%) |
| 6:00 AM to 6:29 AM | 85 (12.5%) | 26 (4.0%) |
| 6:30 AM to 6:59 AM | 88 (12.9%) | 101 (15.4%) |
| 7:00 AM to 7:29 AM | 88 (12.9%) | 111 (17.0%) |
| 7:30 AM to 7:59 AM | 12 (1.8%) | 50 (7.6%) |
| 8:00 AM to 8:29 AM | 28 (4.1%) | 48 (7.3%) |
| 8:30 AM to 8:59 AM | 16 (2.4%) | 14 (2.1%) |
| 9:00 AM to 9:59 AM | 26 (3.8%) | 23 (3.5%) |
| 10:00 AM to 10:59 AM | 0 (0.0%) | 10 (1.5%) |
| 11:00 AM to 11:59 AM | 0 (0.0%) | 12 (1.8%) |
| 12:00 PM to 3:59 PM | 67 (9.8%) | 74 (11.3%) |
| 4:00 PM to 11:59 PM | 50 (7.3%) | 13 (2.0%) |
| Total | 681 (100.0%) | 655 (100.0%) |
Housing Occupancy in Fredonia
Occupancy by Ownership in Fredonia
Of the total 845 dwellings in Fredonia, owner-occupied units account for 578 (68.4%), while renter-occupied units make up 267 (31.6%).
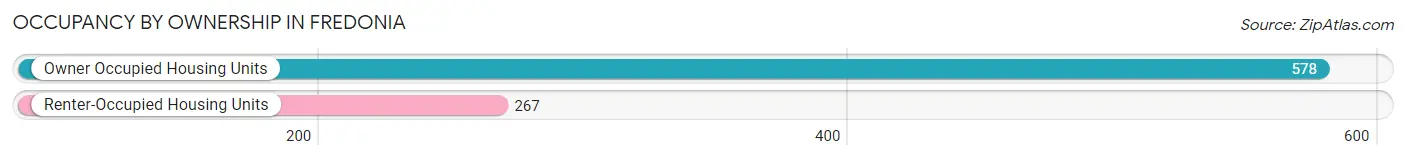
| Occupancy | # Housing Units | % Housing Units |
| Owner Occupied Housing Units | 578 | 68.4% |
| Renter-Occupied Housing Units | 267 | 31.6% |
| Total Occupied Housing Units | 845 | 100.0% |
Occupancy by Household Size in Fredonia
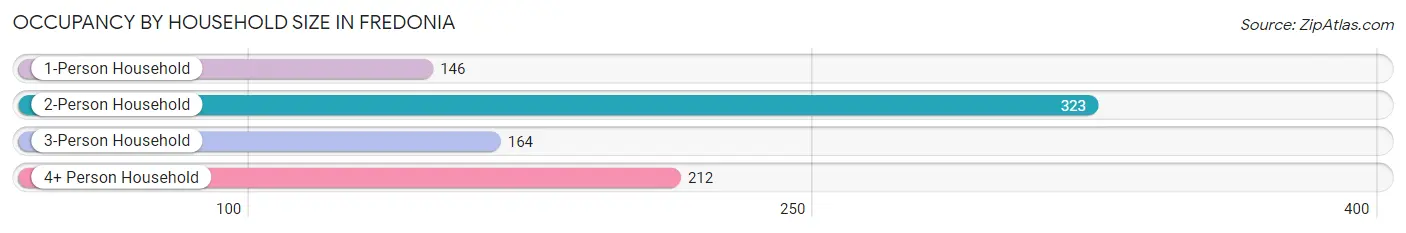
| Household Size | # Housing Units | % Housing Units |
| 1-Person Household | 146 | 17.3% |
| 2-Person Household | 323 | 38.2% |
| 3-Person Household | 164 | 19.4% |
| 4+ Person Household | 212 | 25.1% |
| Total Housing Units | 845 | 100.0% |
Occupancy by Ownership by Household Size in Fredonia
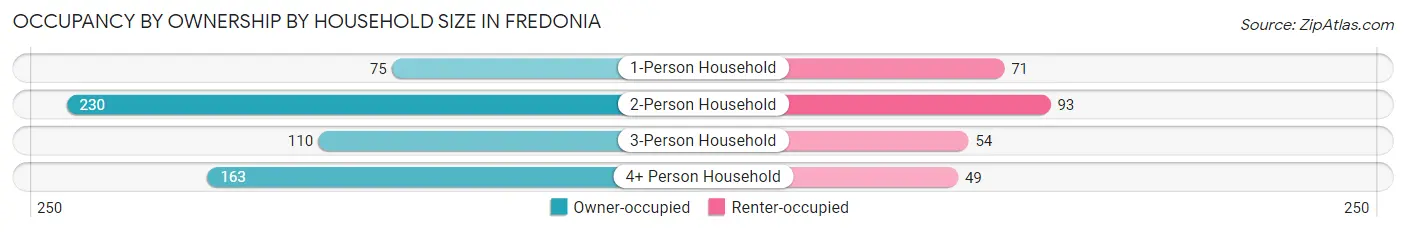
| Household Size | Owner-occupied | Renter-occupied |
| 1-Person Household | 75 (51.4%) | 71 (48.6%) |
| 2-Person Household | 230 (71.2%) | 93 (28.8%) |
| 3-Person Household | 110 (67.1%) | 54 (32.9%) |
| 4+ Person Household | 163 (76.9%) | 49 (23.1%) |
| Total Housing Units | 578 (68.4%) | 267 (31.6%) |
Occupancy by Educational Attainment in Fredonia
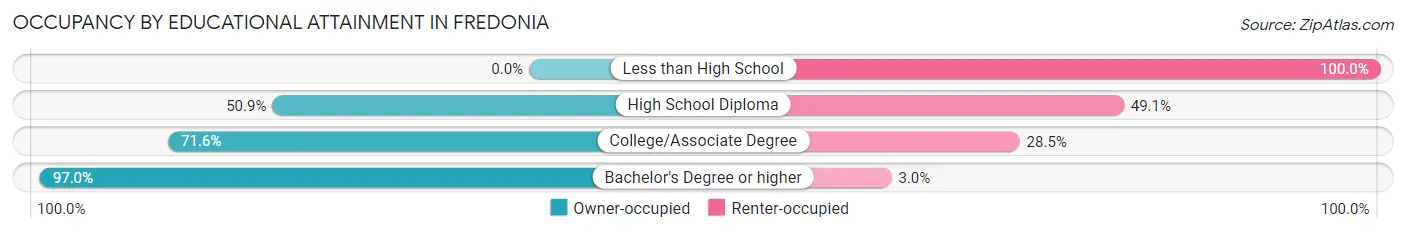
| Household Size | Owner-occupied | Renter-occupied |
| Less than High School | 0 (0.0%) | 27 (100.0%) |
| High School Diploma | 142 (50.9%) | 137 (49.1%) |
| College/Associate Degree | 244 (71.6%) | 97 (28.4%) |
| Bachelor's Degree or higher | 192 (97.0%) | 6 (3.0%) |
Occupancy by Age of Householder in Fredonia
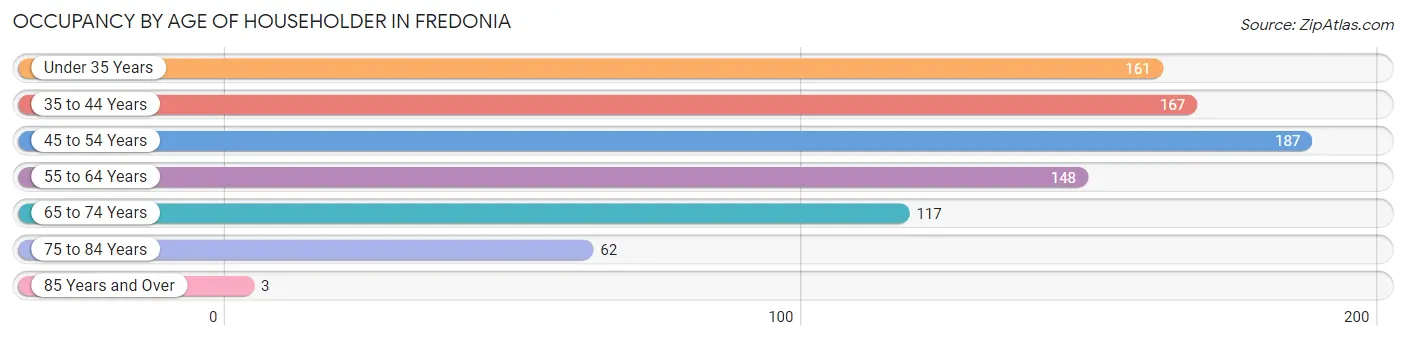
| Age Bracket | # Households | % Households |
| Under 35 Years | 161 | 19.1% |
| 35 to 44 Years | 167 | 19.8% |
| 45 to 54 Years | 187 | 22.1% |
| 55 to 64 Years | 148 | 17.5% |
| 65 to 74 Years | 117 | 13.9% |
| 75 to 84 Years | 62 | 7.3% |
| 85 Years and Over | 3 | 0.4% |
| Total | 845 | 100.0% |
Housing Finances in Fredonia
Median Income by Occupancy in Fredonia
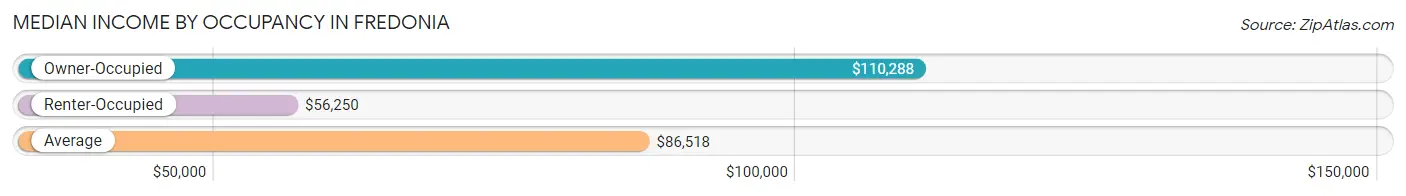
| Occupancy Type | # Households | Median Income |
| Owner-Occupied | 578 (68.4%) | $110,288 |
| Renter-Occupied | 267 (31.6%) | $56,250 |
| Average | 845 (100.0%) | $86,518 |
Occupancy by Householder Income Bracket in Fredonia
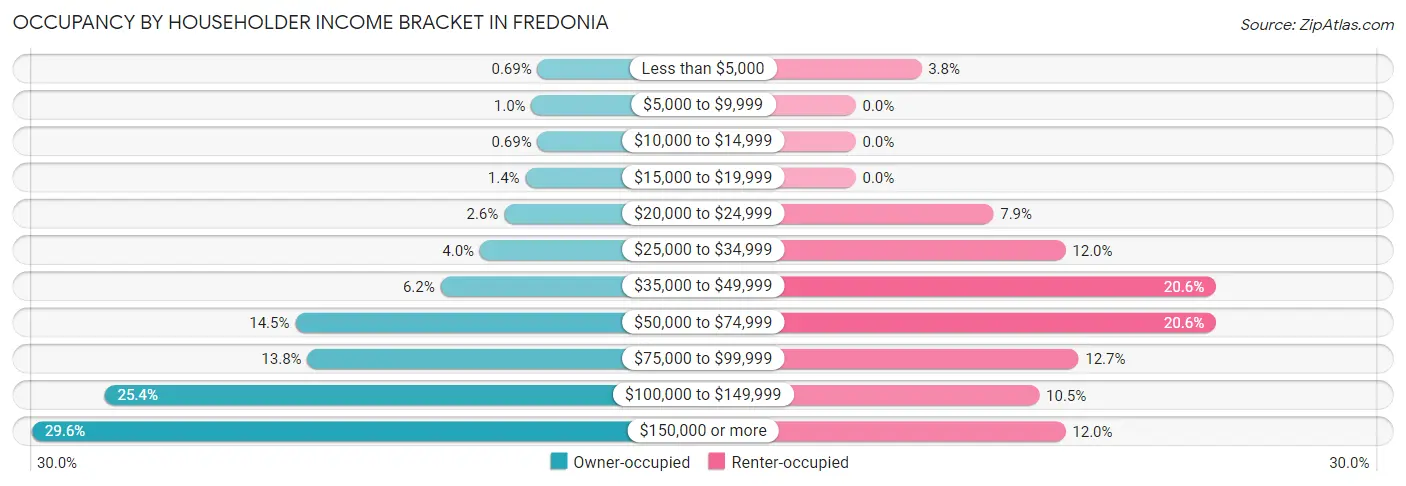
| Income Bracket | Owner-occupied | Renter-occupied |
| Less than $5,000 | 4 (0.7%) | 10 (3.7%) |
| $5,000 to $9,999 | 6 (1.0%) | 0 (0.0%) |
| $10,000 to $14,999 | 4 (0.7%) | 0 (0.0%) |
| $15,000 to $19,999 | 8 (1.4%) | 0 (0.0%) |
| $20,000 to $24,999 | 15 (2.6%) | 21 (7.9%) |
| $25,000 to $34,999 | 23 (4.0%) | 32 (12.0%) |
| $35,000 to $49,999 | 36 (6.2%) | 55 (20.6%) |
| $50,000 to $74,999 | 84 (14.5%) | 55 (20.6%) |
| $75,000 to $99,999 | 80 (13.8%) | 34 (12.7%) |
| $100,000 to $149,999 | 147 (25.4%) | 28 (10.5%) |
| $150,000 or more | 171 (29.6%) | 32 (12.0%) |
| Total | 578 (100.0%) | 267 (100.0%) |
Monthly Housing Cost Tiers in Fredonia
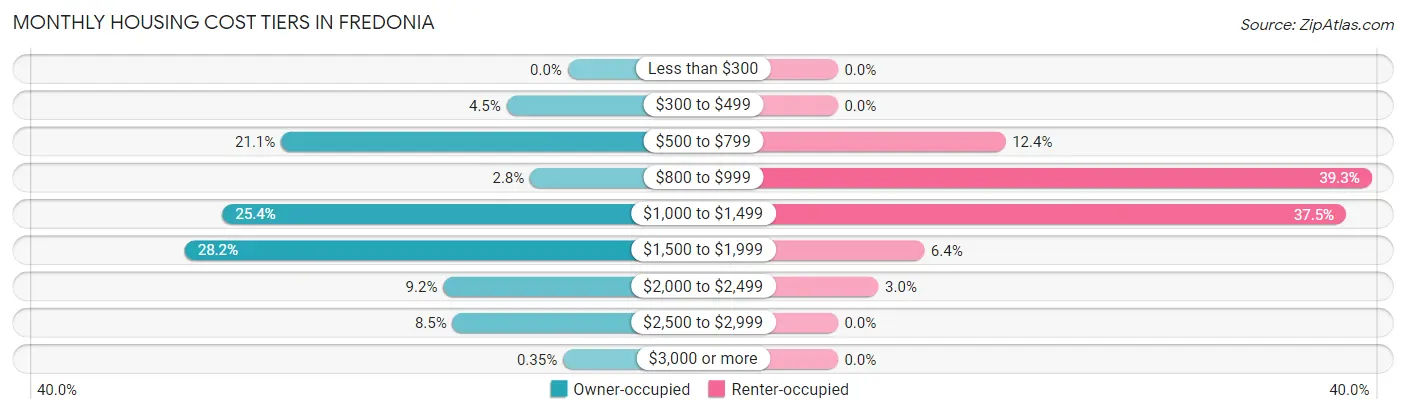
| Monthly Cost | Owner-occupied | Renter-occupied |
| Less than $300 | 0 (0.0%) | 0 (0.0%) |
| $300 to $499 | 26 (4.5%) | 0 (0.0%) |
| $500 to $799 | 122 (21.1%) | 33 (12.4%) |
| $800 to $999 | 16 (2.8%) | 105 (39.3%) |
| $1,000 to $1,499 | 147 (25.4%) | 100 (37.4%) |
| $1,500 to $1,999 | 163 (28.2%) | 17 (6.4%) |
| $2,000 to $2,499 | 53 (9.2%) | 8 (3.0%) |
| $2,500 to $2,999 | 49 (8.5%) | 0 (0.0%) |
| $3,000 or more | 2 (0.4%) | 0 (0.0%) |
| Total | 578 (100.0%) | 267 (100.0%) |
Physical Housing Characteristics in Fredonia
Housing Structures in Fredonia
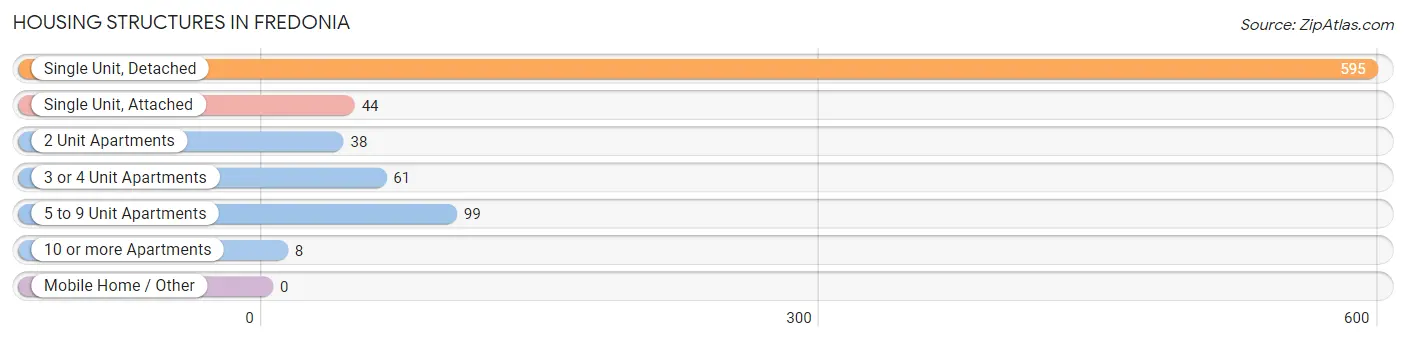
| Structure Type | # Housing Units | % Housing Units |
| Single Unit, Detached | 595 | 70.4% |
| Single Unit, Attached | 44 | 5.2% |
| 2 Unit Apartments | 38 | 4.5% |
| 3 or 4 Unit Apartments | 61 | 7.2% |
| 5 to 9 Unit Apartments | 99 | 11.7% |
| 10 or more Apartments | 8 | 0.9% |
| Mobile Home / Other | 0 | 0.0% |
| Total | 845 | 100.0% |
Housing Structures by Occupancy in Fredonia
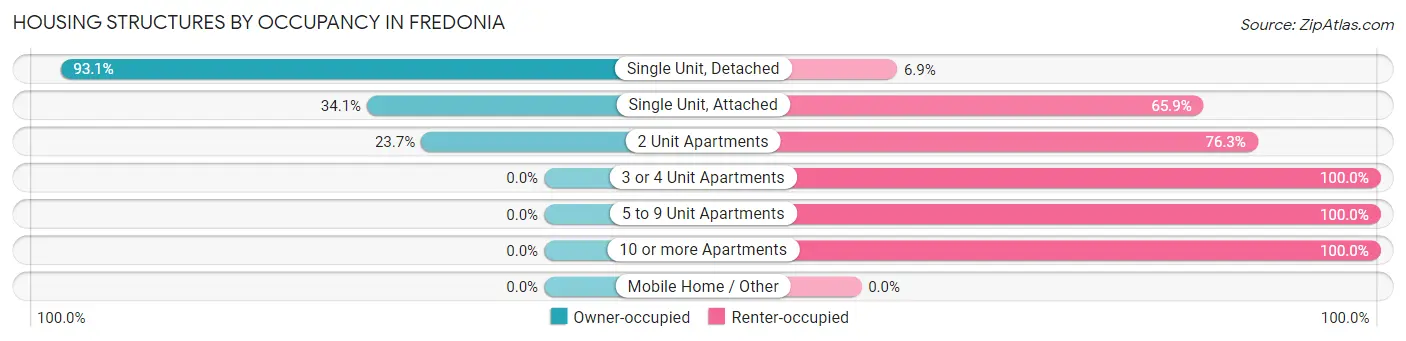
| Structure Type | Owner-occupied | Renter-occupied |
| Single Unit, Detached | 554 (93.1%) | 41 (6.9%) |
| Single Unit, Attached | 15 (34.1%) | 29 (65.9%) |
| 2 Unit Apartments | 9 (23.7%) | 29 (76.3%) |
| 3 or 4 Unit Apartments | 0 (0.0%) | 61 (100.0%) |
| 5 to 9 Unit Apartments | 0 (0.0%) | 99 (100.0%) |
| 10 or more Apartments | 0 (0.0%) | 8 (100.0%) |
| Mobile Home / Other | 0 (0.0%) | 0 (0.0%) |
| Total | 578 (68.4%) | 267 (31.6%) |
Housing Structures by Number of Rooms in Fredonia
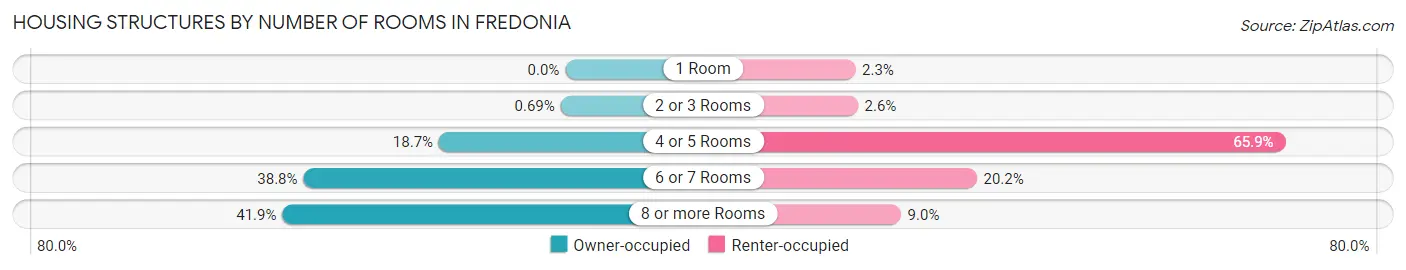
| Number of Rooms | Owner-occupied | Renter-occupied |
| 1 Room | 0 (0.0%) | 6 (2.2%) |
| 2 or 3 Rooms | 4 (0.7%) | 7 (2.6%) |
| 4 or 5 Rooms | 108 (18.7%) | 176 (65.9%) |
| 6 or 7 Rooms | 224 (38.8%) | 54 (20.2%) |
| 8 or more Rooms | 242 (41.9%) | 24 (9.0%) |
| Total | 578 (100.0%) | 267 (100.0%) |
Housing Structure by Heating Type in Fredonia
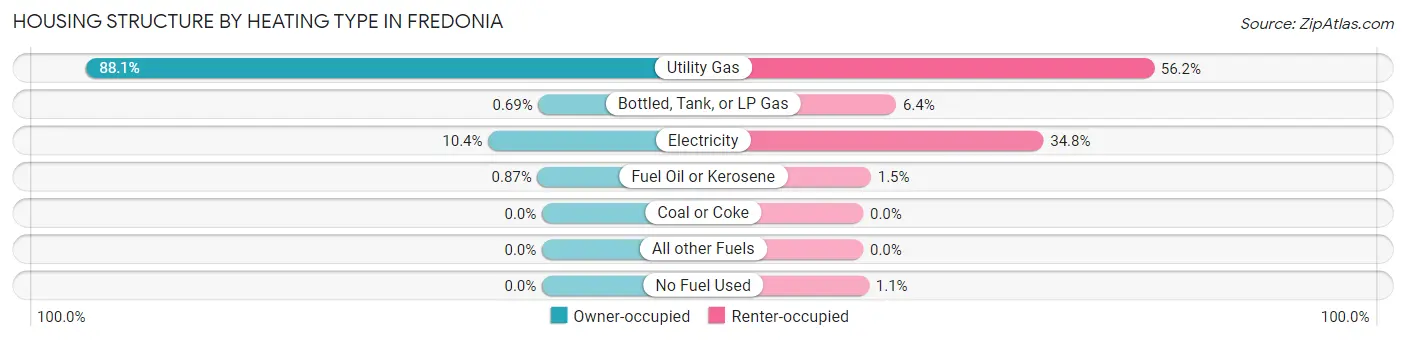
| Heating Type | Owner-occupied | Renter-occupied |
| Utility Gas | 509 (88.1%) | 150 (56.2%) |
| Bottled, Tank, or LP Gas | 4 (0.7%) | 17 (6.4%) |
| Electricity | 60 (10.4%) | 93 (34.8%) |
| Fuel Oil or Kerosene | 5 (0.9%) | 4 (1.5%) |
| Coal or Coke | 0 (0.0%) | 0 (0.0%) |
| All other Fuels | 0 (0.0%) | 0 (0.0%) |
| No Fuel Used | 0 (0.0%) | 3 (1.1%) |
| Total | 578 (100.0%) | 267 (100.0%) |
Household Vehicle Usage in Fredonia
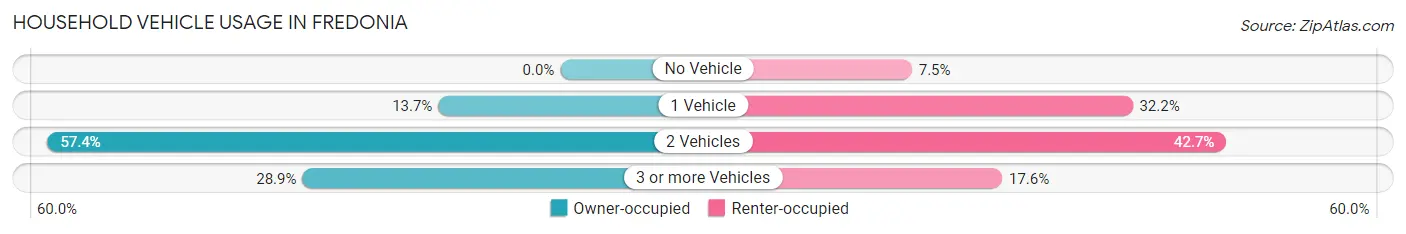
| Vehicles per Household | Owner-occupied | Renter-occupied |
| No Vehicle | 0 (0.0%) | 20 (7.5%) |
| 1 Vehicle | 79 (13.7%) | 86 (32.2%) |
| 2 Vehicles | 332 (57.4%) | 114 (42.7%) |
| 3 or more Vehicles | 167 (28.9%) | 47 (17.6%) |
| Total | 578 (100.0%) | 267 (100.0%) |
Real Estate & Mortgages in Fredonia
Real Estate and Mortgage Overview in Fredonia
| Characteristic | Without Mortgage | With Mortgage |
| Housing Units | 149 | 429 |
| Median Property Value | $208,800 | $264,900 |
| Median Household Income | $105,250 | $128 |
| Monthly Housing Costs | $577 | $2 |
| Real Estate Taxes | $3,258 | $0 |
Property Value by Mortgage Status in Fredonia
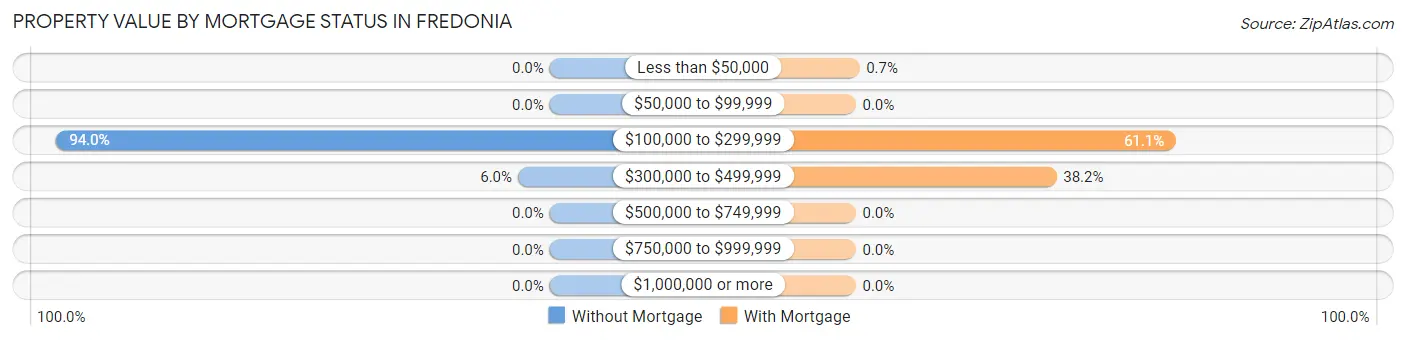
| Property Value | Without Mortgage | With Mortgage |
| Less than $50,000 | 0 (0.0%) | 3 (0.7%) |
| $50,000 to $99,999 | 0 (0.0%) | 0 (0.0%) |
| $100,000 to $299,999 | 140 (94.0%) | 262 (61.1%) |
| $300,000 to $499,999 | 9 (6.0%) | 164 (38.2%) |
| $500,000 to $749,999 | 0 (0.0%) | 0 (0.0%) |
| $750,000 to $999,999 | 0 (0.0%) | 0 (0.0%) |
| $1,000,000 or more | 0 (0.0%) | 0 (0.0%) |
| Total | 149 (100.0%) | 429 (100.0%) |
Household Income by Mortgage Status in Fredonia
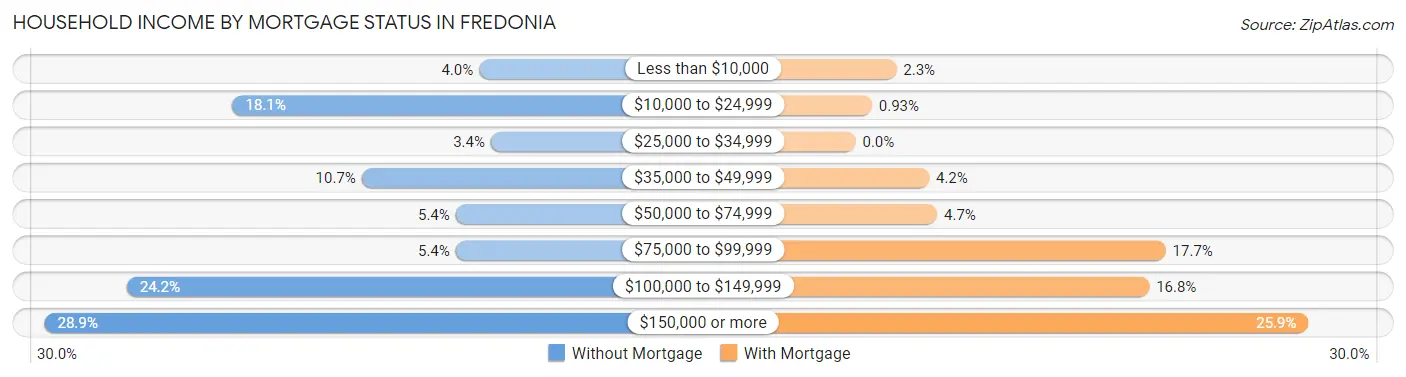
| Household Income | Without Mortgage | With Mortgage |
| Less than $10,000 | 6 (4.0%) | 10 (2.3%) |
| $10,000 to $24,999 | 27 (18.1%) | 4 (0.9%) |
| $25,000 to $34,999 | 5 (3.4%) | 0 (0.0%) |
| $35,000 to $49,999 | 16 (10.7%) | 18 (4.2%) |
| $50,000 to $74,999 | 8 (5.4%) | 20 (4.7%) |
| $75,000 to $99,999 | 8 (5.4%) | 76 (17.7%) |
| $100,000 to $149,999 | 36 (24.2%) | 72 (16.8%) |
| $150,000 or more | 43 (28.9%) | 111 (25.9%) |
| Total | 149 (100.0%) | 429 (100.0%) |
Property Value to Household Income Ratio in Fredonia
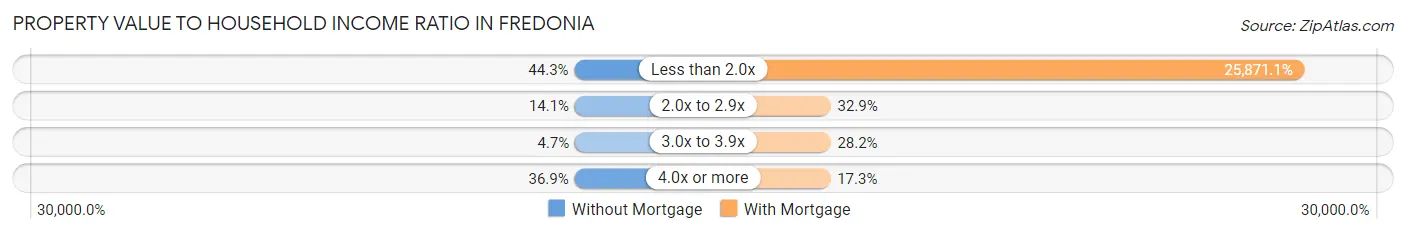
| Value-to-Income Ratio | Without Mortgage | With Mortgage |
| Less than 2.0x | 66 (44.3%) | 110,987 (25,871.1%) |
| 2.0x to 2.9x | 21 (14.1%) | 141 (32.9%) |
| 3.0x to 3.9x | 7 (4.7%) | 121 (28.2%) |
| 4.0x or more | 55 (36.9%) | 74 (17.2%) |
| Total | 149 (100.0%) | 429 (100.0%) |
Real Estate Taxes by Mortgage Status in Fredonia
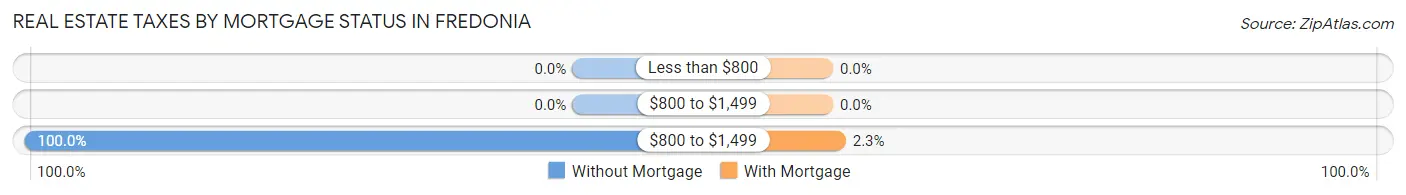
| Property Taxes | Without Mortgage | With Mortgage |
| Less than $800 | 0 (0.0%) | 0 (0.0%) |
| $800 to $1,499 | 0 (0.0%) | 0 (0.0%) |
| $800 to $1,499 | 149 (100.0%) | 10 (2.3%) |
| Total | 149 (100.0%) | 429 (100.0%) |
Health & Disability in Fredonia
Health Insurance Coverage by Age in Fredonia
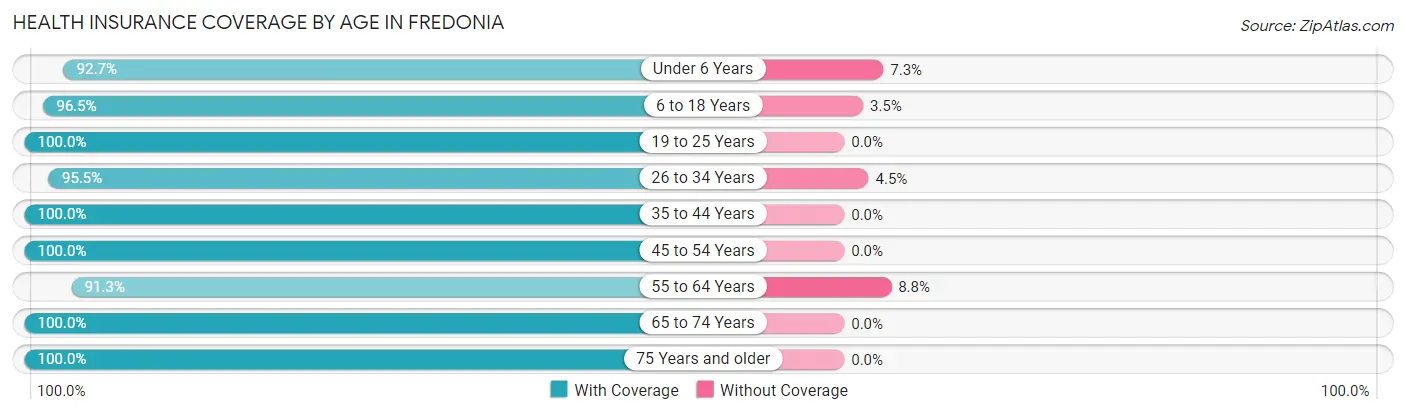
| Age Bracket | With Coverage | Without Coverage |
| Under 6 Years | 191 (92.7%) | 15 (7.3%) |
| 6 to 18 Years | 358 (96.5%) | 13 (3.5%) |
| 19 to 25 Years | 315 (100.0%) | 0 (0.0%) |
| 26 to 34 Years | 274 (95.5%) | 13 (4.5%) |
| 35 to 44 Years | 313 (100.0%) | 0 (0.0%) |
| 45 to 54 Years | 376 (100.0%) | 0 (0.0%) |
| 55 to 64 Years | 292 (91.2%) | 28 (8.7%) |
| 65 to 74 Years | 167 (100.0%) | 0 (0.0%) |
| 75 Years and older | 91 (100.0%) | 0 (0.0%) |
| Total | 2,377 (97.2%) | 69 (2.8%) |
Health Insurance Coverage by Citizenship Status in Fredonia
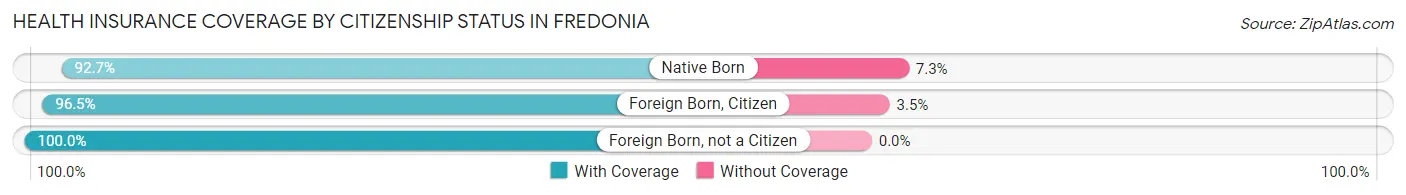
| Citizenship Status | With Coverage | Without Coverage |
| Native Born | 191 (92.7%) | 15 (7.3%) |
| Foreign Born, Citizen | 358 (96.5%) | 13 (3.5%) |
| Foreign Born, not a Citizen | 315 (100.0%) | 0 (0.0%) |
Health Insurance Coverage by Household Income in Fredonia
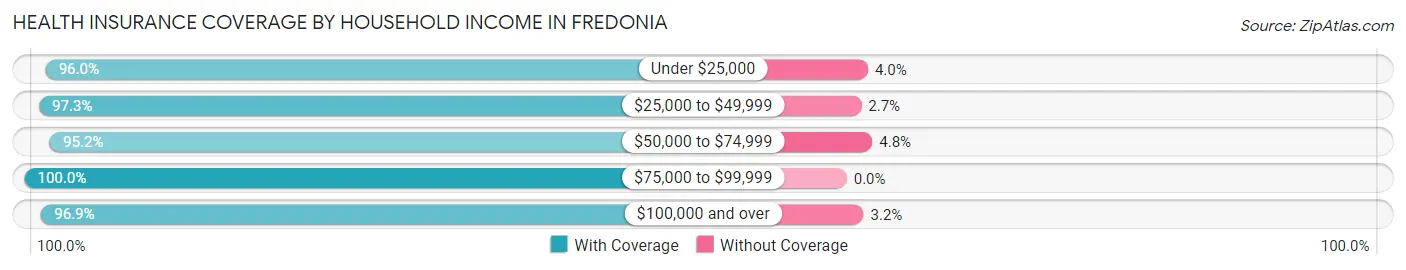
| Household Income | With Coverage | Without Coverage |
| Under $25,000 | 145 (96.0%) | 6 (4.0%) |
| $25,000 to $49,999 | 286 (97.3%) | 8 (2.7%) |
| $50,000 to $74,999 | 278 (95.2%) | 14 (4.8%) |
| $75,000 to $99,999 | 391 (100.0%) | 0 (0.0%) |
| $100,000 and over | 1,260 (96.9%) | 41 (3.2%) |
Public vs Private Health Insurance Coverage by Age in Fredonia
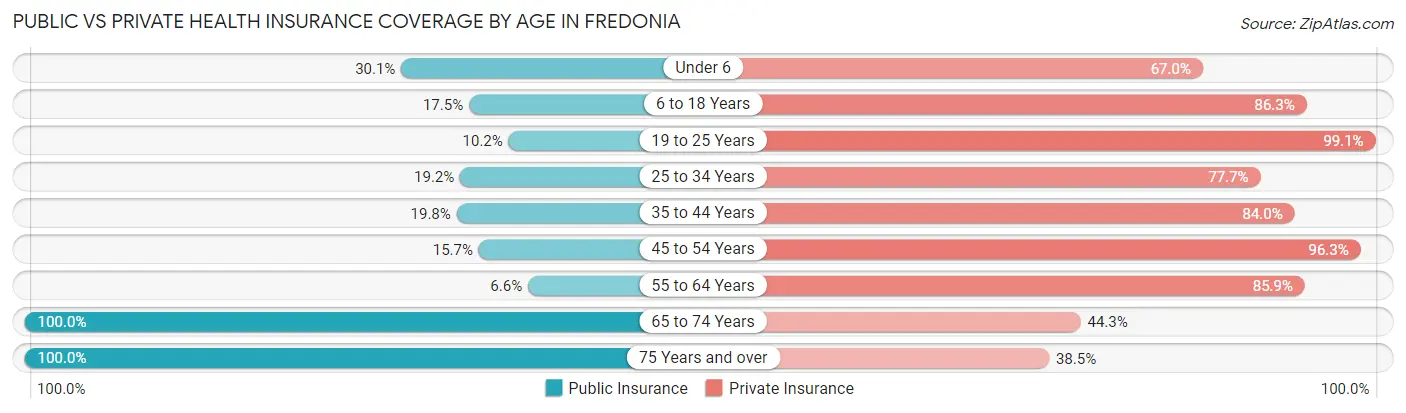
| Age Bracket | Public Insurance | Private Insurance |
| Under 6 | 62 (30.1%) | 138 (67.0%) |
| 6 to 18 Years | 65 (17.5%) | 320 (86.3%) |
| 19 to 25 Years | 32 (10.2%) | 312 (99.1%) |
| 25 to 34 Years | 55 (19.2%) | 223 (77.7%) |
| 35 to 44 Years | 62 (19.8%) | 263 (84.0%) |
| 45 to 54 Years | 59 (15.7%) | 362 (96.3%) |
| 55 to 64 Years | 21 (6.6%) | 275 (85.9%) |
| 65 to 74 Years | 167 (100.0%) | 74 (44.3%) |
| 75 Years and over | 91 (100.0%) | 35 (38.5%) |
| Total | 614 (25.1%) | 2,002 (81.9%) |
Disability Status by Sex by Age in Fredonia
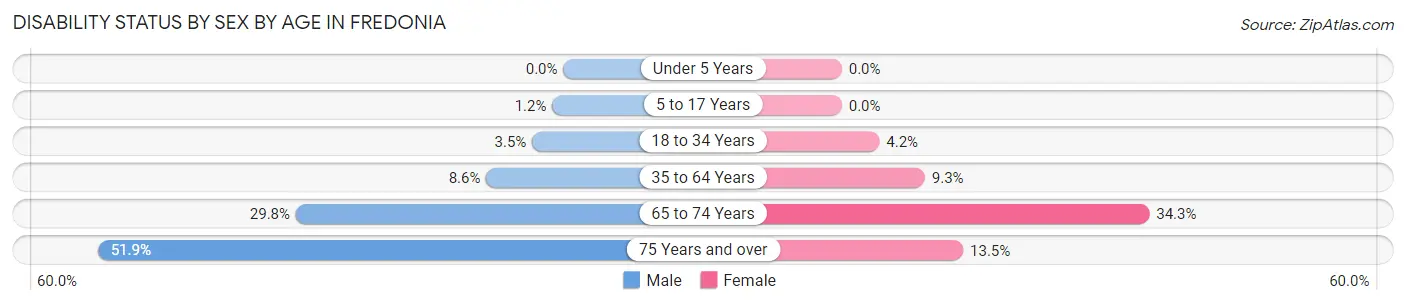
| Age Bracket | Male | Female |
| Under 5 Years | 0 (0.0%) | 0 (0.0%) |
| 5 to 17 Years | 2 (1.2%) | 0 (0.0%) |
| 18 to 34 Years | 12 (3.5%) | 12 (4.2%) |
| 35 to 64 Years | 43 (8.6%) | 47 (9.2%) |
| 65 to 74 Years | 28 (29.8%) | 25 (34.3%) |
| 75 Years and over | 28 (51.8%) | 5 (13.5%) |
Disability Class by Sex by Age in Fredonia
Disability Class: Hearing Difficulty
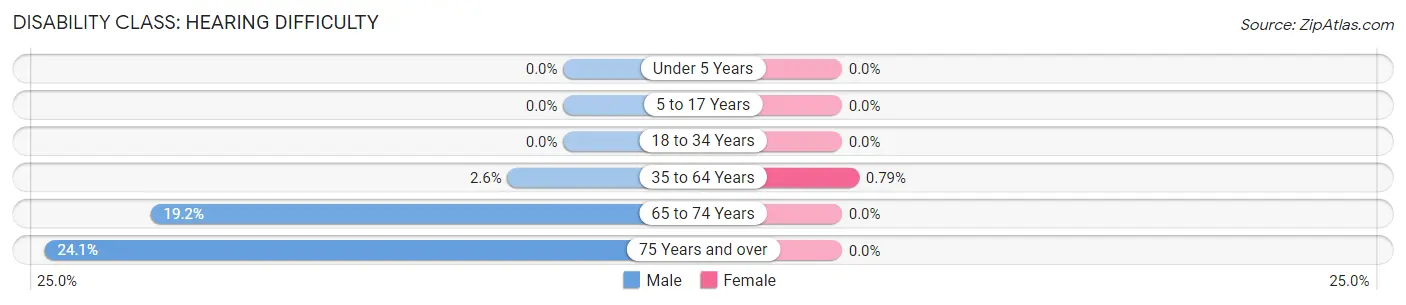
| Age Bracket | Male | Female |
| Under 5 Years | 0 (0.0%) | 0 (0.0%) |
| 5 to 17 Years | 0 (0.0%) | 0 (0.0%) |
| 18 to 34 Years | 0 (0.0%) | 0 (0.0%) |
| 35 to 64 Years | 13 (2.6%) | 4 (0.8%) |
| 65 to 74 Years | 18 (19.2%) | 0 (0.0%) |
| 75 Years and over | 13 (24.1%) | 0 (0.0%) |
Disability Class: Vision Difficulty
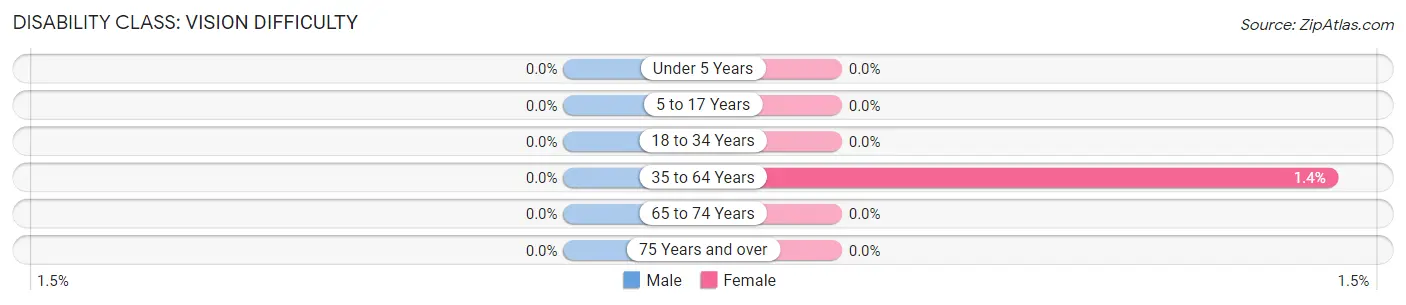
| Age Bracket | Male | Female |
| Under 5 Years | 0 (0.0%) | 0 (0.0%) |
| 5 to 17 Years | 0 (0.0%) | 0 (0.0%) |
| 18 to 34 Years | 0 (0.0%) | 0 (0.0%) |
| 35 to 64 Years | 0 (0.0%) | 7 (1.4%) |
| 65 to 74 Years | 0 (0.0%) | 0 (0.0%) |
| 75 Years and over | 0 (0.0%) | 0 (0.0%) |
Disability Class: Cognitive Difficulty
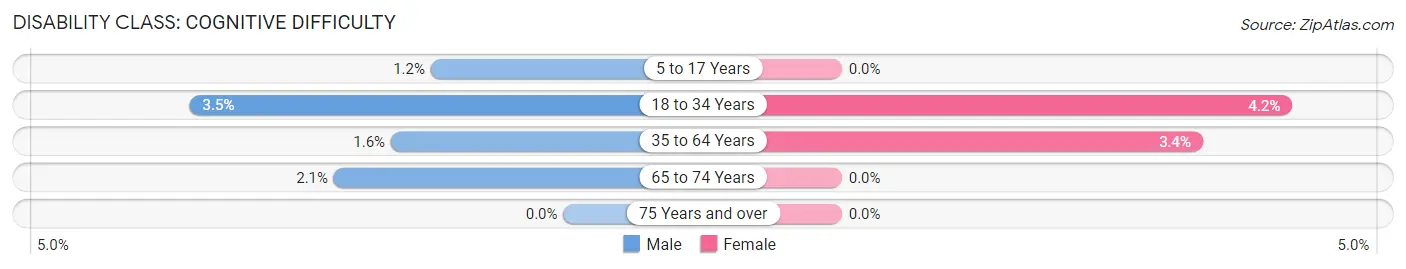
| Age Bracket | Male | Female |
| 5 to 17 Years | 2 (1.2%) | 0 (0.0%) |
| 18 to 34 Years | 12 (3.5%) | 12 (4.2%) |
| 35 to 64 Years | 8 (1.6%) | 17 (3.4%) |
| 65 to 74 Years | 2 (2.1%) | 0 (0.0%) |
| 75 Years and over | 0 (0.0%) | 0 (0.0%) |
Disability Class: Ambulatory Difficulty
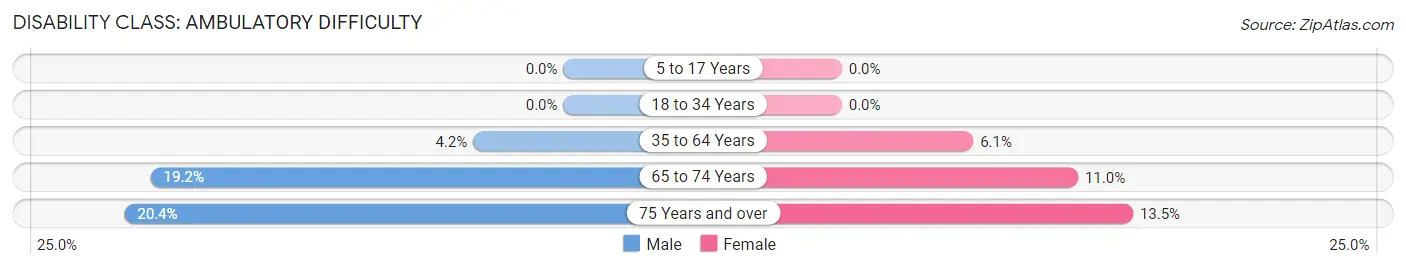
| Age Bracket | Male | Female |
| 5 to 17 Years | 0 (0.0%) | 0 (0.0%) |
| 18 to 34 Years | 0 (0.0%) | 0 (0.0%) |
| 35 to 64 Years | 21 (4.2%) | 31 (6.1%) |
| 65 to 74 Years | 18 (19.2%) | 8 (11.0%) |
| 75 Years and over | 11 (20.4%) | 5 (13.5%) |
Disability Class: Self-Care Difficulty
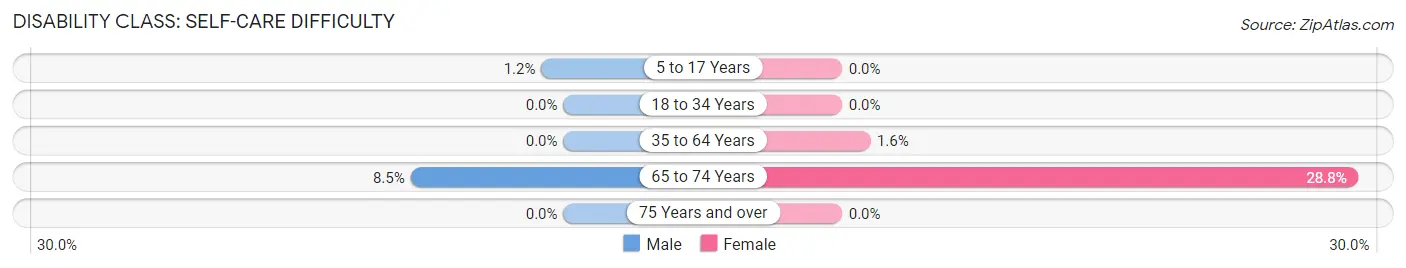
| Age Bracket | Male | Female |
| 5 to 17 Years | 2 (1.2%) | 0 (0.0%) |
| 18 to 34 Years | 0 (0.0%) | 0 (0.0%) |
| 35 to 64 Years | 0 (0.0%) | 8 (1.6%) |
| 65 to 74 Years | 8 (8.5%) | 21 (28.8%) |
| 75 Years and over | 0 (0.0%) | 0 (0.0%) |
Technology Access in Fredonia
Computing Device Access in Fredonia
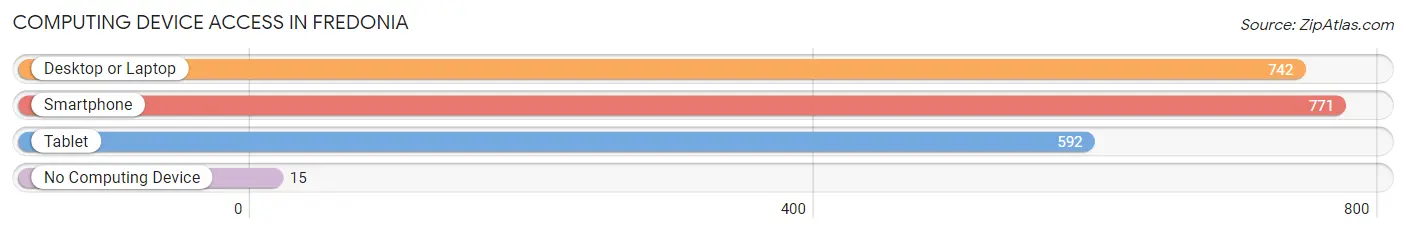
| Device Type | # Households | % Households |
| Desktop or Laptop | 742 | 87.8% |
| Smartphone | 771 | 91.2% |
| Tablet | 592 | 70.1% |
| No Computing Device | 15 | 1.8% |
| Total | 845 | 100.0% |
Internet Access in Fredonia
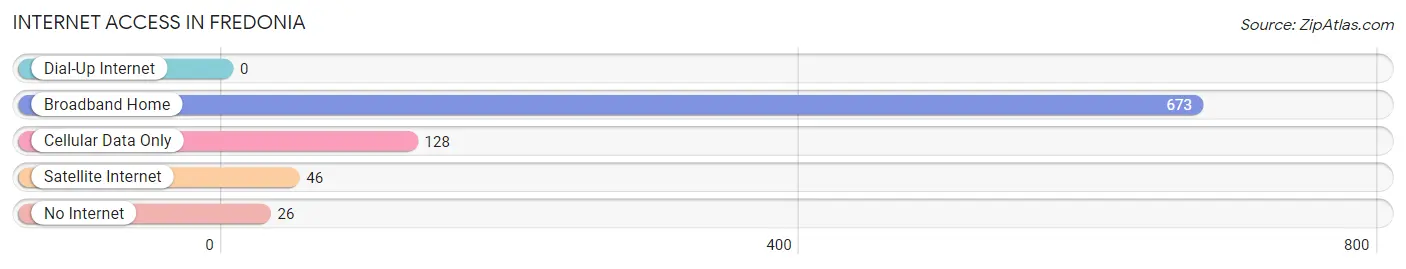
| Internet Type | # Households | % Households |
| Dial-Up Internet | 0 | 0.0% |
| Broadband Home | 673 | 79.6% |
| Cellular Data Only | 128 | 15.1% |
| Satellite Internet | 46 | 5.4% |
| No Internet | 26 | 3.1% |
| Total | 845 | 100.0% |
Fredonia Summary
Fredonia, Wisconsin is a small village located in Ozaukee County, Wisconsin. It is situated on the western shore of Lake Michigan, about 25 miles north of Milwaukee. The village has a population of 1,845 people, according to the 2010 census.
History
Fredonia was founded in 1845 by German immigrants who had come to the area in search of religious freedom. The village was named after the German city of Freiburg, which means “free town”. The first settlers were mostly farmers, and the village grew slowly over the years. In 1871, the village was incorporated and the first mayor was elected.
In the late 19th century, Fredonia became a popular summer resort destination for wealthy Milwaukeeans. The village was known for its beautiful beaches and its picturesque views of Lake Michigan. In the early 20th century, the village was home to several resorts, including the Fredonia Hotel, which was built in 1906.
Geography
Fredonia is located in Ozaukee County, Wisconsin, on the western shore of Lake Michigan. The village is situated on a bluff overlooking the lake, and is surrounded by rolling hills and wooded areas. The village is located about 25 miles north of Milwaukee, and is about a two-hour drive from Chicago.
The village is home to several parks, including Fredonia Park, which features a playground, picnic area, and a beach. The village also has a public library, a post office, and a few small businesses.
Economy
The economy of Fredonia is largely based on tourism and agriculture. The village is home to several resorts and bed and breakfasts, which attract visitors from all over the Midwest. The village also has several small businesses, including a grocery store, a hardware store, and a few restaurants.
Agriculture is also an important part of the local economy. The village is home to several farms, which produce a variety of crops, including corn, soybeans, and wheat.
Demographics
According to the 2010 census, the population of Fredonia was 1,845 people. The village is predominantly white, with 95.3% of the population identifying as such. The median household income is $50,972, and the median age is 44.7 years.
Conclusion
Fredonia, Wisconsin is a small village located in Ozaukee County, Wisconsin. It is situated on the western shore of Lake Michigan, about 25 miles north of Milwaukee. The village has a population of 1,845 people, according to the 2010 census. The economy of Fredonia is largely based on tourism and agriculture, and the village is home to several resorts and bed and breakfasts, as well as several small businesses and farms. The village is predominantly white, with 95.3% of the population identifying as such. The median household income is $50,972, and the median age is 44.7 years.
Common Questions
What is Per Capita Income in Fredonia?
Per Capita income in Fredonia is $40,622.
What is the Median Family Income in Fredonia?
Median Family Income in Fredonia is $110,481.
What is the Median Household income in Fredonia?
Median Household Income in Fredonia is $86,518.
What is Income or Wage Gap in Fredonia?
Income or Wage Gap in Fredonia is 27.3%.
Women in Fredonia earn 72.7 cents for every dollar earned by a man.
What is Inequality or Gini Index in Fredonia?
Inequality or Gini Index in Fredonia is 0.40.
What is the Total Population of Fredonia?
Total Population of Fredonia is 2,446.
What is the Total Male Population of Fredonia?
Total Male Population of Fredonia is 1,227.
What is the Total Female Population of Fredonia?
Total Female Population of Fredonia is 1,219.
What is the Ratio of Males per 100 Females in Fredonia?
There are 100.66 Males per 100 Females in Fredonia.
What is the Ratio of Females per 100 Males in Fredonia?
There are 99.35 Females per 100 Males in Fredonia.
What is the Median Population Age in Fredonia?
Median Population Age in Fredonia is 36.2 Years.
What is the Average Family Size in Fredonia
Average Family Size in Fredonia is 3.4 People.
What is the Average Household Size in Fredonia
Average Household Size in Fredonia is 2.9 People.
How Large is the Labor Force in Fredonia?
There are 1,498 People in the Labor Forcein in Fredonia.
What is the Percentage of People in the Labor Force in Fredonia?
76.0% of People are in the Labor Force in Fredonia.
What is the Unemployment Rate in Fredonia?
Unemployment Rate in Fredonia is 4.0%.