Cities with the Most Immigrants from Eastern Africa in Wisconsin
RELATED REPORTS & OPTIONS
Eastern Africa
Wisconsin
Compare Cities
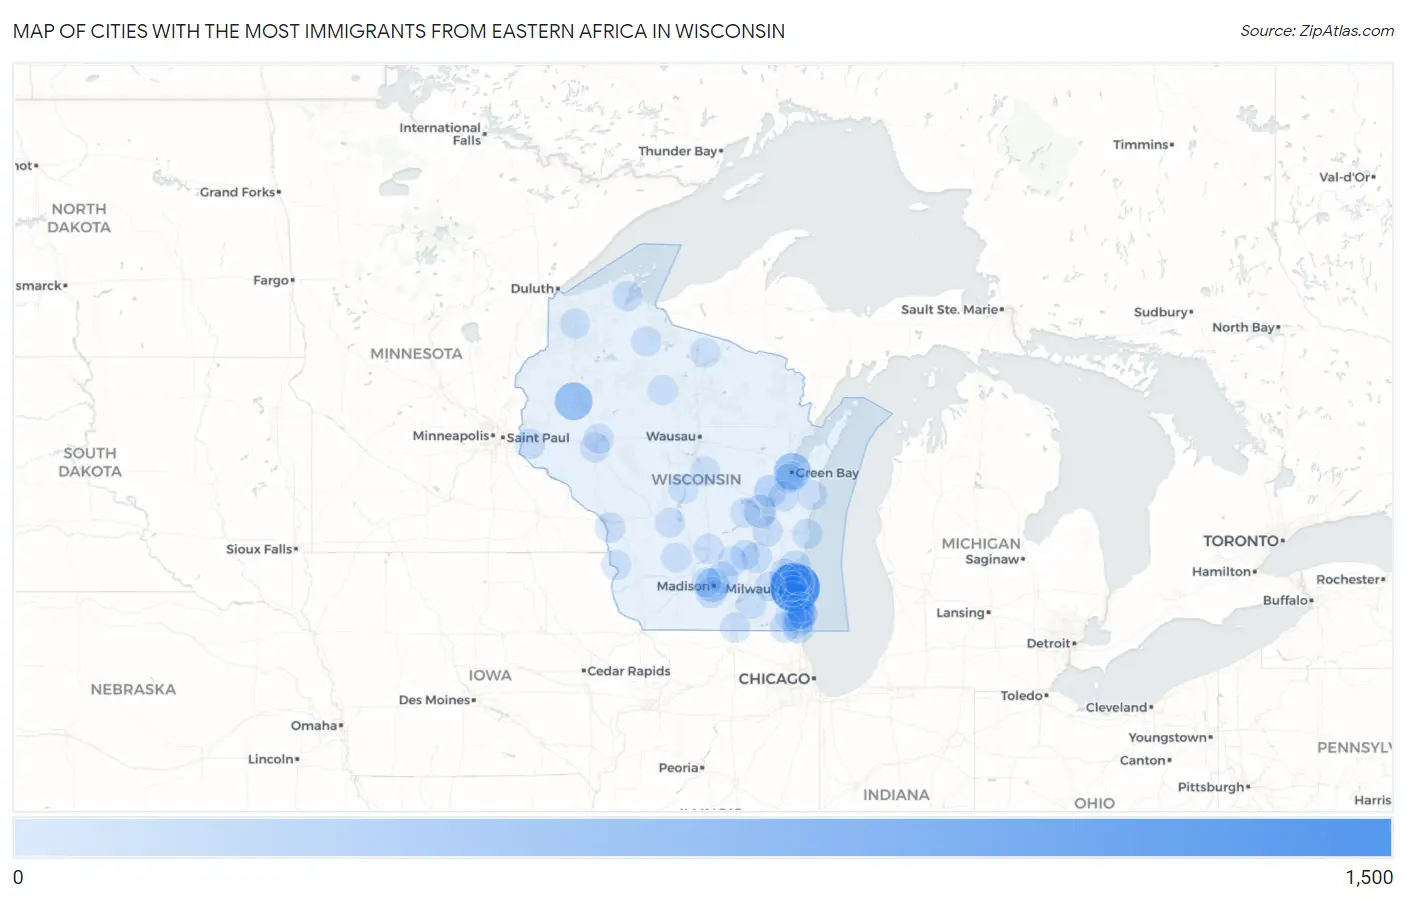
Map of Cities with the Most Immigrants from Eastern Africa in Wisconsin
0
1,500
Cities with the Most Immigrants from Eastern Africa in Wisconsin
| City | Eastern Africa | vs State | vs National | |
| 1. | Milwaukee | 1,482 | 4,776(31.03%)#1 | 752,337(0.20%)#78 |
| 2. | Barron | 560 | 4,776(11.73%)#2 | 752,337(0.07%)#226 |
| 3. | Green Bay | 480 | 4,776(10.05%)#3 | 752,337(0.06%)#252 |
| 4. | Madison | 270 | 4,776(5.65%)#4 | 752,337(0.04%)#418 |
| 5. | Oak Creek | 228 | 4,776(4.77%)#5 | 752,337(0.03%)#482 |
| 6. | Oshkosh | 194 | 4,776(4.06%)#6 | 752,337(0.03%)#548 |
| 7. | Appleton | 150 | 4,776(3.14%)#7 | 752,337(0.02%)#668 |
| 8. | Sun Prairie | 118 | 4,776(2.47%)#8 | 752,337(0.02%)#794 |
| 9. | Grafton | 107 | 4,776(2.24%)#9 | 752,337(0.01%)#860 |
| 10. | Pleasant Prairie | 98 | 4,776(2.05%)#10 | 752,337(0.01%)#904 |
| 11. | Fitchburg | 76 | 4,776(1.59%)#11 | 752,337(0.01%)#1,060 |
| 12. | Sturtevant | 66 | 4,776(1.38%)#12 | 752,337(0.01%)#1,172 |
| 13. | West Allis | 47 | 4,776(0.98%)#13 | 752,337(0.01%)#1,420 |
| 14. | Mount Pleasant | 46 | 4,776(0.96%)#14 | 752,337(0.01%)#1,437 |
| 15. | Horicon | 41 | 4,776(0.86%)#15 | 752,337(0.01%)#1,532 |
| 16. | Racine | 35 | 4,776(0.73%)#16 | 752,337(0.00%)#1,634 |
| 17. | La Crosse | 32 | 4,776(0.67%)#17 | 752,337(0.00%)#1,708 |
| 18. | Menomonee Falls | 29 | 4,776(0.61%)#18 | 752,337(0.00%)#1,786 |
| 19. | Fond Du Lac | 27 | 4,776(0.57%)#19 | 752,337(0.00%)#1,853 |
| 20. | Germantown | 25 | 4,776(0.52%)#20 | 752,337(0.00%)#1,922 |
| 21. | Shorewood | 25 | 4,776(0.52%)#21 | 752,337(0.00%)#1,925 |
| 22. | Somers | 22 | 4,776(0.46%)#22 | 752,337(0.00%)#2,052 |
| 23. | River Falls | 20 | 4,776(0.42%)#23 | 752,337(0.00%)#2,129 |
| 24. | Kenosha | 18 | 4,776(0.38%)#24 | 752,337(0.00%)#2,182 |
| 25. | Eau Claire | 18 | 4,776(0.38%)#25 | 752,337(0.00%)#2,186 |
| 26. | Whitewater | 18 | 4,776(0.38%)#26 | 752,337(0.00%)#2,205 |
| 27. | Greendale | 16 | 4,776(0.34%)#27 | 752,337(0.00%)#2,281 |
| 28. | Washburn | 16 | 4,776(0.34%)#28 | 752,337(0.00%)#2,300 |
| 29. | Salem Lakes | 14 | 4,776(0.29%)#29 | 752,337(0.00%)#2,386 |
| 30. | Sheboygan | 13 | 4,776(0.27%)#30 | 752,337(0.00%)#2,428 |
| 31. | Middleton | 11 | 4,776(0.23%)#31 | 752,337(0.00%)#2,552 |
| 32. | Chippewa Falls | 11 | 4,776(0.23%)#32 | 752,337(0.00%)#2,557 |
| 33. | Fox Point | 11 | 4,776(0.23%)#33 | 752,337(0.00%)#2,576 |
| 34. | Forest Junction | 11 | 4,776(0.23%)#34 | 752,337(0.00%)#2,602 |
| 35. | Eureka | 11 | 4,776(0.23%)#35 | 752,337(0.00%)#2,604 |
| 36. | Allouez | 10 | 4,776(0.21%)#36 | 752,337(0.00%)#2,634 |
| 37. | Wauwatosa | 9 | 4,776(0.19%)#37 | 752,337(0.00%)#2,675 |
| 38. | Portage | 9 | 4,776(0.19%)#38 | 752,337(0.00%)#2,712 |
| 39. | Caledonia | 8 | 4,776(0.17%)#39 | 752,337(0.00%)#2,766 |
| 40. | Stevens Point | 6 | 4,776(0.13%)#40 | 752,337(0.00%)#2,918 |
| 41. | Prentice | 6 | 4,776(0.13%)#41 | 752,337(0.00%)#2,994 |
| 42. | Beloit | 5 | 4,776(0.10%)#42 | 752,337(0.00%)#3,005 |
| 43. | Fall River | 4 | 4,776(0.08%)#43 | 752,337(0.00%)#3,145 |
| 44. | Solon Springs | 4 | 4,776(0.08%)#44 | 752,337(0.00%)#3,167 |
| 45. | De Pere | 3 | 4,776(0.06%)#45 | 752,337(0.00%)#3,190 |
| 46. | Nekoosa | 3 | 4,776(0.06%)#46 | 752,337(0.00%)#3,217 |
| 47. | Elmwood Park | 3 | 4,776(0.06%)#47 | 752,337(0.00%)#3,251 |
| 48. | Glidden | 3 | 4,776(0.06%)#48 | 752,337(0.00%)#3,259 |
| 49. | Sayner | 3 | 4,776(0.06%)#49 | 752,337(0.00%)#3,262 |
| 50. | Union Grove | 2 | 4,776(0.04%)#50 | 752,337(0.00%)#3,307 |
| 51. | West Milwaukee | 2 | 4,776(0.04%)#51 | 752,337(0.00%)#3,309 |
| 52. | River Hills | 2 | 4,776(0.04%)#52 | 752,337(0.00%)#3,315 |
| 53. | Mishicot | 2 | 4,776(0.04%)#53 | 752,337(0.00%)#3,320 |
| 54. | Loganville | 2 | 4,776(0.04%)#54 | 752,337(0.00%)#3,362 |
| 55. | Ferryville | 2 | 4,776(0.04%)#55 | 752,337(0.00%)#3,364 |
| 56. | Beaver Dam | 1 | 4,776(0.02%)#56 | 752,337(0.00%)#3,387 |
| 57. | Delafield | 1 | 4,776(0.02%)#57 | 752,337(0.00%)#3,424 |
| 58. | New Lisbon | 1 | 4,776(0.02%)#58 | 752,337(0.00%)#3,459 |
Common Questions
What are the Top 10 Cities with the Most Immigrants from Eastern Africa in Wisconsin?
Top 10 Cities with the Most Immigrants from Eastern Africa in Wisconsin are:
#1
1,482
#2
560
#3
480
#4
270
#5
228
#6
194
#7
150
#8
118
#9
107
#10
98
What city has the Most Immigrants from Eastern Africa in Wisconsin?
Milwaukee has the Most Immigrants from Eastern Africa in Wisconsin with 1,482.
What is the Total Immigrants from Eastern Africa in the State of Wisconsin?
Total Immigrants from Eastern Africa in Wisconsin is 4,776.
What is the Total Immigrants from Eastern Africa in the United States?
Total Immigrants from Eastern Africa in the United States is 752,337.