Sturgeon Bay, WI Map & Demographics
Sturgeon Bay Map
Sturgeon Bay Overview
$39,271
PER CAPITA INCOME
$77,414
AVG FAMILY INCOME
$55,791
AVG HOUSEHOLD INCOME
24.8%
WAGE / INCOME GAP [ % ]
75.2¢/ $1
WAGE / INCOME GAP [ $ ]
0.45
INEQUALITY / GINI INDEX
9,620
TOTAL POPULATION
4,624
MALE POPULATION
4,996
FEMALE POPULATION
92.55
MALES / 100 FEMALES
108.04
FEMALES / 100 MALES
46.2
MEDIAN AGE
2.8
AVG FAMILY SIZE
2.0
AVG HOUSEHOLD SIZE
5,075
LABOR FORCE [ PEOPLE ]
63.5%
PERCENT IN LABOR FORCE
5.0%
UNEMPLOYMENT RATE
Sturgeon Bay Zip Codes
Sturgeon Bay Area Codes
Income in Sturgeon Bay
Income Overview in Sturgeon Bay
Per Capita Income in Sturgeon Bay is $39,271, while median incomes of families and households are $77,414 and $55,791 respectively.
| Characteristic | Number | Measure |
| Per Capita Income | 9,620 | $39,271 |
| Median Family Income | 2,455 | $77,414 |
| Mean Family Income | 2,455 | $93,849 |
| Median Household Income | 4,632 | $55,791 |
| Mean Household Income | 4,632 | $77,549 |
| Income Deficit | 2,455 | $0 |
| Wage / Income Gap (%) | 9,620 | 24.83% |
| Wage / Income Gap ($) | 9,620 | 75.17¢ per $1 |
| Gini / Inequality Index | 9,620 | 0.45 |
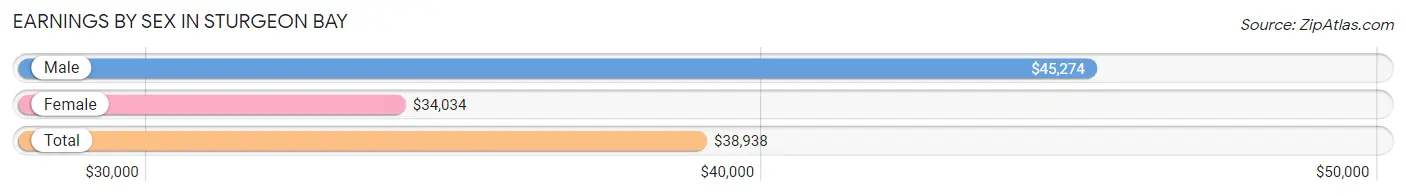
Earnings by Sex in Sturgeon Bay
Average Earnings in Sturgeon Bay are $38,938, $45,274 for men and $34,034 for women, a difference of 24.8%.
| Sex | Number | Average Earnings |
| Male | 2,805 (51.6%) | $45,274 |
| Female | 2,635 (48.4%) | $34,034 |
| Total | 5,440 (100.0%) | $38,938 |
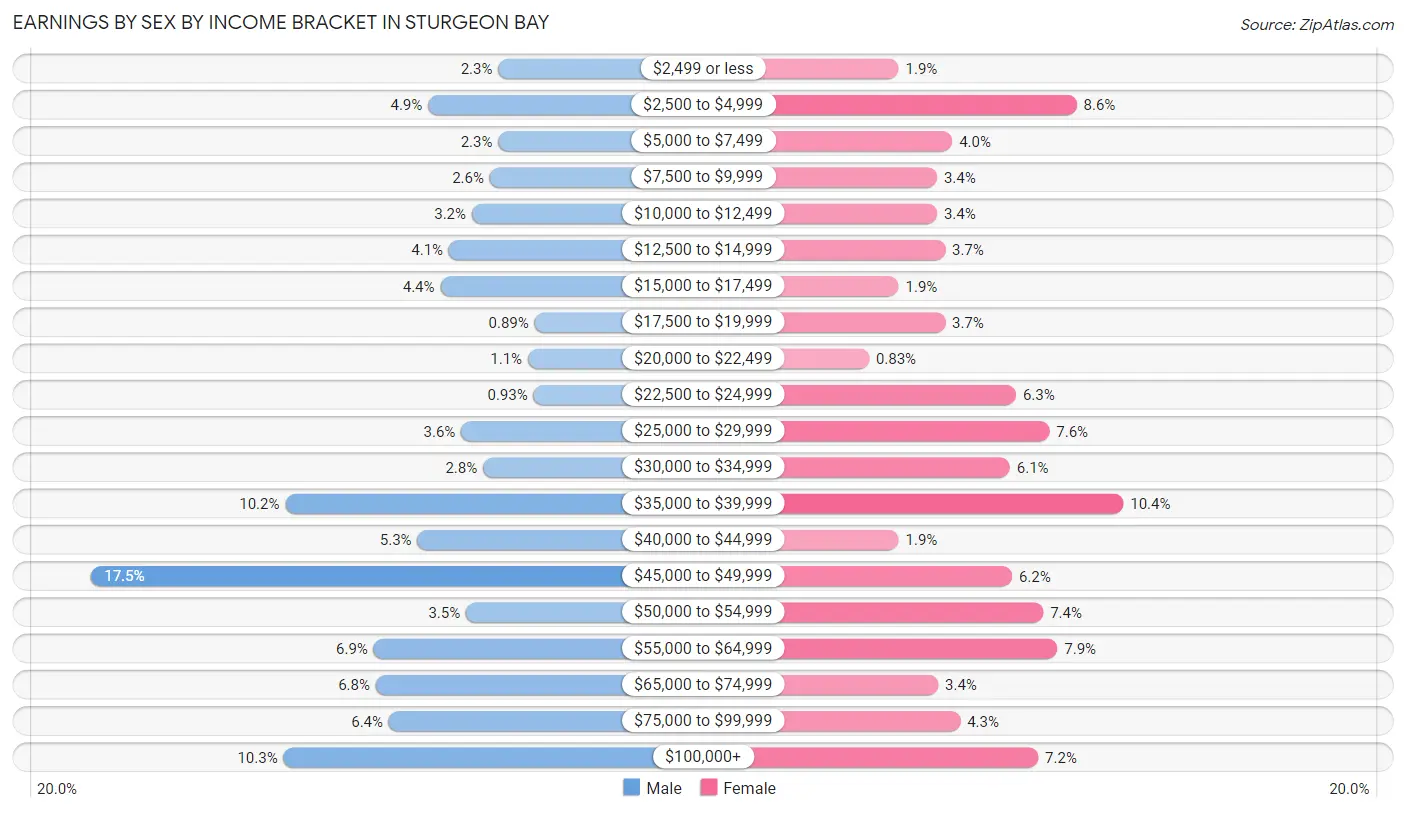
Earnings by Sex by Income Bracket in Sturgeon Bay
The most common earnings brackets in Sturgeon Bay are $45,000 to $49,999 for men (491 | 17.5%) and $35,000 to $39,999 for women (273 | 10.4%).
| Income | Male | Female |
| $2,499 or less | 63 (2.2%) | 51 (1.9%) |
| $2,500 to $4,999 | 137 (4.9%) | 227 (8.6%) |
| $5,000 to $7,499 | 63 (2.2%) | 104 (4.0%) |
| $7,500 to $9,999 | 72 (2.6%) | 89 (3.4%) |
| $10,000 to $12,499 | 91 (3.2%) | 89 (3.4%) |
| $12,500 to $14,999 | 115 (4.1%) | 97 (3.7%) |
| $15,000 to $17,499 | 124 (4.4%) | 51 (1.9%) |
| $17,500 to $19,999 | 25 (0.9%) | 97 (3.7%) |
| $20,000 to $22,499 | 32 (1.1%) | 22 (0.8%) |
| $22,500 to $24,999 | 26 (0.9%) | 167 (6.3%) |
| $25,000 to $29,999 | 102 (3.6%) | 200 (7.6%) |
| $30,000 to $34,999 | 79 (2.8%) | 161 (6.1%) |
| $35,000 to $39,999 | 287 (10.2%) | 273 (10.4%) |
| $40,000 to $44,999 | 148 (5.3%) | 51 (1.9%) |
| $45,000 to $49,999 | 491 (17.5%) | 163 (6.2%) |
| $50,000 to $54,999 | 97 (3.5%) | 194 (7.4%) |
| $55,000 to $64,999 | 194 (6.9%) | 208 (7.9%) |
| $65,000 to $74,999 | 192 (6.8%) | 90 (3.4%) |
| $75,000 to $99,999 | 178 (6.4%) | 112 (4.3%) |
| $100,000+ | 289 (10.3%) | 189 (7.2%) |
| Total | 2,805 (100.0%) | 2,635 (100.0%) |
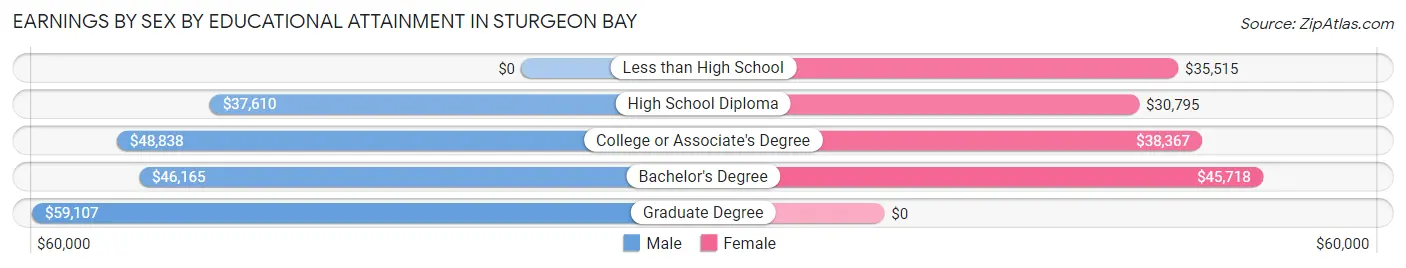
Earnings by Sex by Educational Attainment in Sturgeon Bay
Average earnings in Sturgeon Bay are $46,385 for men and $35,772 for women, a difference of 22.9%. Men with an educational attainment of graduate degree enjoy the highest average annual earnings of $59,107, while those with high school diploma education earn the least with $37,610. Women with an educational attainment of bachelor's degree earn the most with the average annual earnings of $45,718, while those with high school diploma education have the smallest earnings of $30,795.
| Educational Attainment | Male Income | Female Income |
| Less than High School | - | - |
| High School Diploma | $37,610 | $30,795 |
| College or Associate's Degree | $48,838 | $38,367 |
| Bachelor's Degree | $46,165 | $45,718 |
| Graduate Degree | $59,107 | $0 |
| Total | $46,385 | $35,772 |
Family Income in Sturgeon Bay
Family Income Brackets in Sturgeon Bay
According to the Sturgeon Bay family income data, there are 560 families falling into the $50,000 to $74,999 income range, which is the most common income bracket and makes up 22.8% of all families. Conversely, the $25,000 to $34,999 income bracket is the least frequent group with only 44 families (1.8%) belonging to this category.
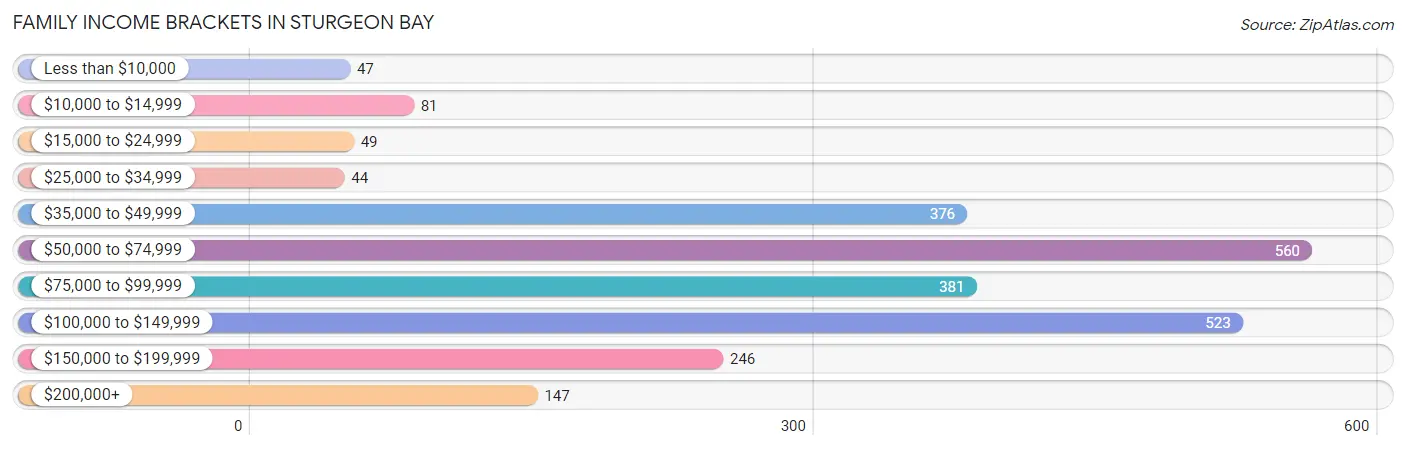
| Income Bracket | # Families | % Families |
| Less than $10,000 | 47 | 1.9% |
| $10,000 to $14,999 | 81 | 3.3% |
| $15,000 to $24,999 | 49 | 2.0% |
| $25,000 to $34,999 | 44 | 1.8% |
| $35,000 to $49,999 | 376 | 15.3% |
| $50,000 to $74,999 | 560 | 22.8% |
| $75,000 to $99,999 | 381 | 15.5% |
| $100,000 to $149,999 | 523 | 21.3% |
| $150,000 to $199,999 | 246 | 10.0% |
| $200,000+ | 147 | 6.0% |
Family Income by Famaliy Size in Sturgeon Bay
4-person families (429 | 17.5%) account for the highest median family income in Sturgeon Bay with $105,990 per family, while 2-person families (1,311 | 53.4%) have the highest median income of $36,234 per family member.
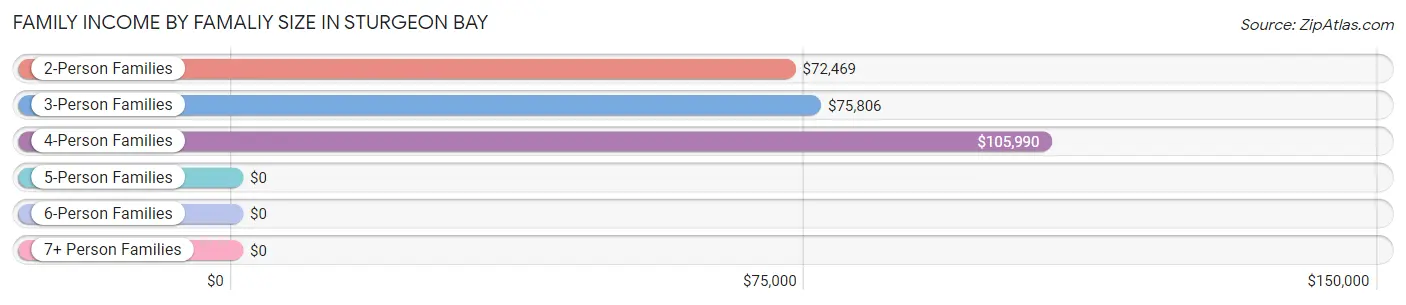
| Income Bracket | # Families | Median Income |
| 2-Person Families | 1,311 (53.4%) | $72,469 |
| 3-Person Families | 490 (20.0%) | $75,806 |
| 4-Person Families | 429 (17.5%) | $105,990 |
| 5-Person Families | 204 (8.3%) | $0 |
| 6-Person Families | 21 (0.9%) | $0 |
| 7+ Person Families | 0 (0.0%) | $0 |
| Total | 2,455 (100.0%) | $77,414 |
Family Income by Number of Earners in Sturgeon Bay
The median family income in Sturgeon Bay is $77,414, with families comprising 3+ earners (195) having the highest median family income of $137,404, while families with no earners (280) have the lowest median family income of $44,300, accounting for 7.9% and 11.4% of families, respectively.
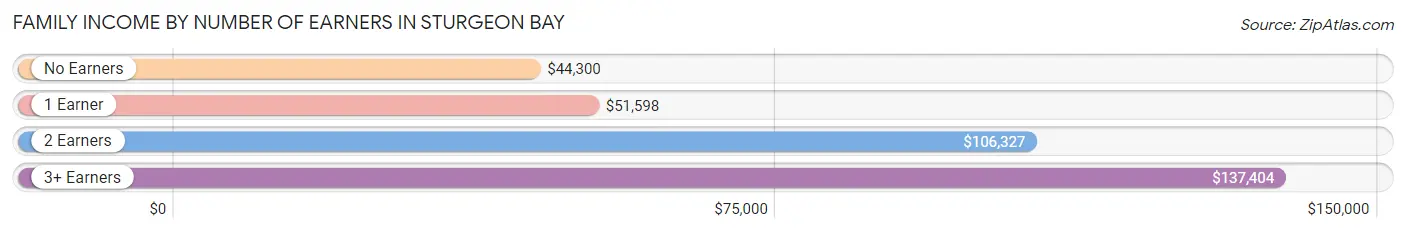
| Number of Earners | # Families | Median Income |
| No Earners | 280 (11.4%) | $44,300 |
| 1 Earner | 918 (37.4%) | $51,598 |
| 2 Earners | 1,062 (43.3%) | $106,327 |
| 3+ Earners | 195 (7.9%) | $137,404 |
| Total | 2,455 (100.0%) | $77,414 |
Household Income in Sturgeon Bay
Household Income Brackets in Sturgeon Bay
With 991 households falling in the category, the $50,000 to $74,999 income range is the most frequent in Sturgeon Bay, accounting for 21.4% of all households. In contrast, only 185 households (4.0%) fall into the $200,000+ income bracket, making it the least populous group.
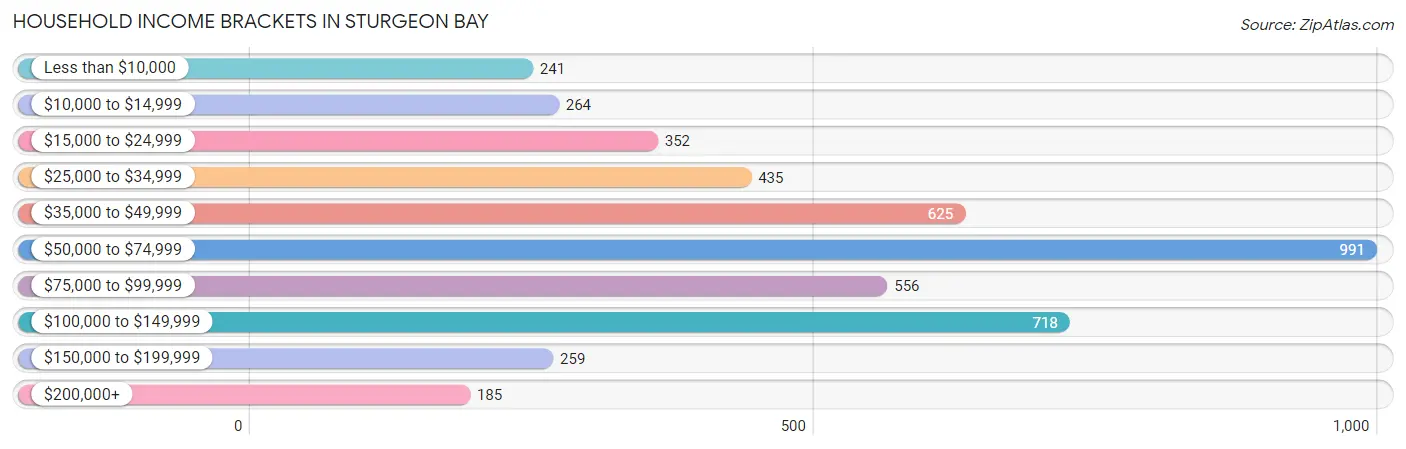
| Income Bracket | # Households | % Households |
| Less than $10,000 | 241 | 5.2% |
| $10,000 to $14,999 | 264 | 5.7% |
| $15,000 to $24,999 | 352 | 7.6% |
| $25,000 to $34,999 | 435 | 9.4% |
| $35,000 to $49,999 | 625 | 13.5% |
| $50,000 to $74,999 | 991 | 21.4% |
| $75,000 to $99,999 | 556 | 12.0% |
| $100,000 to $149,999 | 718 | 15.5% |
| $150,000 to $199,999 | 259 | 5.6% |
| $200,000+ | 185 | 4.0% |
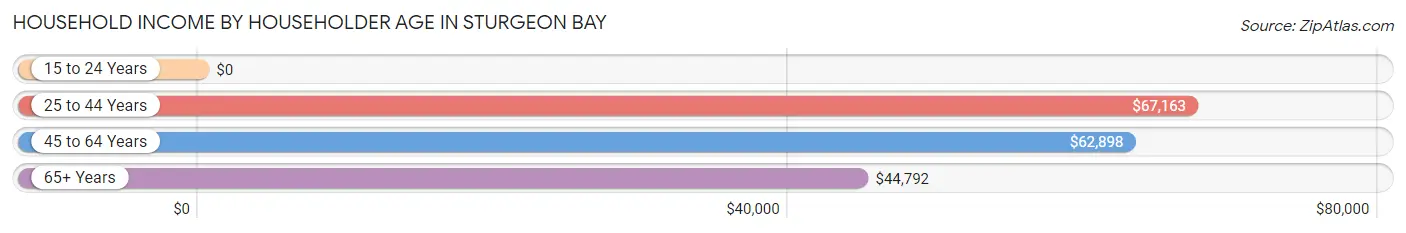
Household Income by Householder Age in Sturgeon Bay
The median household income in Sturgeon Bay is $55,791, with the highest median household income of $67,163 found in the 25 to 44 years age bracket for the primary householder. A total of 1,092 households (23.6%) fall into this category. Meanwhile, the 15 to 24 years age bracket for the primary householder has the lowest median household income of $0, with 105 households (2.3%) in this group.
| Income Bracket | # Households | Median Income |
| 15 to 24 Years | 105 (2.3%) | $0 |
| 25 to 44 Years | 1,092 (23.6%) | $67,163 |
| 45 to 64 Years | 1,867 (40.3%) | $62,898 |
| 65+ Years | 1,568 (33.9%) | $44,792 |
| Total | 4,632 (100.0%) | $55,791 |
Poverty in Sturgeon Bay
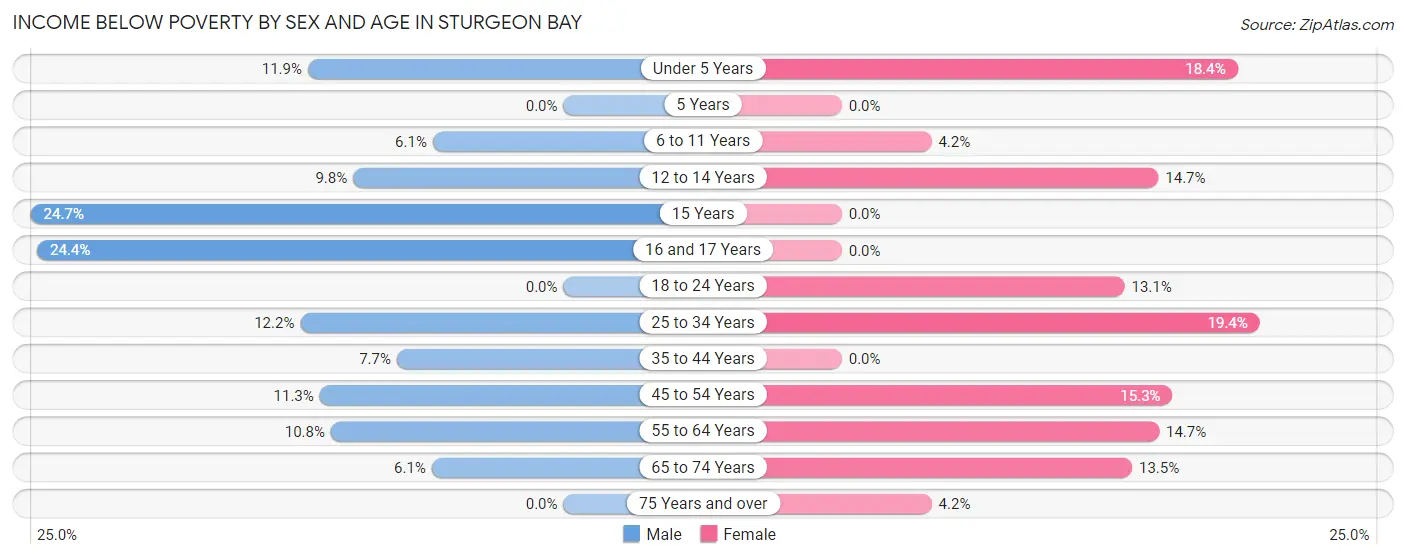
Income Below Poverty by Sex and Age in Sturgeon Bay
With 8.8% poverty level for males and 11.6% for females among the residents of Sturgeon Bay, 15 year old males and 25 to 34 year old females are the most vulnerable to poverty, with 22 males (24.7%) and 114 females (19.4%) in their respective age groups living below the poverty level.
| Age Bracket | Male | Female |
| Under 5 Years | 21 (11.9%) | 38 (18.4%) |
| 5 Years | 0 (0.0%) | 0 (0.0%) |
| 6 to 11 Years | 14 (6.1%) | 16 (4.2%) |
| 12 to 14 Years | 33 (9.8%) | 21 (14.7%) |
| 15 Years | 22 (24.7%) | 0 (0.0%) |
| 16 and 17 Years | 21 (24.4%) | 0 (0.0%) |
| 18 to 24 Years | 0 (0.0%) | 29 (13.1%) |
| 25 to 34 Years | 58 (12.2%) | 114 (19.4%) |
| 35 to 44 Years | 48 (7.7%) | 0 (0.0%) |
| 45 to 54 Years | 63 (11.3%) | 81 (15.3%) |
| 55 to 64 Years | 86 (10.8%) | 131 (14.7%) |
| 65 to 74 Years | 35 (6.1%) | 120 (13.5%) |
| 75 Years and over | 0 (0.0%) | 18 (4.2%) |
| Total | 401 (8.8%) | 568 (11.6%) |
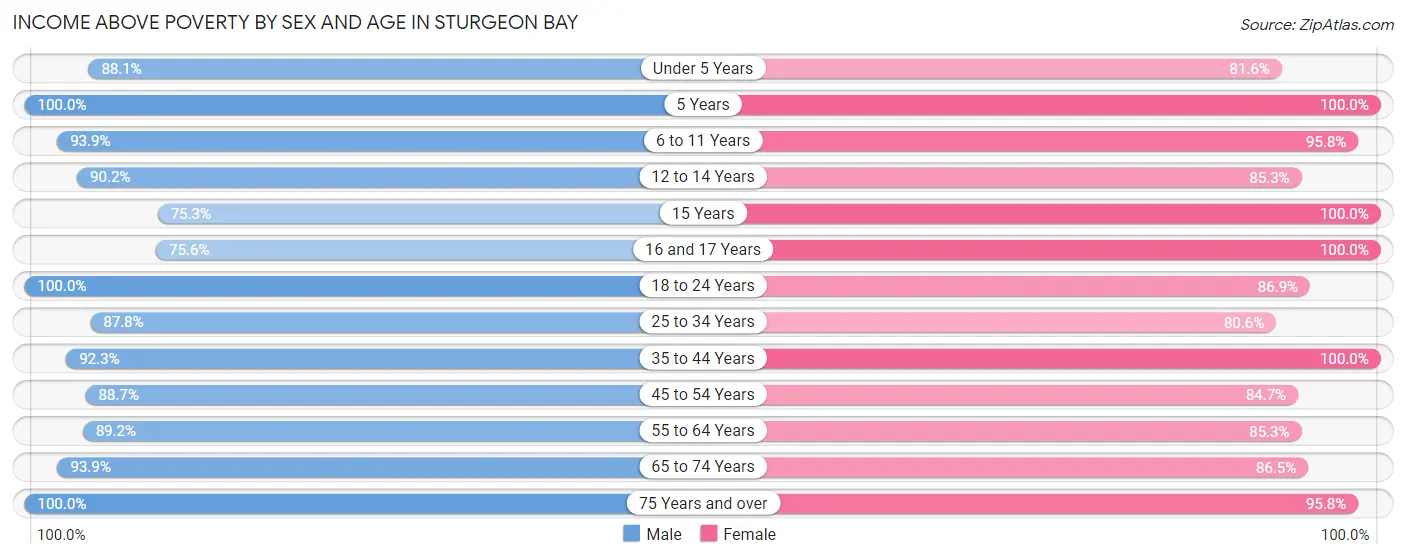
Income Above Poverty by Sex and Age in Sturgeon Bay
According to the poverty statistics in Sturgeon Bay, males aged 5 years and females aged 5 years are the age groups that are most secure financially, with 100.0% of males and 100.0% of females in these age groups living above the poverty line.
| Age Bracket | Male | Female |
| Under 5 Years | 156 (88.1%) | 169 (81.6%) |
| 5 Years | 17 (100.0%) | 16 (100.0%) |
| 6 to 11 Years | 217 (93.9%) | 369 (95.8%) |
| 12 to 14 Years | 305 (90.2%) | 122 (85.3%) |
| 15 Years | 67 (75.3%) | 25 (100.0%) |
| 16 and 17 Years | 65 (75.6%) | 49 (100.0%) |
| 18 to 24 Years | 288 (100.0%) | 192 (86.9%) |
| 25 to 34 Years | 417 (87.8%) | 474 (80.6%) |
| 35 to 44 Years | 573 (92.3%) | 531 (100.0%) |
| 45 to 54 Years | 494 (88.7%) | 447 (84.7%) |
| 55 to 64 Years | 711 (89.2%) | 759 (85.3%) |
| 65 to 74 Years | 538 (93.9%) | 771 (86.5%) |
| 75 Years and over | 309 (100.0%) | 414 (95.8%) |
| Total | 4,157 (91.2%) | 4,338 (88.4%) |
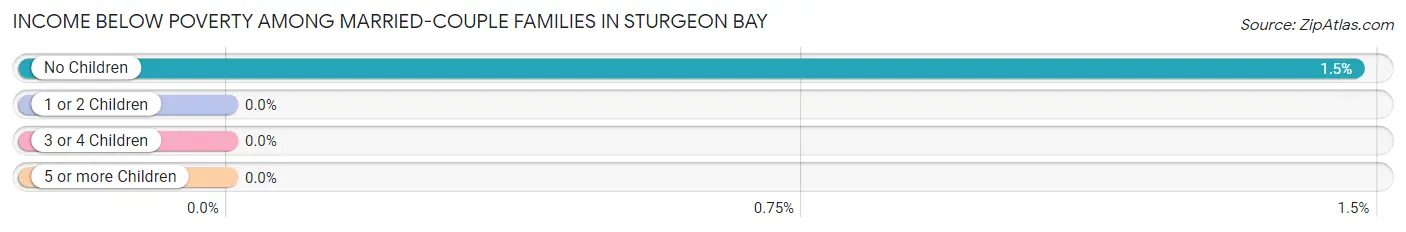
Income Below Poverty Among Married-Couple Families in Sturgeon Bay
The poverty statistics for married-couple families in Sturgeon Bay show that 0.9% or 18 of the total 1,905 families live below the poverty line. Families with no children have the highest poverty rate of 1.5%, comprising of 18 families. On the other hand, families with 1 or 2 children have the lowest poverty rate of 0.0%, which includes 0 families.
| Children | Above Poverty | Below Poverty |
| No Children | 1,205 (98.5%) | 18 (1.5%) |
| 1 or 2 Children | 478 (100.0%) | 0 (0.0%) |
| 3 or 4 Children | 204 (100.0%) | 0 (0.0%) |
| 5 or more Children | 0 (0.0%) | 0 (0.0%) |
| Total | 1,887 (99.1%) | 18 (0.9%) |
Income Below Poverty Among Single-Parent Households in Sturgeon Bay
According to the poverty data in Sturgeon Bay, 28.4% or 33 single-father households and 21.2% or 92 single-mother households are living below the poverty line. Among single-father households, those with 1 or 2 children have the highest poverty rate, with 33 households (100.0%) experiencing poverty. Likewise, among single-mother households, those with 3 or 4 children have the highest poverty rate, with 20 households (100.0%) falling below the poverty line.
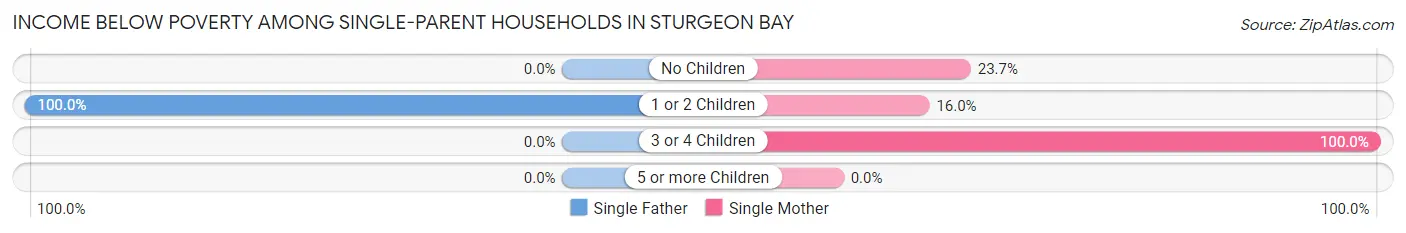
| Children | Single Father | Single Mother |
| No Children | 0 (0.0%) | 18 (23.7%) |
| 1 or 2 Children | 33 (100.0%) | 54 (16.0%) |
| 3 or 4 Children | 0 (0.0%) | 20 (100.0%) |
| 5 or more Children | 0 (0.0%) | 0 (0.0%) |
| Total | 33 (28.4%) | 92 (21.2%) |
Income Below Poverty Among Married-Couple vs Single-Parent Households in Sturgeon Bay
The poverty data for Sturgeon Bay shows that 18 of the married-couple family households (0.9%) and 125 of the single-parent households (22.7%) are living below the poverty level. Within the married-couple family households, those with no children have the highest poverty rate, with 18 households (1.5%) falling below the poverty line. Among the single-parent households, those with 3 or 4 children have the highest poverty rate, with 20 household (30.8%) living below poverty.
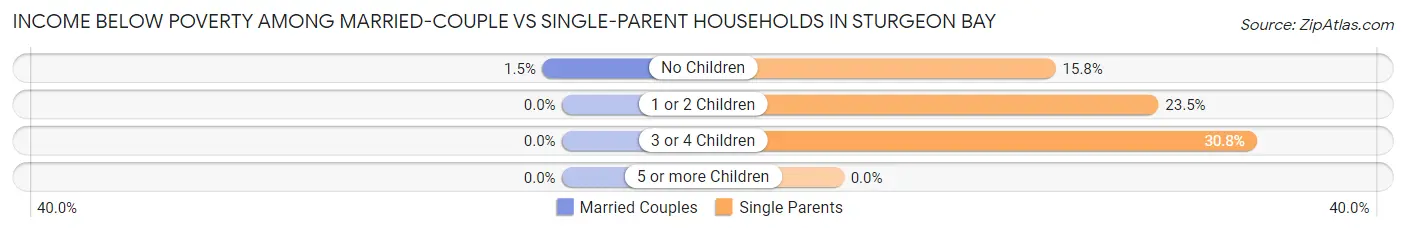
| Children | Married-Couple Families | Single-Parent Households |
| No Children | 18 (1.5%) | 18 (15.8%) |
| 1 or 2 Children | 0 (0.0%) | 87 (23.4%) |
| 3 or 4 Children | 0 (0.0%) | 20 (30.8%) |
| 5 or more Children | 0 (0.0%) | 0 (0.0%) |
| Total | 18 (0.9%) | 125 (22.7%) |
Race in Sturgeon Bay
The most populous races in Sturgeon Bay are White / Caucasian (8,765 | 91.1%), Two or more Races (459 | 4.8%), and Hispanic or Latino (359 | 3.7%).
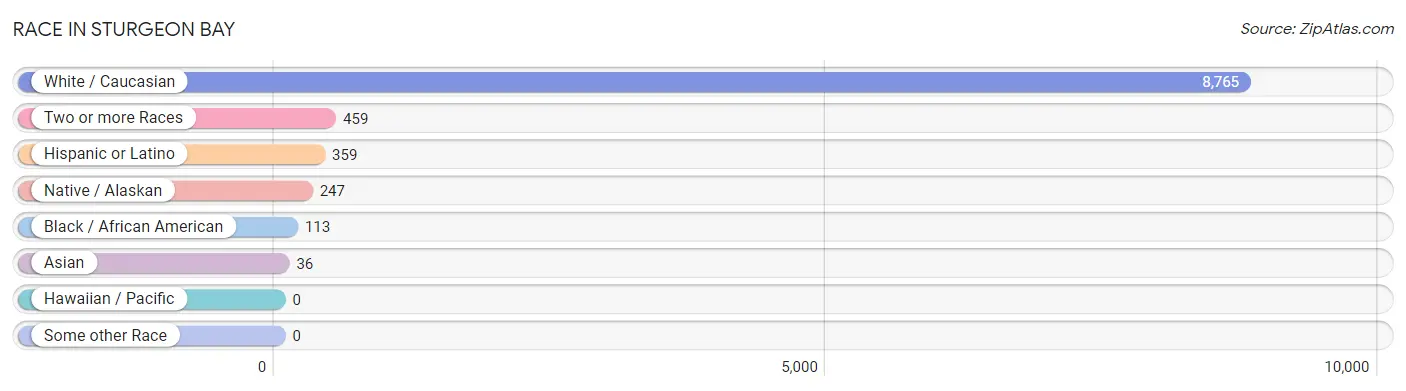
| Race | # Population | % Population |
| Asian | 36 | 0.4% |
| Black / African American | 113 | 1.2% |
| Hawaiian / Pacific | 0 | 0.0% |
| Hispanic or Latino | 359 | 3.7% |
| Native / Alaskan | 247 | 2.6% |
| White / Caucasian | 8,765 | 91.1% |
| Two or more Races | 459 | 4.8% |
| Some other Race | 0 | 0.0% |
| Total | 9,620 | 100.0% |
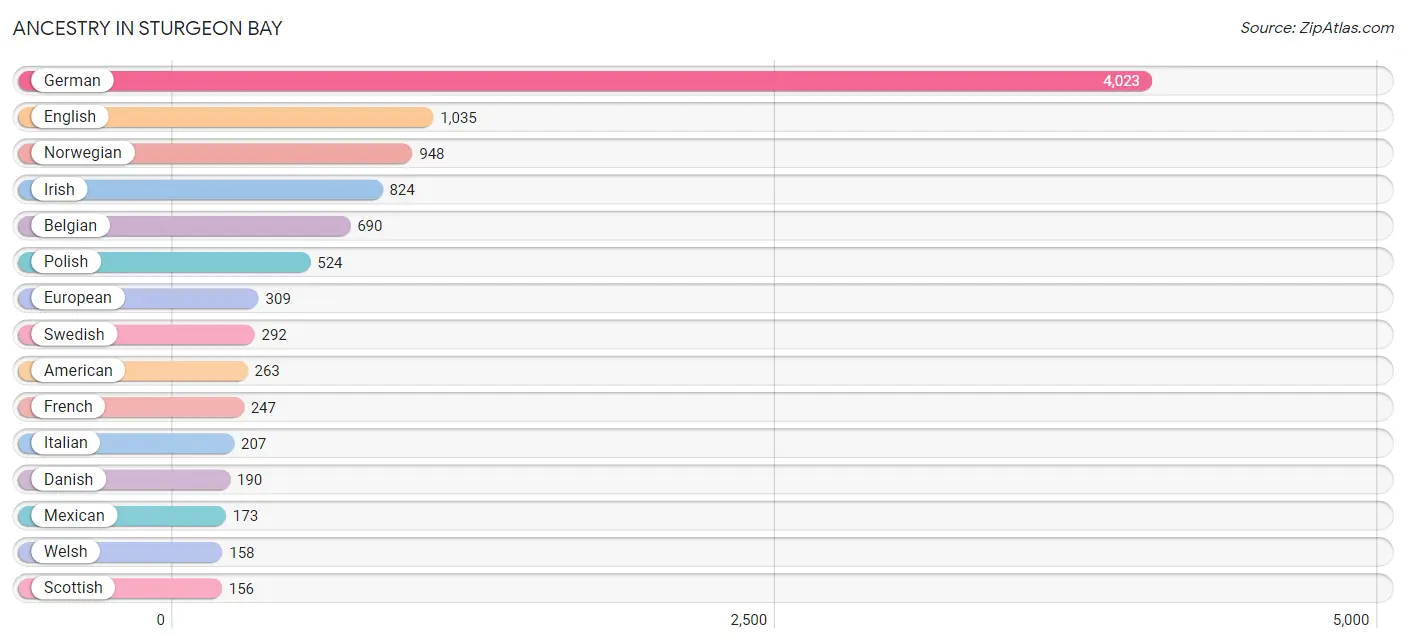
Ancestry in Sturgeon Bay
The most populous ancestries reported in Sturgeon Bay are German (4,023 | 41.8%), English (1,035 | 10.8%), Norwegian (948 | 9.9%), Irish (824 | 8.6%), and Belgian (690 | 7.2%), together accounting for 78.2% of all Sturgeon Bay residents.
| Ancestry | # Population | % Population |
| Alsatian | 23 | 0.2% |
| American | 263 | 2.7% |
| Austrian | 50 | 0.5% |
| Belgian | 690 | 7.2% |
| British | 14 | 0.2% |
| Chilean | 13 | 0.1% |
| Chippewa | 23 | 0.2% |
| Czech | 106 | 1.1% |
| Danish | 190 | 2.0% |
| Dutch | 92 | 1.0% |
| English | 1,035 | 10.8% |
| European | 309 | 3.2% |
| Finnish | 66 | 0.7% |
| French | 247 | 2.6% |
| French Canadian | 46 | 0.5% |
| German | 4,023 | 41.8% |
| Greek | 27 | 0.3% |
| Guyanese | 1 | 0.0% |
| Hungarian | 19 | 0.2% |
| Indian (Asian) | 10 | 0.1% |
| Irish | 824 | 8.6% |
| Iroquois | 133 | 1.4% |
| Italian | 207 | 2.1% |
| Korean | 8 | 0.1% |
| Luxembourger | 1 | 0.0% |
| Menominee | 3 | 0.0% |
| Mexican | 173 | 1.8% |
| Mexican American Indian | 58 | 0.6% |
| Northern European | 77 | 0.8% |
| Norwegian | 948 | 9.9% |
| Pakistani | 10 | 0.1% |
| Peruvian | 19 | 0.2% |
| Polish | 524 | 5.4% |
| Russian | 114 | 1.2% |
| Scandinavian | 90 | 0.9% |
| Scotch-Irish | 70 | 0.7% |
| Scottish | 156 | 1.6% |
| Serbian | 17 | 0.2% |
| Sioux | 1 | 0.0% |
| Slovene | 17 | 0.2% |
| South American | 32 | 0.3% |
| Spanish | 17 | 0.2% |
| Swedish | 292 | 3.0% |
| Swiss | 103 | 1.1% |
| Thai | 8 | 0.1% |
| Welsh | 158 | 1.6% | View All 46 Rows |
Immigrants in Sturgeon Bay
The most numerous immigrant groups reported in Sturgeon Bay came from Latin America (93 | 1.0%), Central America (58 | 0.6%), Mexico (58 | 0.6%), Asia (35 | 0.4%), and South America (35 | 0.4%), together accounting for 2.9% of all Sturgeon Bay residents.
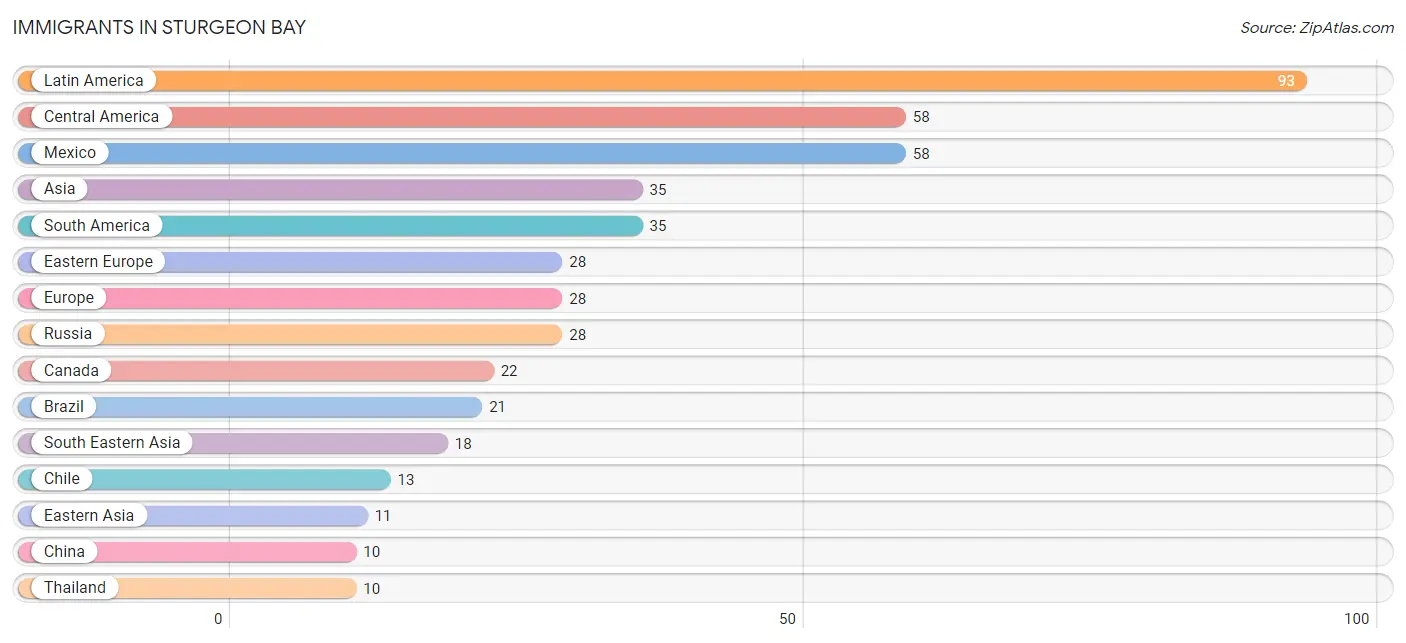
| Immigration Origin | # Population | % Population |
| Asia | 35 | 0.4% |
| Brazil | 21 | 0.2% |
| Canada | 22 | 0.2% |
| Central America | 58 | 0.6% |
| Chile | 13 | 0.1% |
| China | 10 | 0.1% |
| Eastern Asia | 11 | 0.1% |
| Eastern Europe | 28 | 0.3% |
| Europe | 28 | 0.3% |
| Guyana | 1 | 0.0% |
| India | 6 | 0.1% |
| Korea | 1 | 0.0% |
| Latin America | 93 | 1.0% |
| Mexico | 58 | 0.6% |
| Philippines | 8 | 0.1% |
| Russia | 28 | 0.3% |
| South America | 35 | 0.4% |
| South Central Asia | 6 | 0.1% |
| South Eastern Asia | 18 | 0.2% |
| Thailand | 10 | 0.1% | View All 20 Rows |
Sex and Age in Sturgeon Bay
Sex and Age in Sturgeon Bay
The most populous age groups in Sturgeon Bay are 60 to 64 Years (451 | 9.8%) for men and 60 to 64 Years (503 | 10.1%) for women.
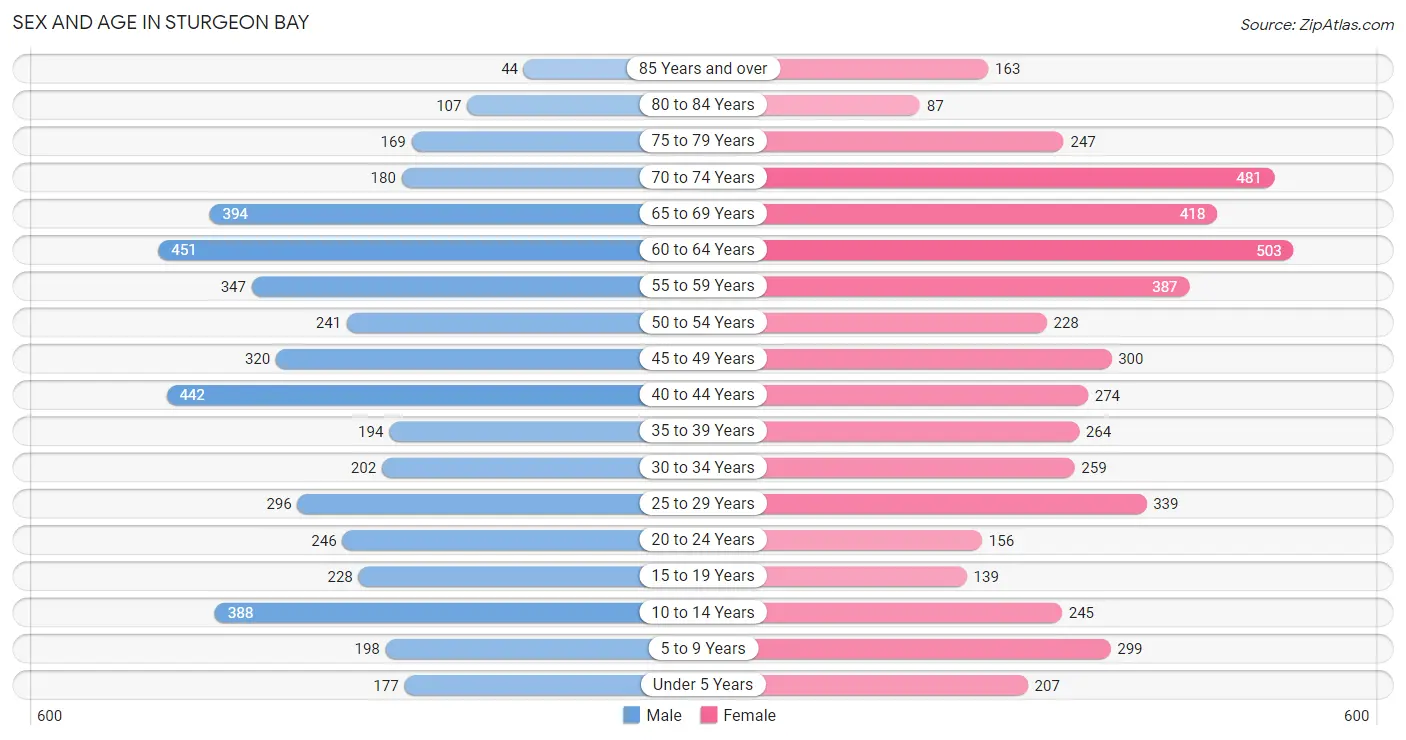
| Age Bracket | Male | Female |
| Under 5 Years | 177 (3.8%) | 207 (4.1%) |
| 5 to 9 Years | 198 (4.3%) | 299 (6.0%) |
| 10 to 14 Years | 388 (8.4%) | 245 (4.9%) |
| 15 to 19 Years | 228 (4.9%) | 139 (2.8%) |
| 20 to 24 Years | 246 (5.3%) | 156 (3.1%) |
| 25 to 29 Years | 296 (6.4%) | 339 (6.8%) |
| 30 to 34 Years | 202 (4.4%) | 259 (5.2%) |
| 35 to 39 Years | 194 (4.2%) | 264 (5.3%) |
| 40 to 44 Years | 442 (9.6%) | 274 (5.5%) |
| 45 to 49 Years | 320 (6.9%) | 300 (6.0%) |
| 50 to 54 Years | 241 (5.2%) | 228 (4.6%) |
| 55 to 59 Years | 347 (7.5%) | 387 (7.7%) |
| 60 to 64 Years | 451 (9.8%) | 503 (10.1%) |
| 65 to 69 Years | 394 (8.5%) | 418 (8.4%) |
| 70 to 74 Years | 180 (3.9%) | 481 (9.6%) |
| 75 to 79 Years | 169 (3.6%) | 247 (4.9%) |
| 80 to 84 Years | 107 (2.3%) | 87 (1.7%) |
| 85 Years and over | 44 (0.9%) | 163 (3.3%) |
| Total | 4,624 (100.0%) | 4,996 (100.0%) |
Families and Households in Sturgeon Bay
Median Family Size in Sturgeon Bay
The median family size in Sturgeon Bay is 2.76 persons per family, with single male/father families (116 | 4.7%) accounting for the largest median family size of 2.94 persons per family. On the other hand, single female/mother families (434 | 17.7%) represent the smallest median family size with 2.62 persons per family.
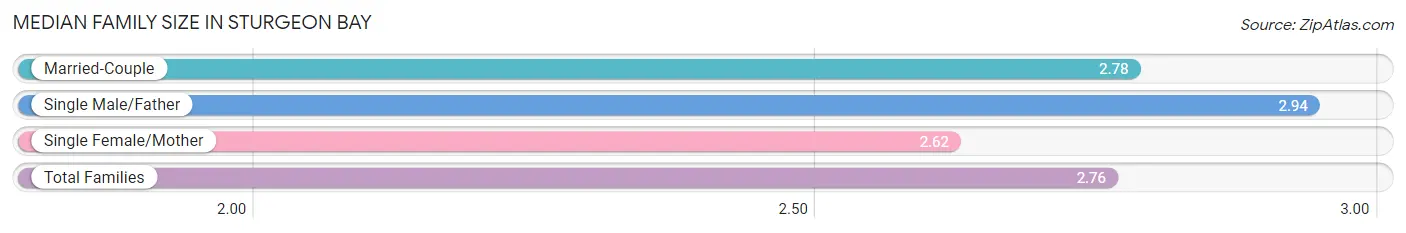
| Family Type | # Families | Family Size |
| Married-Couple | 1,905 (77.6%) | 2.78 |
| Single Male/Father | 116 (4.7%) | 2.94 |
| Single Female/Mother | 434 (17.7%) | 2.62 |
| Total Families | 2,455 (100.0%) | 2.76 |
Median Household Size in Sturgeon Bay
The median household size in Sturgeon Bay is 2.04 persons per household, with single male/father households (116 | 2.5%) accounting for the largest median household size of 3.34 persons per household. non-family households (2,177 | 47.0%) represent the smallest median household size with 1.12 persons per household.
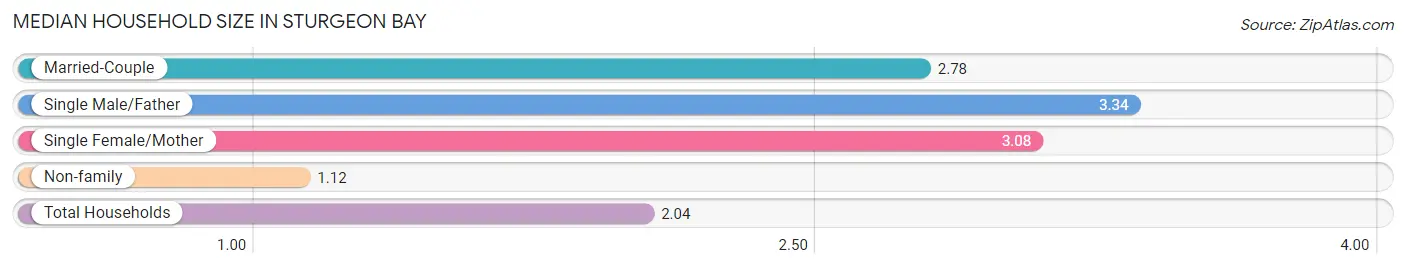
| Household Type | # Households | Household Size |
| Married-Couple | 1,905 (41.1%) | 2.78 |
| Single Male/Father | 116 (2.5%) | 3.34 |
| Single Female/Mother | 434 (9.4%) | 3.08 |
| Non-family | 2,177 (47.0%) | 1.12 |
| Total Households | 4,632 (100.0%) | 2.04 |
Household Size by Marriage Status in Sturgeon Bay
Out of a total of 4,632 households in Sturgeon Bay, 2,455 (53.0%) are family households, while 2,177 (47.0%) are nonfamily households. The most numerous type of family households are 2-person households, comprising 1,214, and the most common type of nonfamily households are 1-person households, comprising 2,021.
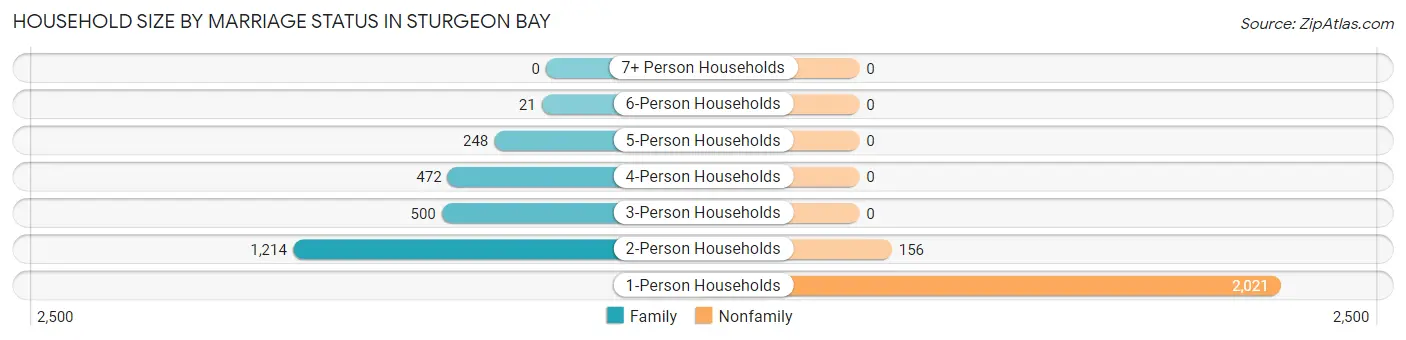
| Household Size | Family Households | Nonfamily Households |
| 1-Person Households | - | 2,021 (43.6%) |
| 2-Person Households | 1,214 (26.2%) | 156 (3.4%) |
| 3-Person Households | 500 (10.8%) | 0 (0.0%) |
| 4-Person Households | 472 (10.2%) | 0 (0.0%) |
| 5-Person Households | 248 (5.3%) | 0 (0.0%) |
| 6-Person Households | 21 (0.4%) | 0 (0.0%) |
| 7+ Person Households | 0 (0.0%) | 0 (0.0%) |
| Total | 2,455 (53.0%) | 2,177 (47.0%) |
Female Fertility in Sturgeon Bay
Fertility by Age in Sturgeon Bay
Average fertility rate in Sturgeon Bay is 93.0 births per 1,000 women. Women in the age bracket of 20 to 34 years have the highest fertility rate with 215.0 births per 1,000 women. Women in the age bracket of 20 to 34 years acount for 100.0% of all women with births.
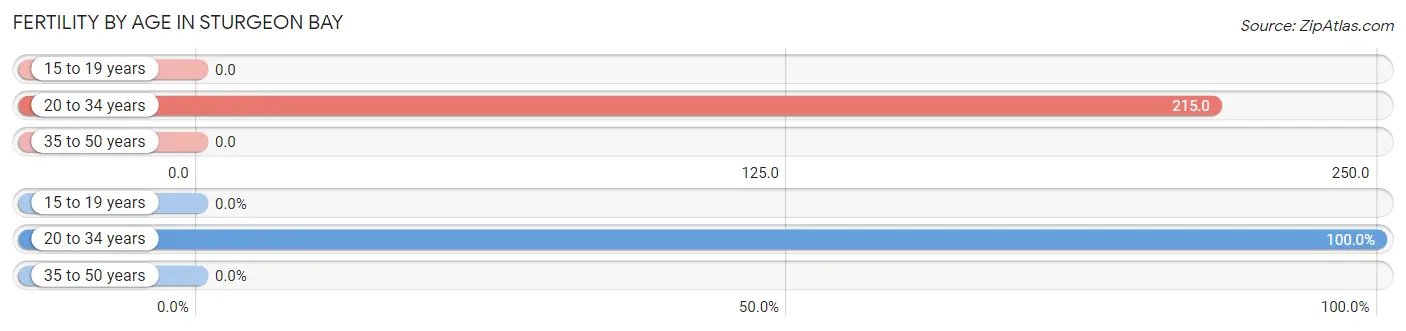
| Age Bracket | Women with Births | Births / 1,000 Women |
| 15 to 19 years | 0 (0.0%) | 0.0 |
| 20 to 34 years | 162 (100.0%) | 215.0 |
| 35 to 50 years | 0 (0.0%) | 0.0 |
| Total | 162 (100.0%) | 93.0 |
Fertility by Age by Marriage Status in Sturgeon Bay
53.7% of women with births (162) in Sturgeon Bay are married. The highest percentage of unmarried women with births falls into 20 to 34 years age bracket with 46.3% of them unmarried at the time of birth, while the lowest percentage of unmarried women with births belong to 20 to 34 years age bracket with 46.3% of them unmarried.
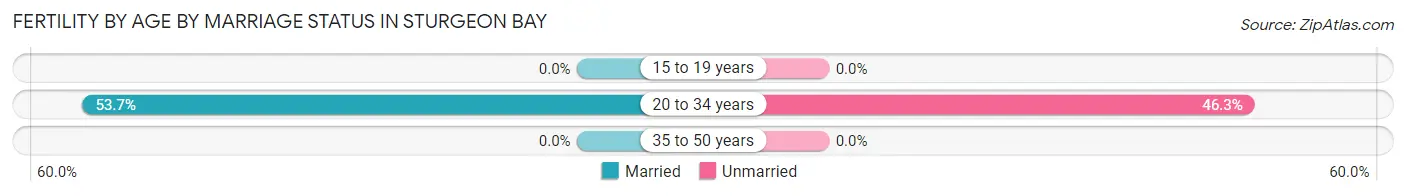
| Age Bracket | Married | Unmarried |
| 15 to 19 years | 0 (0.0%) | 0 (0.0%) |
| 20 to 34 years | 87 (53.7%) | 75 (46.3%) |
| 35 to 50 years | 0 (0.0%) | 0 (0.0%) |
| Total | 87 (53.7%) | 75 (46.3%) |
Fertility by Education in Sturgeon Bay
Average fertility rate in Sturgeon Bay is 93.0 births per 1,000 women. Women with the education attainment of high school diploma have the highest fertility rate of 299.0 births per 1,000 women, while women with the education attainment of graduate degree have the lowest fertility at 7.0 births per 1,000 women. Women with the education attainment of high school diploma represent 46.3% of all women with births.
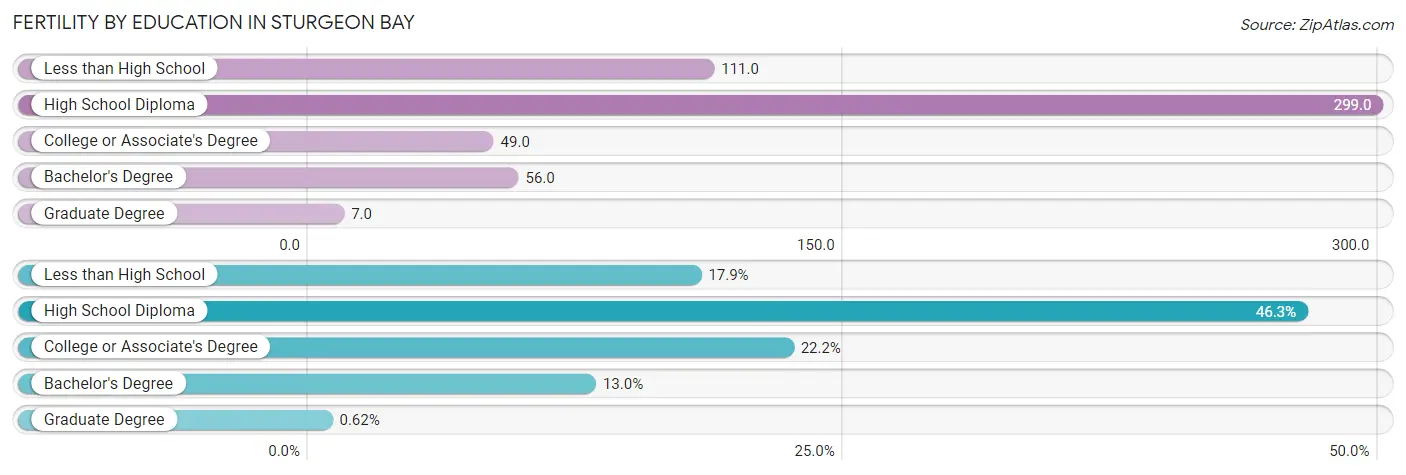
| Educational Attainment | Women with Births | Births / 1,000 Women |
| Less than High School | 29 (17.9%) | 111.0 |
| High School Diploma | 75 (46.3%) | 299.0 |
| College or Associate's Degree | 36 (22.2%) | 49.0 |
| Bachelor's Degree | 21 (13.0%) | 56.0 |
| Graduate Degree | 1 (0.6%) | 7.0 |
| Total | 162 (100.0%) | 93.0 |
Fertility by Education by Marriage Status in Sturgeon Bay
46.3% of women with births in Sturgeon Bay are unmarried. Women with the educational attainment of less than high school are most likely to be married with 100.0% of them married at childbirth, while women with the educational attainment of high school diploma are least likely to be married with 100.0% of them unmarried at childbirth.
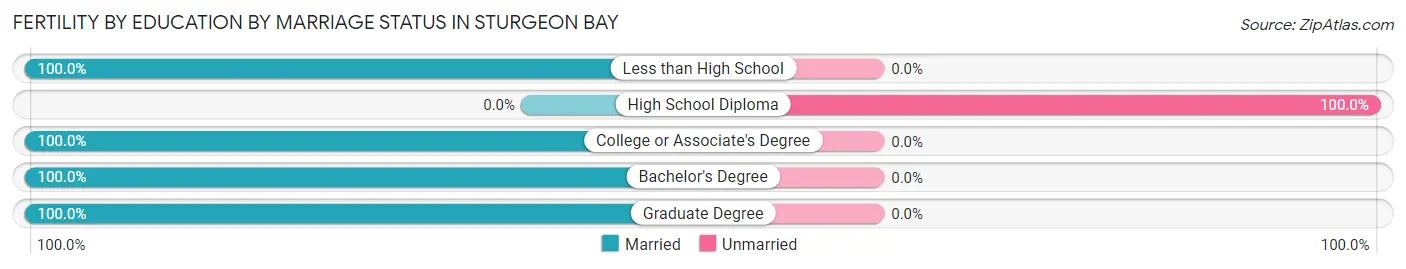
| Educational Attainment | Married | Unmarried |
| Less than High School | 29 (100.0%) | 0 (0.0%) |
| High School Diploma | 0 (0.0%) | 75 (100.0%) |
| College or Associate's Degree | 36 (100.0%) | 0 (0.0%) |
| Bachelor's Degree | 21 (100.0%) | 0 (0.0%) |
| Graduate Degree | 1 (100.0%) | 0 (0.0%) |
| Total | 87 (53.7%) | 75 (46.3%) |
Employment Characteristics in Sturgeon Bay
Employment by Class of Employer in Sturgeon Bay
Among the 4,737 employed individuals in Sturgeon Bay, private company employees (3,063 | 64.7%), not-for-profit organizations (580 | 12.2%), and local government employees (477 | 10.1%) make up the most common classes of employment.
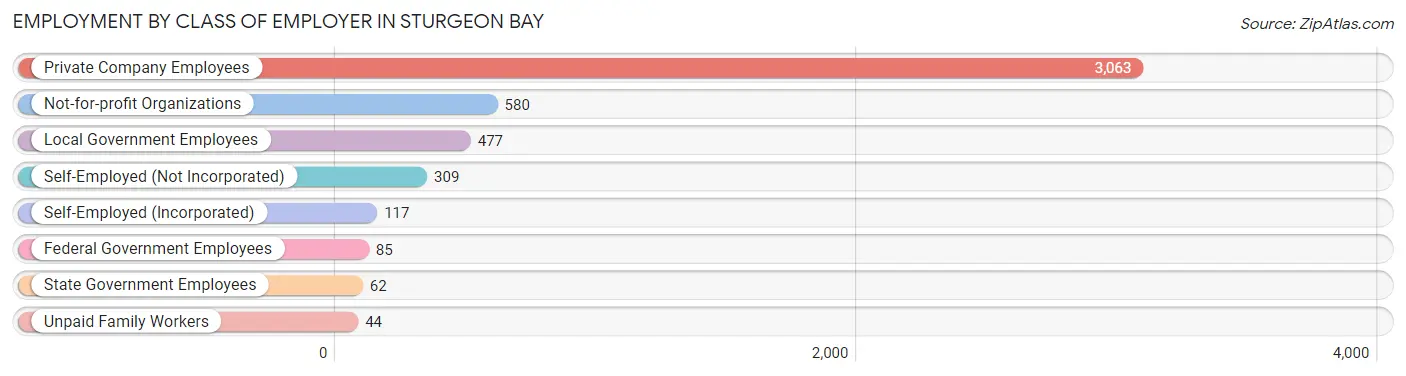
| Employer Class | # Employees | % Employees |
| Private Company Employees | 3,063 | 64.7% |
| Self-Employed (Incorporated) | 117 | 2.5% |
| Self-Employed (Not Incorporated) | 309 | 6.5% |
| Not-for-profit Organizations | 580 | 12.2% |
| Local Government Employees | 477 | 10.1% |
| State Government Employees | 62 | 1.3% |
| Federal Government Employees | 85 | 1.8% |
| Unpaid Family Workers | 44 | 0.9% |
| Total | 4,737 | 100.0% |
Employment Status by Age in Sturgeon Bay
According to the labor force statistics for Sturgeon Bay, out of the total population over 16 years of age (7,992), 63.5% or 5,075 individuals are in the labor force, with 5.0% or 254 of them unemployed. The age group with the highest labor force participation rate is 25 to 29 years, with 88.8% or 564 individuals in the labor force. Within the labor force, the 20 to 24 years age range has the highest percentage of unemployed individuals, with 16.5% or 56 of them being unemployed.
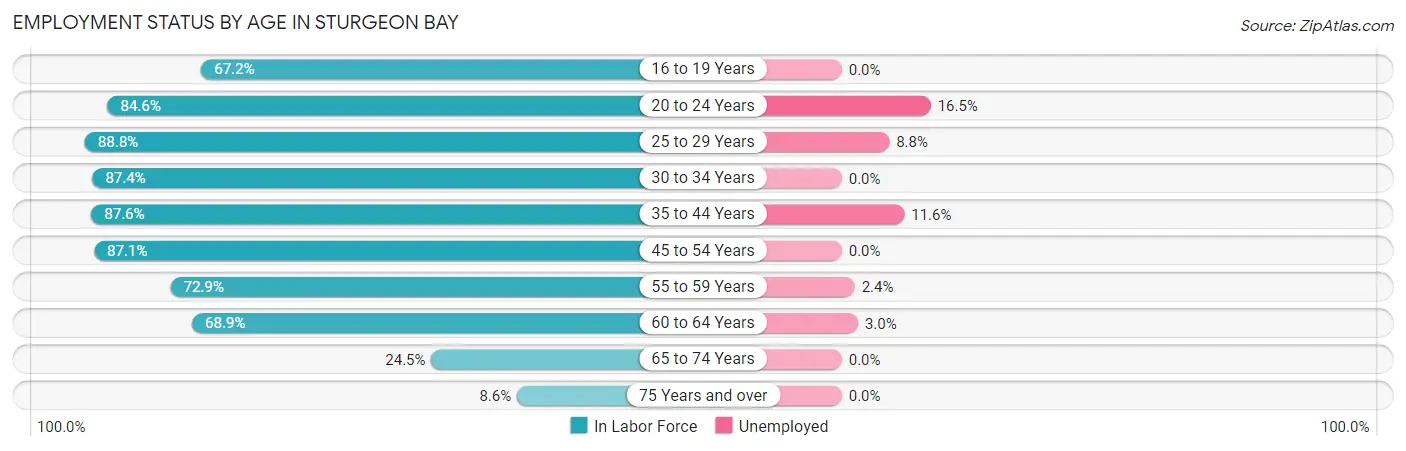
| Age Bracket | In Labor Force | Unemployed |
| 16 to 19 Years | 170 (67.2%) | 0 (0.0%) |
| 20 to 24 Years | 340 (84.6%) | 56 (16.5%) |
| 25 to 29 Years | 564 (88.8%) | 50 (8.8%) |
| 30 to 34 Years | 403 (87.4%) | 0 (0.0%) |
| 35 to 44 Years | 1,028 (87.6%) | 119 (11.6%) |
| 45 to 54 Years | 949 (87.1%) | 0 (0.0%) |
| 55 to 59 Years | 535 (72.9%) | 13 (2.4%) |
| 60 to 64 Years | 657 (68.9%) | 20 (3.0%) |
| 65 to 74 Years | 361 (24.5%) | 0 (0.0%) |
| 75 Years and over | 70 (8.6%) | 0 (0.0%) |
| Total | 5,075 (63.5%) | 254 (5.0%) |
Employment Status by Educational Attainment in Sturgeon Bay
According to labor force statistics for Sturgeon Bay, 81.9% of individuals (4,133) out of the total population between 25 and 64 years of age (5,047) are in the labor force, with 4.8% or 198 of them being unemployed. The group with the highest labor force participation rate are those with the educational attainment of bachelor's degree or higher, with 88.5% or 978 individuals in the labor force. Within the labor force, individuals with college / associate degree education have the highest percentage of unemployment, with 8.1% or 145 of them being unemployed.
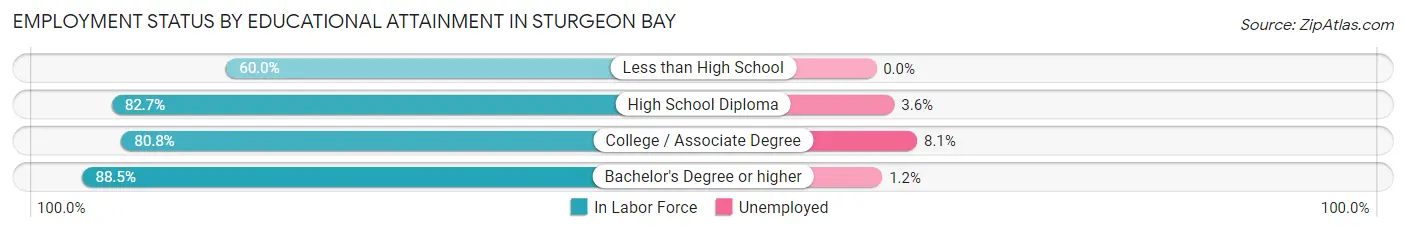
| Educational Attainment | In Labor Force | Unemployed |
| Less than High School | 156 (60.0%) | 0 (0.0%) |
| High School Diploma | 1,209 (82.7%) | 53 (3.6%) |
| College / Associate Degree | 1,794 (80.8%) | 180 (8.1%) |
| Bachelor's Degree or higher | 978 (88.5%) | 13 (1.2%) |
| Total | 4,133 (81.9%) | 242 (4.8%) |
Employment Occupations by Sex in Sturgeon Bay
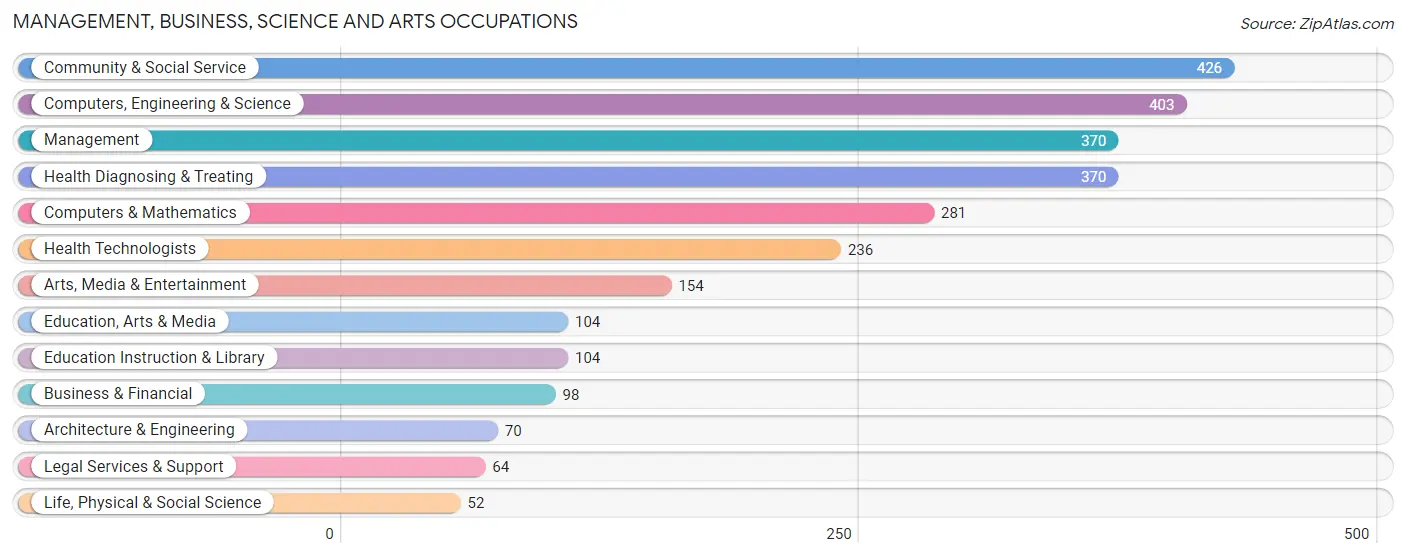
Management, Business, Science and Arts Occupations
The most common Management, Business, Science and Arts occupations in Sturgeon Bay are Community & Social Service (426 | 8.9%), Computers, Engineering & Science (403 | 8.4%), Management (370 | 7.7%), Health Diagnosing & Treating (370 | 7.7%), and Computers & Mathematics (281 | 5.9%).
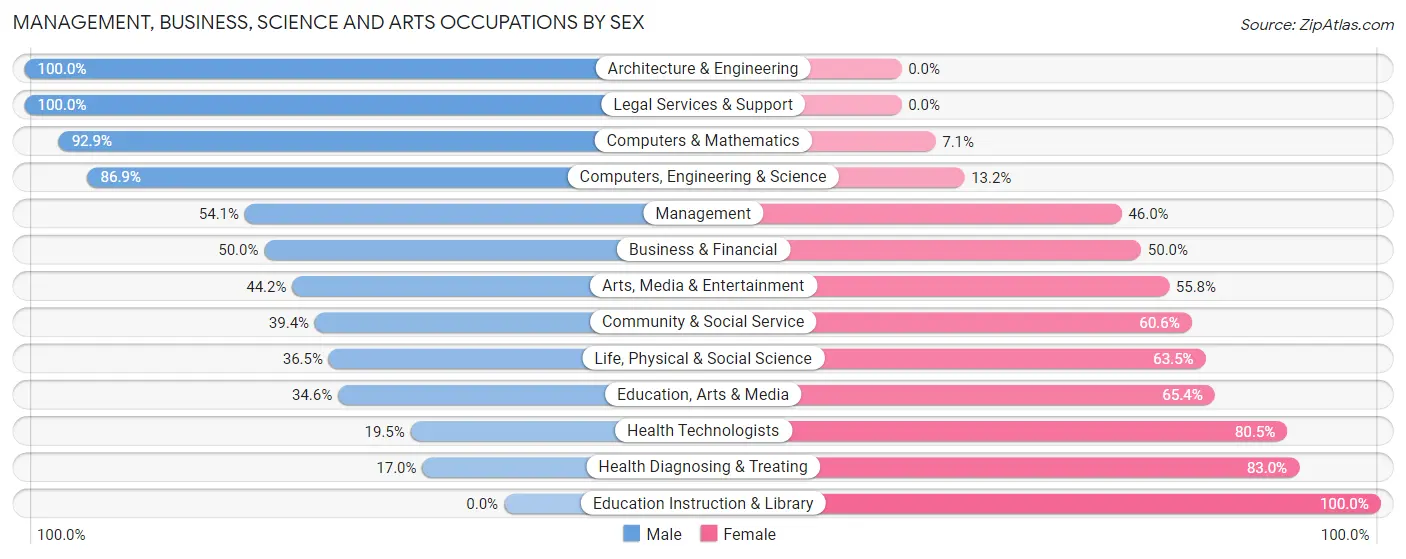
Management, Business, Science and Arts Occupations by Sex
Within the Management, Business, Science and Arts occupations in Sturgeon Bay, the most male-oriented occupations are Architecture & Engineering (100.0%), Legal Services & Support (100.0%), and Computers & Mathematics (92.9%), while the most female-oriented occupations are Education Instruction & Library (100.0%), Health Diagnosing & Treating (83.0%), and Health Technologists (80.5%).
| Occupation | Male | Female |
| Management | 200 (54.0%) | 170 (46.0%) |
| Business & Financial | 49 (50.0%) | 49 (50.0%) |
| Computers, Engineering & Science | 350 (86.9%) | 53 (13.2%) |
| Computers & Mathematics | 261 (92.9%) | 20 (7.1%) |
| Architecture & Engineering | 70 (100.0%) | 0 (0.0%) |
| Life, Physical & Social Science | 19 (36.5%) | 33 (63.5%) |
| Community & Social Service | 168 (39.4%) | 258 (60.6%) |
| Education, Arts & Media | 36 (34.6%) | 68 (65.4%) |
| Legal Services & Support | 64 (100.0%) | 0 (0.0%) |
| Education Instruction & Library | 0 (0.0%) | 104 (100.0%) |
| Arts, Media & Entertainment | 68 (44.2%) | 86 (55.8%) |
| Health Diagnosing & Treating | 63 (17.0%) | 307 (83.0%) |
| Health Technologists | 46 (19.5%) | 190 (80.5%) |
| Total (Category) | 830 (49.8%) | 837 (50.2%) |
| Total (Overall) | 2,455 (51.2%) | 2,335 (48.7%) |
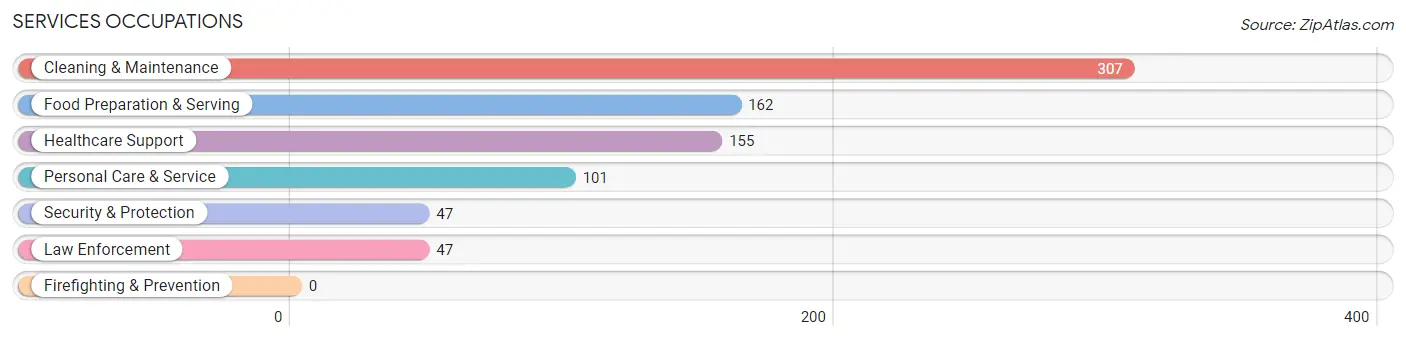
Services Occupations
The most common Services occupations in Sturgeon Bay are Cleaning & Maintenance (307 | 6.4%), Food Preparation & Serving (162 | 3.4%), Healthcare Support (155 | 3.2%), Personal Care & Service (101 | 2.1%), and Security & Protection (47 | 1.0%).
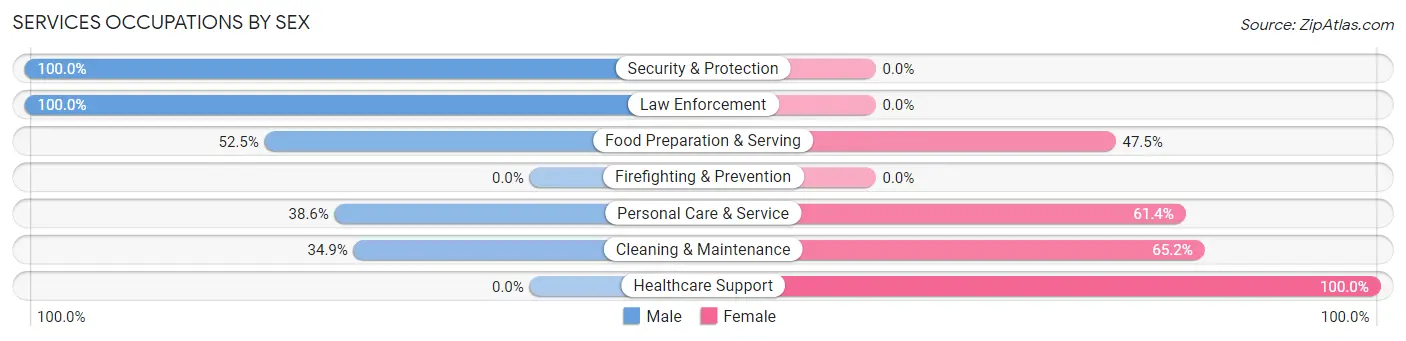
Services Occupations by Sex
Within the Services occupations in Sturgeon Bay, the most male-oriented occupations are Security & Protection (100.0%), Law Enforcement (100.0%), and Food Preparation & Serving (52.5%), while the most female-oriented occupations are Healthcare Support (100.0%), Cleaning & Maintenance (65.1%), and Personal Care & Service (61.4%).
| Occupation | Male | Female |
| Healthcare Support | 0 (0.0%) | 155 (100.0%) |
| Security & Protection | 47 (100.0%) | 0 (0.0%) |
| Firefighting & Prevention | 0 (0.0%) | 0 (0.0%) |
| Law Enforcement | 47 (100.0%) | 0 (0.0%) |
| Food Preparation & Serving | 85 (52.5%) | 77 (47.5%) |
| Cleaning & Maintenance | 107 (34.8%) | 200 (65.1%) |
| Personal Care & Service | 39 (38.6%) | 62 (61.4%) |
| Total (Category) | 278 (36.0%) | 494 (64.0%) |
| Total (Overall) | 2,455 (51.2%) | 2,335 (48.7%) |
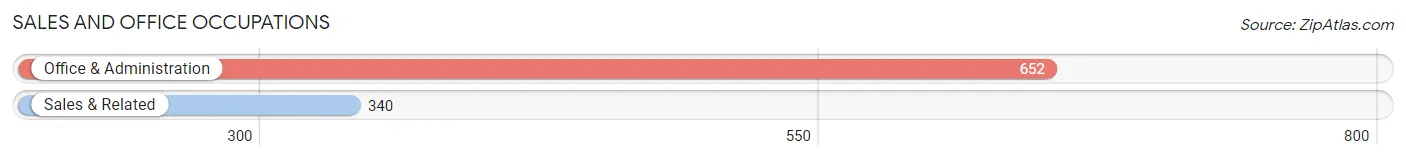
Sales and Office Occupations
The most common Sales and Office occupations in Sturgeon Bay are Office & Administration (652 | 13.6%), and Sales & Related (340 | 7.1%).
Sales and Office Occupations by Sex
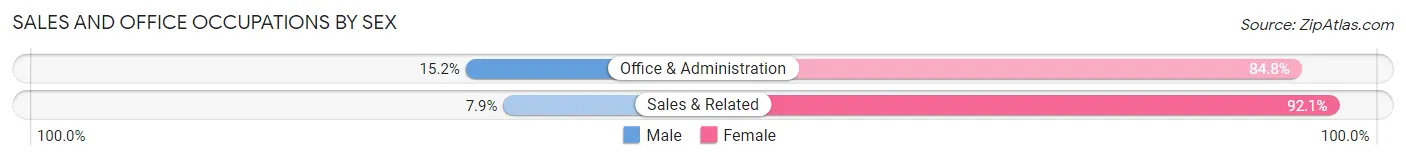
| Occupation | Male | Female |
| Sales & Related | 27 (7.9%) | 313 (92.1%) |
| Office & Administration | 99 (15.2%) | 553 (84.8%) |
| Total (Category) | 126 (12.7%) | 866 (87.3%) |
| Total (Overall) | 2,455 (51.2%) | 2,335 (48.7%) |
Natural Resources, Construction and Maintenance Occupations
The most common Natural Resources, Construction and Maintenance occupations in Sturgeon Bay are Construction & Extraction (359 | 7.5%), and Installation, Maintenance & Repair (223 | 4.7%).
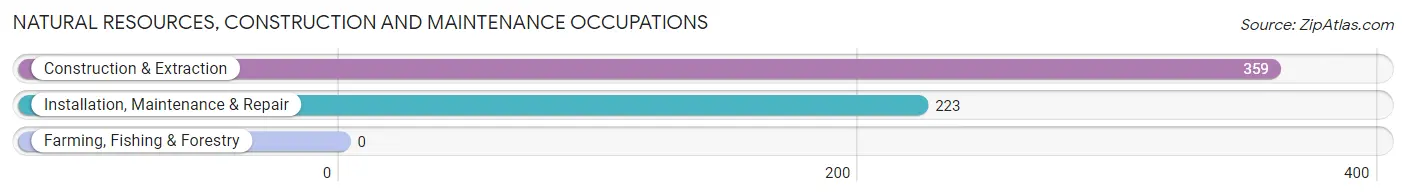
Natural Resources, Construction and Maintenance Occupations by Sex
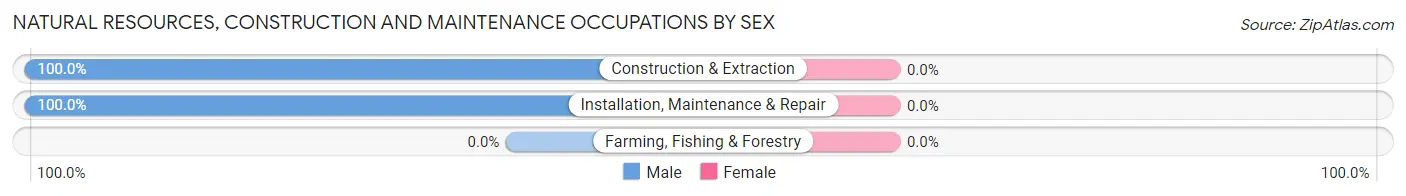
| Occupation | Male | Female |
| Farming, Fishing & Forestry | 0 (0.0%) | 0 (0.0%) |
| Construction & Extraction | 359 (100.0%) | 0 (0.0%) |
| Installation, Maintenance & Repair | 223 (100.0%) | 0 (0.0%) |
| Total (Category) | 582 (100.0%) | 0 (0.0%) |
| Total (Overall) | 2,455 (51.2%) | 2,335 (48.7%) |
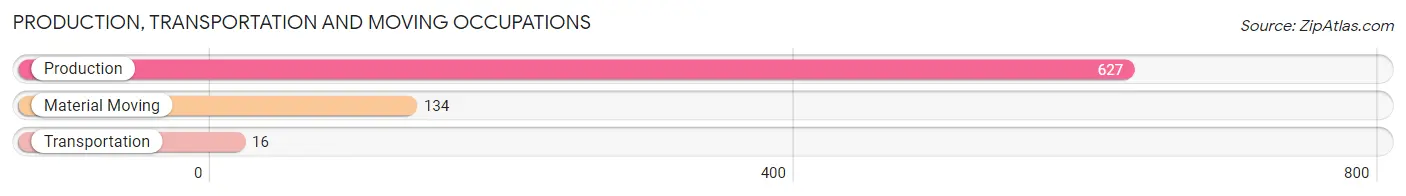
Production, Transportation and Moving Occupations
The most common Production, Transportation and Moving occupations in Sturgeon Bay are Production (627 | 13.1%), Material Moving (134 | 2.8%), and Transportation (16 | 0.3%).
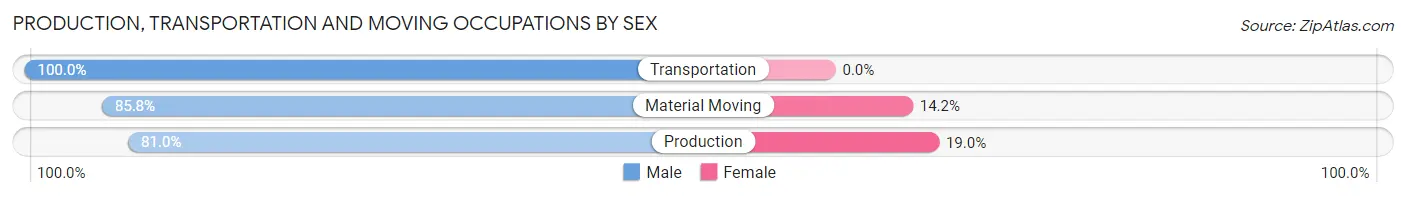
Production, Transportation and Moving Occupations by Sex
| Occupation | Male | Female |
| Production | 508 (81.0%) | 119 (19.0%) |
| Transportation | 16 (100.0%) | 0 (0.0%) |
| Material Moving | 115 (85.8%) | 19 (14.2%) |
| Total (Category) | 639 (82.2%) | 138 (17.8%) |
| Total (Overall) | 2,455 (51.2%) | 2,335 (48.7%) |
Employment Industries by Sex in Sturgeon Bay
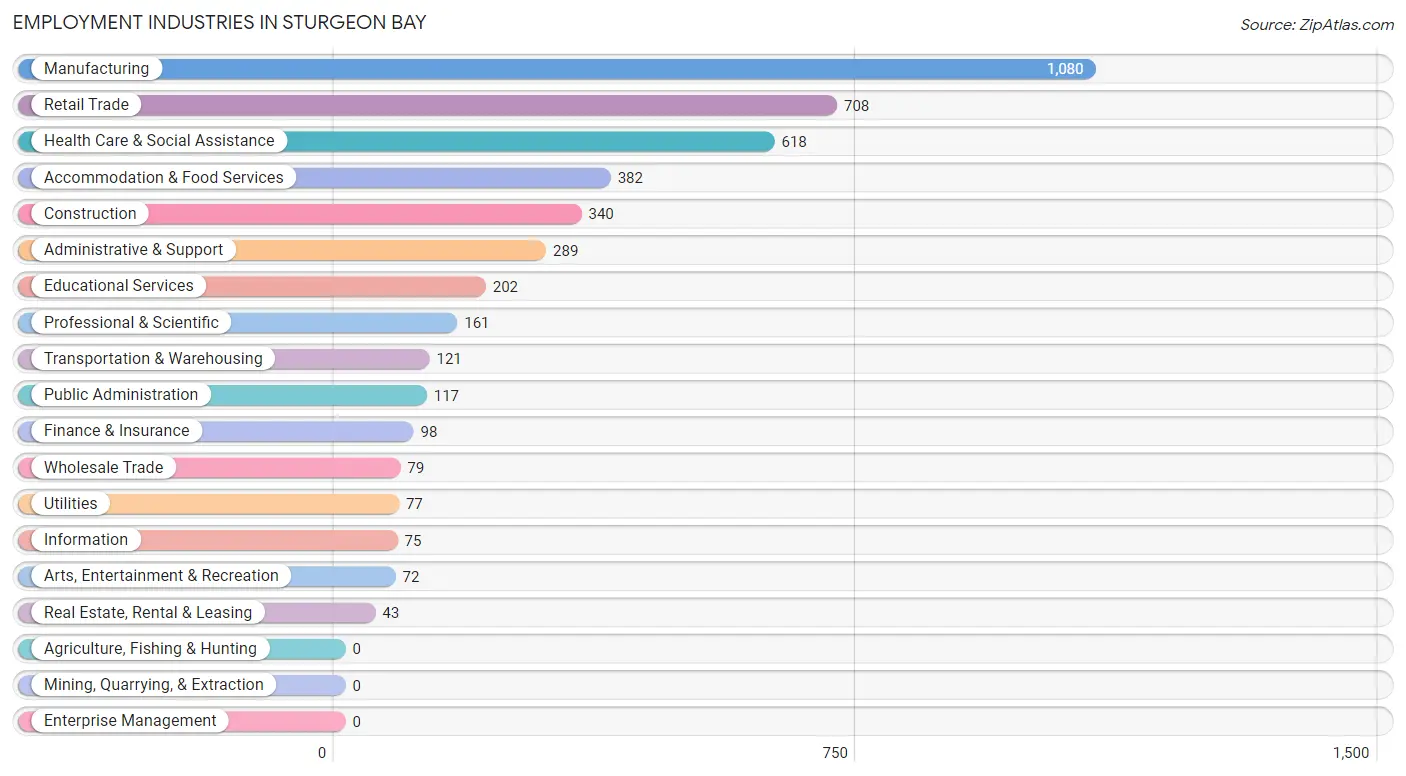
Employment Industries in Sturgeon Bay
The major employment industries in Sturgeon Bay include Manufacturing (1,080 | 22.6%), Retail Trade (708 | 14.8%), Health Care & Social Assistance (618 | 12.9%), Accommodation & Food Services (382 | 8.0%), and Construction (340 | 7.1%).
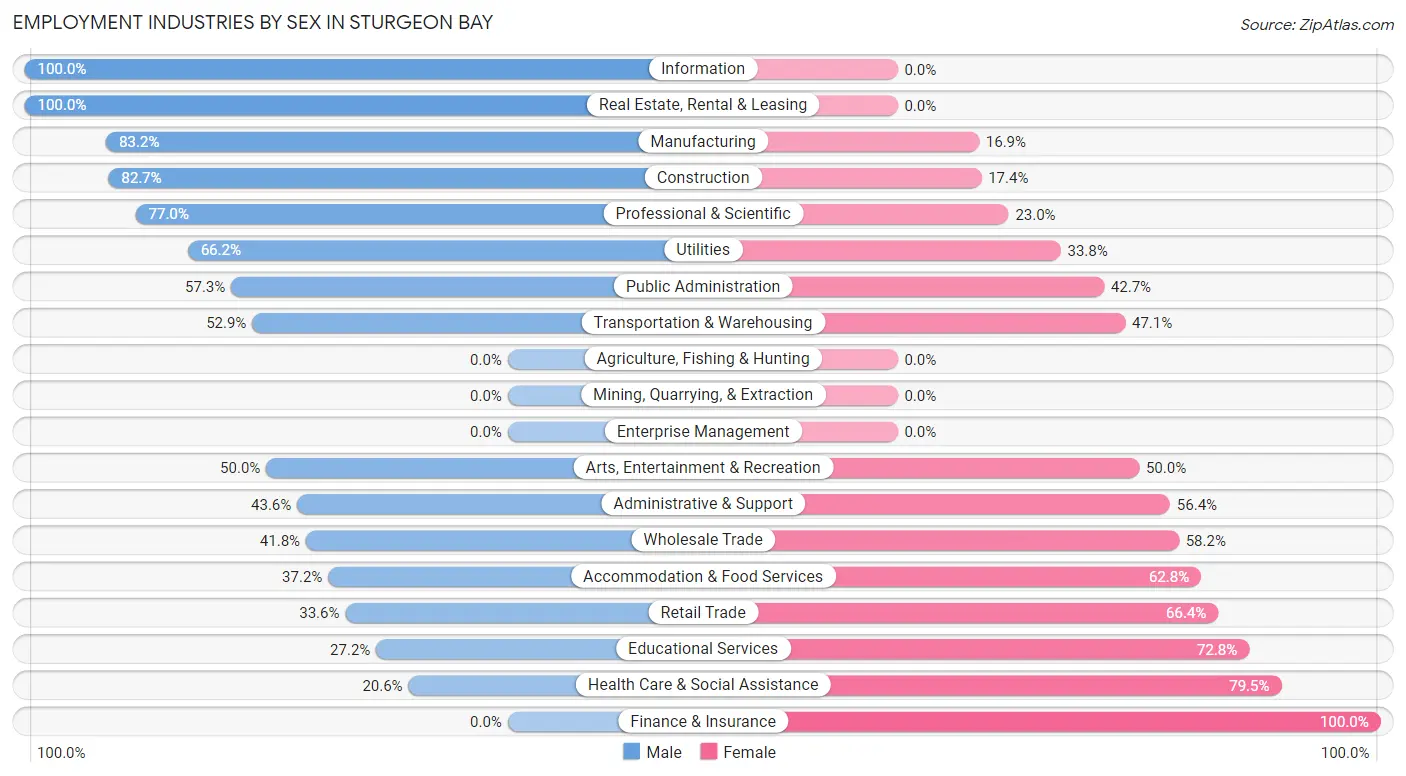
Employment Industries by Sex in Sturgeon Bay
The Sturgeon Bay industries that see more men than women are Information (100.0%), Real Estate, Rental & Leasing (100.0%), and Manufacturing (83.2%), whereas the industries that tend to have a higher number of women are Finance & Insurance (100.0%), Health Care & Social Assistance (79.4%), and Educational Services (72.8%).
| Industry | Male | Female |
| Agriculture, Fishing & Hunting | 0 (0.0%) | 0 (0.0%) |
| Mining, Quarrying, & Extraction | 0 (0.0%) | 0 (0.0%) |
| Construction | 281 (82.7%) | 59 (17.3%) |
| Manufacturing | 898 (83.2%) | 182 (16.9%) |
| Wholesale Trade | 33 (41.8%) | 46 (58.2%) |
| Retail Trade | 238 (33.6%) | 470 (66.4%) |
| Transportation & Warehousing | 64 (52.9%) | 57 (47.1%) |
| Utilities | 51 (66.2%) | 26 (33.8%) |
| Information | 75 (100.0%) | 0 (0.0%) |
| Finance & Insurance | 0 (0.0%) | 98 (100.0%) |
| Real Estate, Rental & Leasing | 43 (100.0%) | 0 (0.0%) |
| Professional & Scientific | 124 (77.0%) | 37 (23.0%) |
| Enterprise Management | 0 (0.0%) | 0 (0.0%) |
| Administrative & Support | 126 (43.6%) | 163 (56.4%) |
| Educational Services | 55 (27.2%) | 147 (72.8%) |
| Health Care & Social Assistance | 127 (20.5%) | 491 (79.4%) |
| Arts, Entertainment & Recreation | 36 (50.0%) | 36 (50.0%) |
| Accommodation & Food Services | 142 (37.2%) | 240 (62.8%) |
| Public Administration | 67 (57.3%) | 50 (42.7%) |
| Total | 2,455 (51.2%) | 2,335 (48.7%) |
Education in Sturgeon Bay
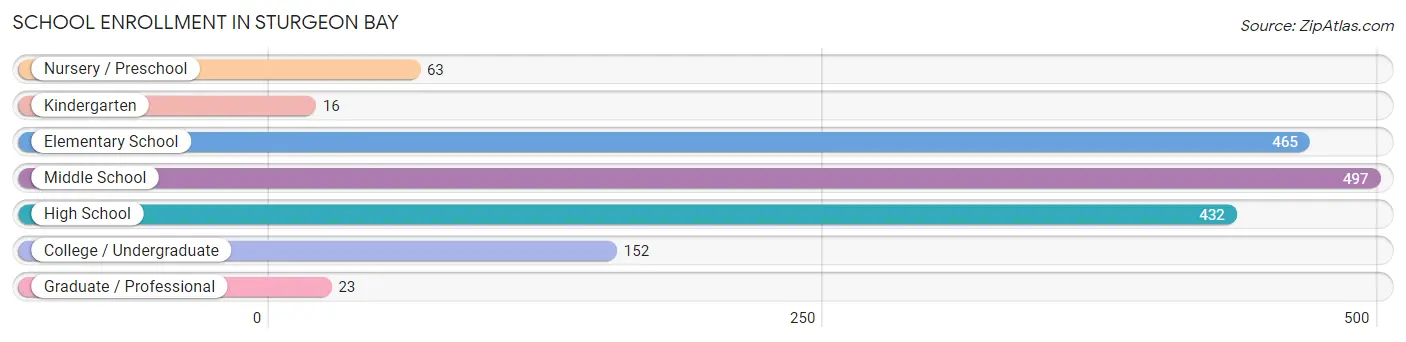
School Enrollment in Sturgeon Bay
The most common levels of schooling among the 1,648 students in Sturgeon Bay are middle school (497 | 30.2%), elementary school (465 | 28.2%), and high school (432 | 26.2%).
| School Level | # Students | % Students |
| Nursery / Preschool | 63 | 3.8% |
| Kindergarten | 16 | 1.0% |
| Elementary School | 465 | 28.2% |
| Middle School | 497 | 30.2% |
| High School | 432 | 26.2% |
| College / Undergraduate | 152 | 9.2% |
| Graduate / Professional | 23 | 1.4% |
| Total | 1,648 | 100.0% |
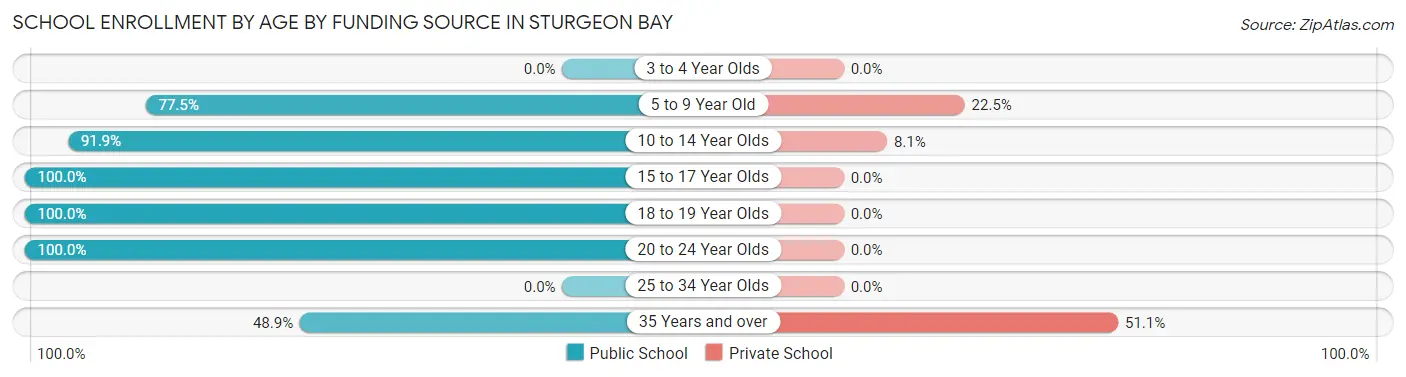
School Enrollment by Age by Funding Source in Sturgeon Bay
Out of a total of 1,648 students who are enrolled in schools in Sturgeon Bay, 186 (11.3%) attend a private institution, while the remaining 1,462 (88.7%) are enrolled in public schools. The age group of 35 years and over has the highest likelihood of being enrolled in private schools, with 23 (51.1% in the age bracket) enrolled. Conversely, the age group of 15 to 17 year olds has the lowest likelihood of being enrolled in a private school, with 249 (100.0% in the age bracket) attending a public institution.
| Age Bracket | Public School | Private School |
| 3 to 4 Year Olds | 0 (0.0%) | 0 (0.0%) |
| 5 to 9 Year Old | 385 (77.5%) | 112 (22.5%) |
| 10 to 14 Year Olds | 582 (91.9%) | 51 (8.1%) |
| 15 to 17 Year Olds | 249 (100.0%) | 0 (0.0%) |
| 18 to 19 Year Olds | 118 (100.0%) | 0 (0.0%) |
| 20 to 24 Year Olds | 106 (100.0%) | 0 (0.0%) |
| 25 to 34 Year Olds | 0 (0.0%) | 0 (0.0%) |
| 35 Years and over | 22 (48.9%) | 23 (51.1%) |
| Total | 1,462 (88.7%) | 186 (11.3%) |
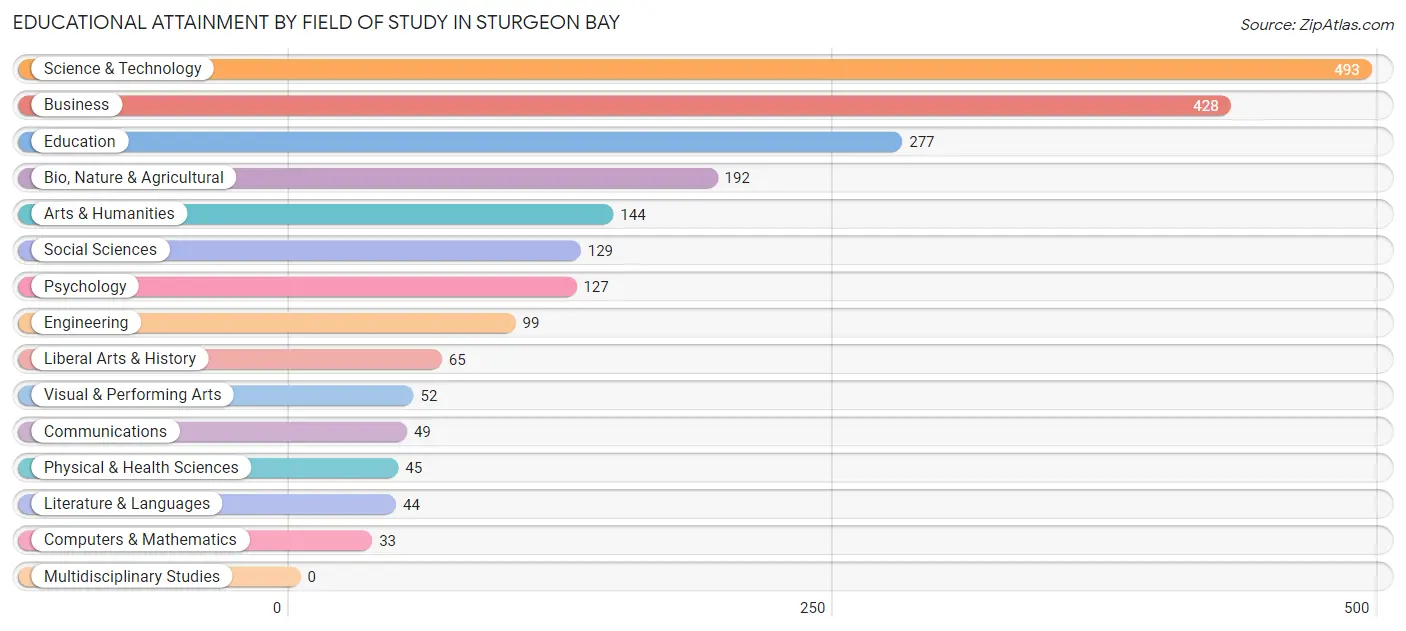
Educational Attainment by Field of Study in Sturgeon Bay
Science & technology (493 | 22.7%), business (428 | 19.7%), education (277 | 12.7%), bio, nature & agricultural (192 | 8.8%), and arts & humanities (144 | 6.6%) are the most common fields of study among 2,177 individuals in Sturgeon Bay who have obtained a bachelor's degree or higher.
| Field of Study | # Graduates | % Graduates |
| Computers & Mathematics | 33 | 1.5% |
| Bio, Nature & Agricultural | 192 | 8.8% |
| Physical & Health Sciences | 45 | 2.1% |
| Psychology | 127 | 5.8% |
| Social Sciences | 129 | 5.9% |
| Engineering | 99 | 4.5% |
| Multidisciplinary Studies | 0 | 0.0% |
| Science & Technology | 493 | 22.7% |
| Business | 428 | 19.7% |
| Education | 277 | 12.7% |
| Literature & Languages | 44 | 2.0% |
| Liberal Arts & History | 65 | 3.0% |
| Visual & Performing Arts | 52 | 2.4% |
| Communications | 49 | 2.2% |
| Arts & Humanities | 144 | 6.6% |
| Total | 2,177 | 100.0% |
Transportation & Commute in Sturgeon Bay
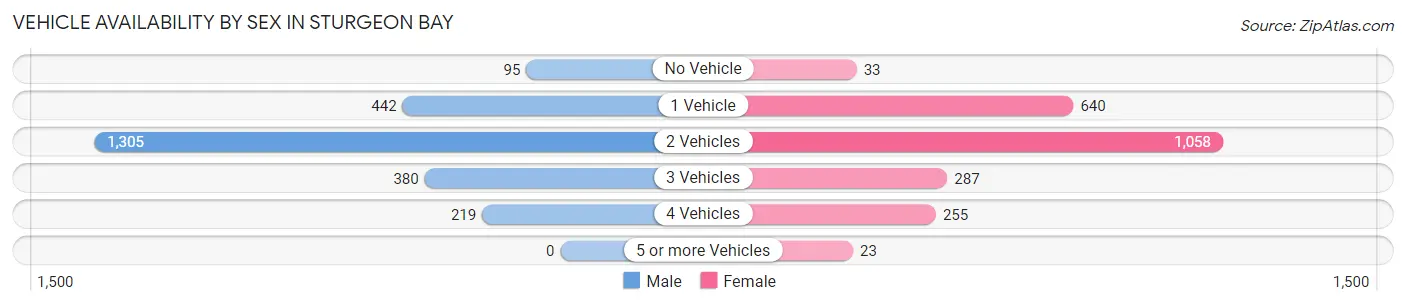
Vehicle Availability by Sex in Sturgeon Bay
The most prevalent vehicle ownership categories in Sturgeon Bay are males with 2 vehicles (1,305, accounting for 53.5%) and females with 2 vehicles (1,058, making up 56.8%).
| Vehicles Available | Male | Female |
| No Vehicle | 95 (3.9%) | 33 (1.4%) |
| 1 Vehicle | 442 (18.1%) | 640 (27.9%) |
| 2 Vehicles | 1,305 (53.5%) | 1,058 (46.1%) |
| 3 Vehicles | 380 (15.6%) | 287 (12.5%) |
| 4 Vehicles | 219 (9.0%) | 255 (11.1%) |
| 5 or more Vehicles | 0 (0.0%) | 23 (1.0%) |
| Total | 2,441 (100.0%) | 2,296 (100.0%) |
Commute Time in Sturgeon Bay
The most frequently occuring commute durations in Sturgeon Bay are 5 to 9 minutes (1,511 commuters, 34.6%), 10 to 14 minutes (1,039 commuters, 23.8%), and less than 5 minutes (427 commuters, 9.8%).
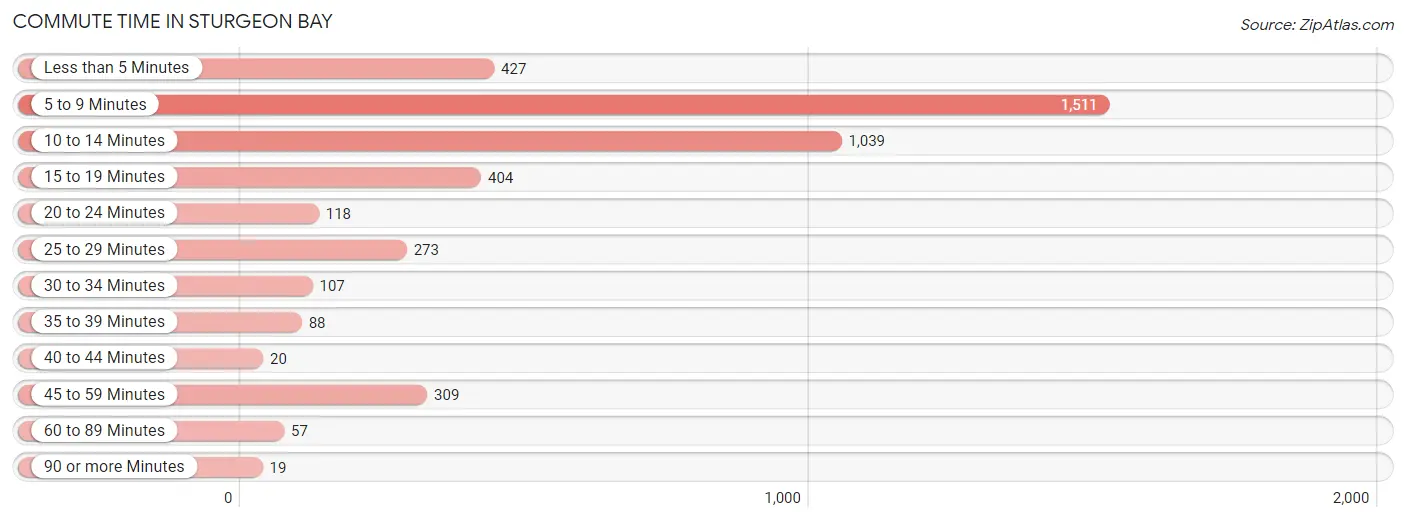
| Commute Time | # Commuters | % Commuters |
| Less than 5 Minutes | 427 | 9.8% |
| 5 to 9 Minutes | 1,511 | 34.6% |
| 10 to 14 Minutes | 1,039 | 23.8% |
| 15 to 19 Minutes | 404 | 9.2% |
| 20 to 24 Minutes | 118 | 2.7% |
| 25 to 29 Minutes | 273 | 6.2% |
| 30 to 34 Minutes | 107 | 2.5% |
| 35 to 39 Minutes | 88 | 2.0% |
| 40 to 44 Minutes | 20 | 0.5% |
| 45 to 59 Minutes | 309 | 7.1% |
| 60 to 89 Minutes | 57 | 1.3% |
| 90 or more Minutes | 19 | 0.4% |
Commute Time by Sex in Sturgeon Bay
The most common commute times in Sturgeon Bay are 5 to 9 minutes (749 commuters, 33.0%) for males and 5 to 9 minutes (762 commuters, 36.3%) for females.
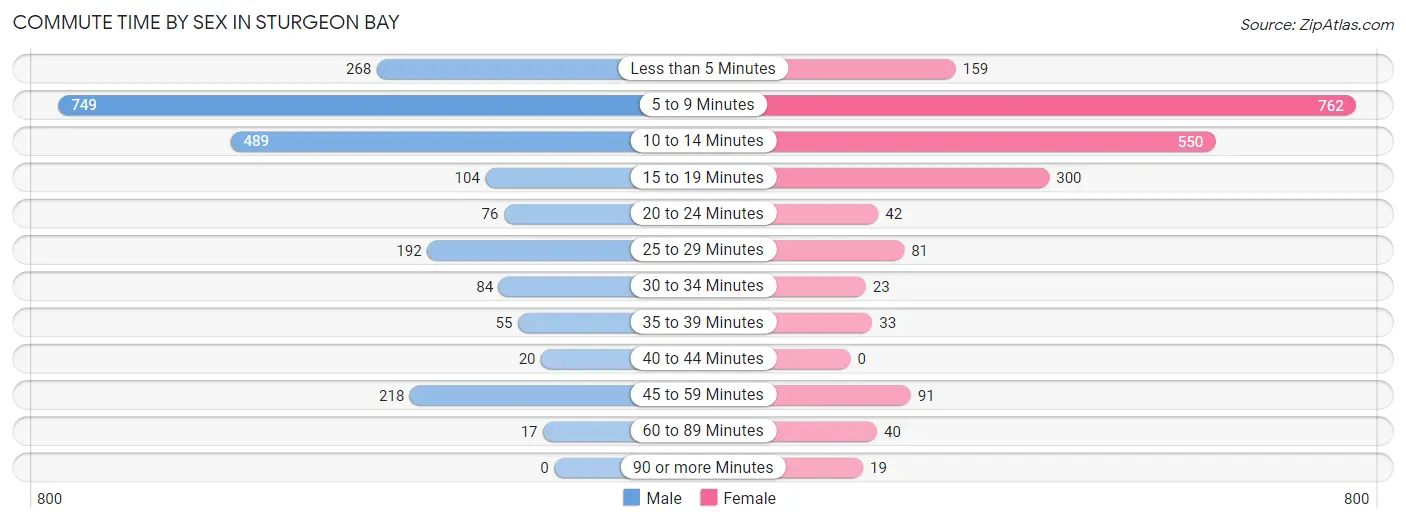
| Commute Time | Male | Female |
| Less than 5 Minutes | 268 (11.8%) | 159 (7.6%) |
| 5 to 9 Minutes | 749 (33.0%) | 762 (36.3%) |
| 10 to 14 Minutes | 489 (21.5%) | 550 (26.2%) |
| 15 to 19 Minutes | 104 (4.6%) | 300 (14.3%) |
| 20 to 24 Minutes | 76 (3.4%) | 42 (2.0%) |
| 25 to 29 Minutes | 192 (8.5%) | 81 (3.9%) |
| 30 to 34 Minutes | 84 (3.7%) | 23 (1.1%) |
| 35 to 39 Minutes | 55 (2.4%) | 33 (1.6%) |
| 40 to 44 Minutes | 20 (0.9%) | 0 (0.0%) |
| 45 to 59 Minutes | 218 (9.6%) | 91 (4.3%) |
| 60 to 89 Minutes | 17 (0.7%) | 40 (1.9%) |
| 90 or more Minutes | 0 (0.0%) | 19 (0.9%) |
Time of Departure to Work by Sex in Sturgeon Bay
The most frequent times of departure to work in Sturgeon Bay are 5:30 AM to 5:59 AM (388, 17.1%) for males and 7:30 AM to 7:59 AM (534, 25.4%) for females.
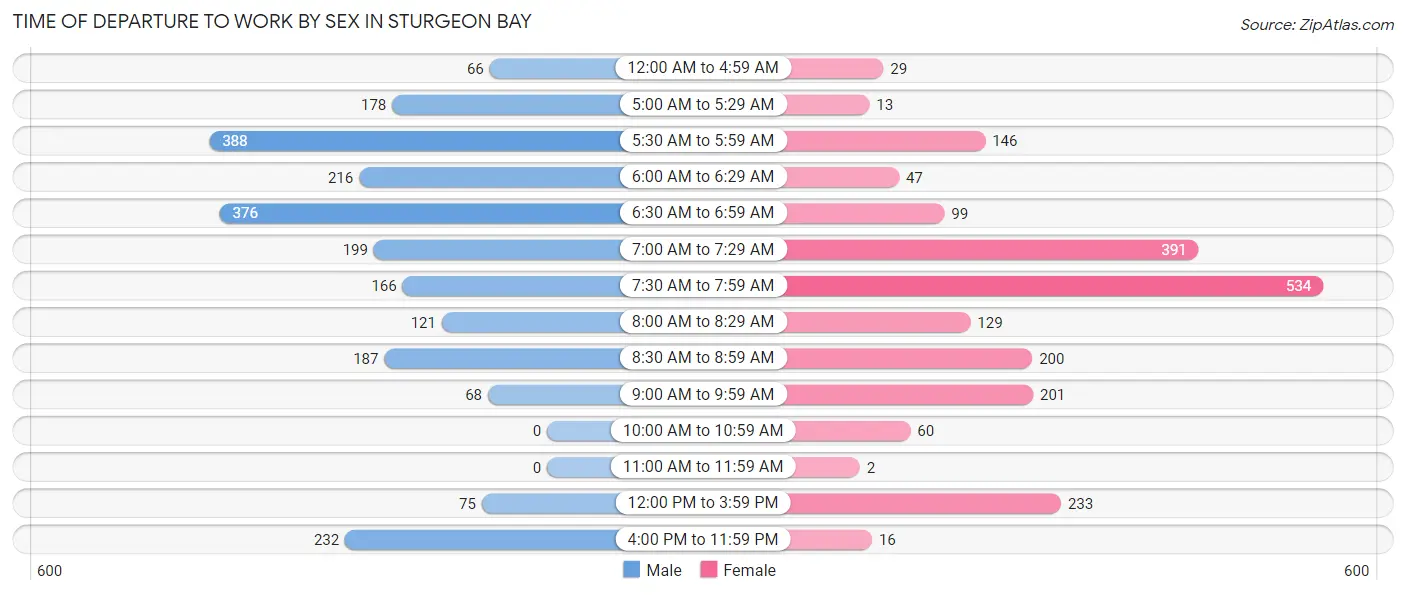
| Time of Departure | Male | Female |
| 12:00 AM to 4:59 AM | 66 (2.9%) | 29 (1.4%) |
| 5:00 AM to 5:29 AM | 178 (7.8%) | 13 (0.6%) |
| 5:30 AM to 5:59 AM | 388 (17.1%) | 146 (7.0%) |
| 6:00 AM to 6:29 AM | 216 (9.5%) | 47 (2.2%) |
| 6:30 AM to 6:59 AM | 376 (16.6%) | 99 (4.7%) |
| 7:00 AM to 7:29 AM | 199 (8.8%) | 391 (18.6%) |
| 7:30 AM to 7:59 AM | 166 (7.3%) | 534 (25.4%) |
| 8:00 AM to 8:29 AM | 121 (5.3%) | 129 (6.1%) |
| 8:30 AM to 8:59 AM | 187 (8.2%) | 200 (9.5%) |
| 9:00 AM to 9:59 AM | 68 (3.0%) | 201 (9.6%) |
| 10:00 AM to 10:59 AM | 0 (0.0%) | 60 (2.9%) |
| 11:00 AM to 11:59 AM | 0 (0.0%) | 2 (0.1%) |
| 12:00 PM to 3:59 PM | 75 (3.3%) | 233 (11.1%) |
| 4:00 PM to 11:59 PM | 232 (10.2%) | 16 (0.8%) |
| Total | 2,272 (100.0%) | 2,100 (100.0%) |
Housing Occupancy in Sturgeon Bay
Occupancy by Ownership in Sturgeon Bay
Of the total 4,632 dwellings in Sturgeon Bay, owner-occupied units account for 3,235 (69.8%), while renter-occupied units make up 1,397 (30.2%).
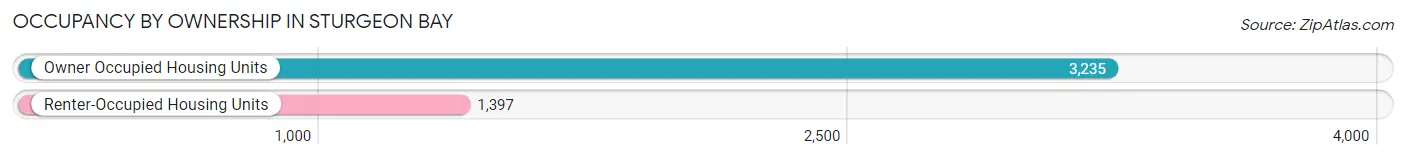
| Occupancy | # Housing Units | % Housing Units |
| Owner Occupied Housing Units | 3,235 | 69.8% |
| Renter-Occupied Housing Units | 1,397 | 30.2% |
| Total Occupied Housing Units | 4,632 | 100.0% |
Occupancy by Household Size in Sturgeon Bay
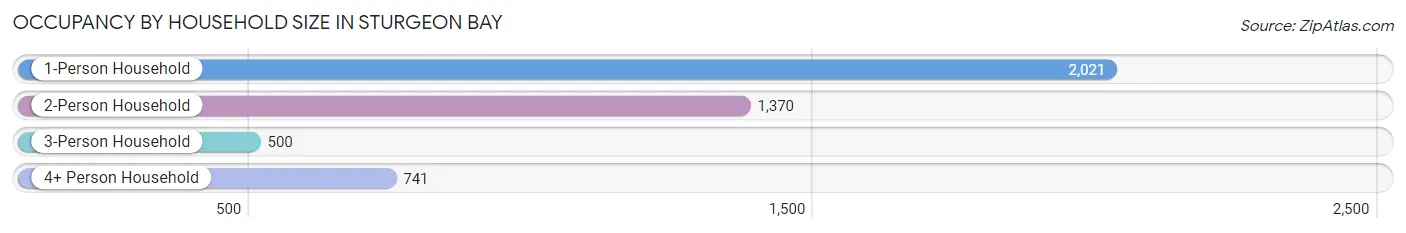
| Household Size | # Housing Units | % Housing Units |
| 1-Person Household | 2,021 | 43.6% |
| 2-Person Household | 1,370 | 29.6% |
| 3-Person Household | 500 | 10.8% |
| 4+ Person Household | 741 | 16.0% |
| Total Housing Units | 4,632 | 100.0% |
Occupancy by Ownership by Household Size in Sturgeon Bay
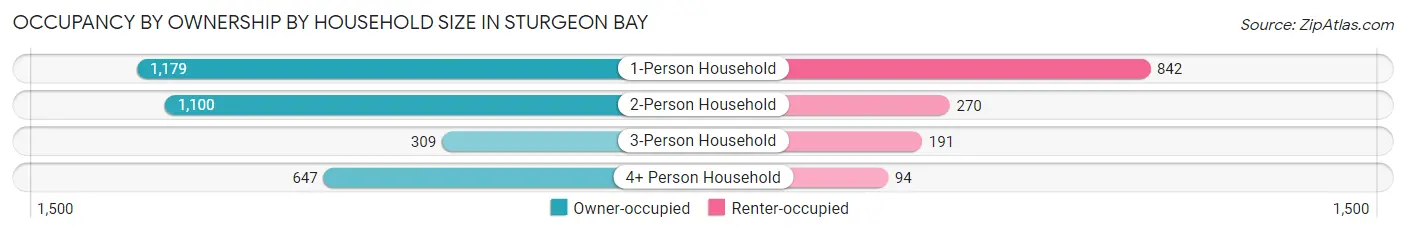
| Household Size | Owner-occupied | Renter-occupied |
| 1-Person Household | 1,179 (58.3%) | 842 (41.7%) |
| 2-Person Household | 1,100 (80.3%) | 270 (19.7%) |
| 3-Person Household | 309 (61.8%) | 191 (38.2%) |
| 4+ Person Household | 647 (87.3%) | 94 (12.7%) |
| Total Housing Units | 3,235 (69.8%) | 1,397 (30.2%) |
Occupancy by Educational Attainment in Sturgeon Bay
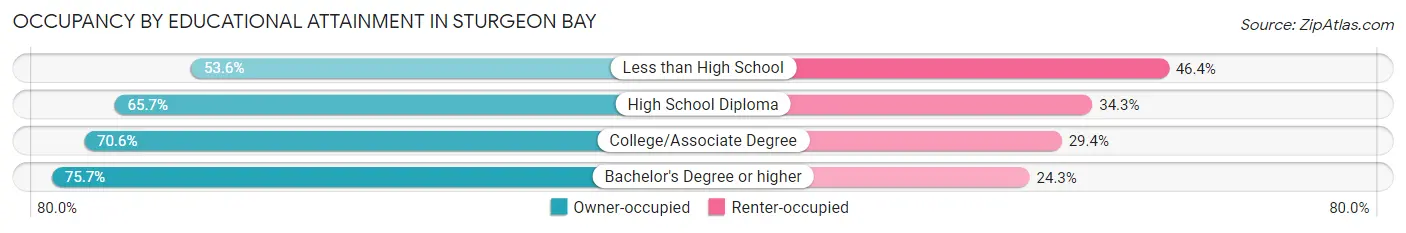
| Household Size | Owner-occupied | Renter-occupied |
| Less than High School | 119 (53.6%) | 103 (46.4%) |
| High School Diploma | 834 (65.7%) | 435 (34.3%) |
| College/Associate Degree | 1,309 (70.6%) | 546 (29.4%) |
| Bachelor's Degree or higher | 973 (75.7%) | 313 (24.3%) |
Occupancy by Age of Householder in Sturgeon Bay
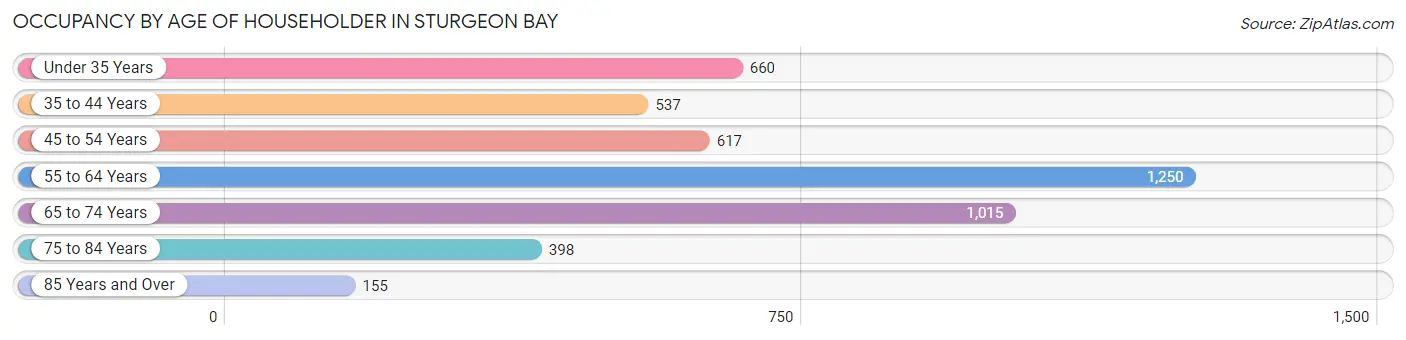
| Age Bracket | # Households | % Households |
| Under 35 Years | 660 | 14.2% |
| 35 to 44 Years | 537 | 11.6% |
| 45 to 54 Years | 617 | 13.3% |
| 55 to 64 Years | 1,250 | 27.0% |
| 65 to 74 Years | 1,015 | 21.9% |
| 75 to 84 Years | 398 | 8.6% |
| 85 Years and Over | 155 | 3.4% |
| Total | 4,632 | 100.0% |
Housing Finances in Sturgeon Bay
Median Income by Occupancy in Sturgeon Bay
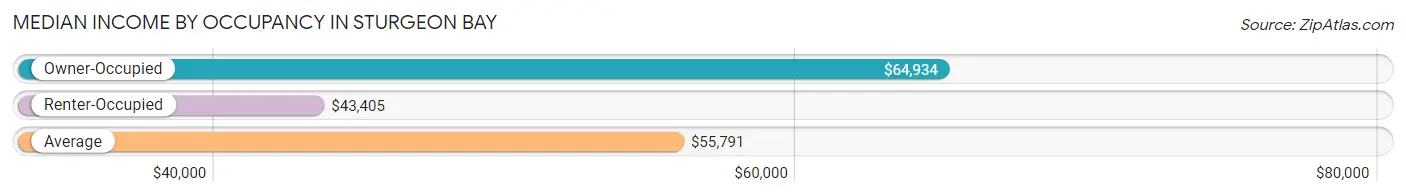
| Occupancy Type | # Households | Median Income |
| Owner-Occupied | 3,235 (69.8%) | $64,934 |
| Renter-Occupied | 1,397 (30.2%) | $43,405 |
| Average | 4,632 (100.0%) | $55,791 |
Occupancy by Householder Income Bracket in Sturgeon Bay
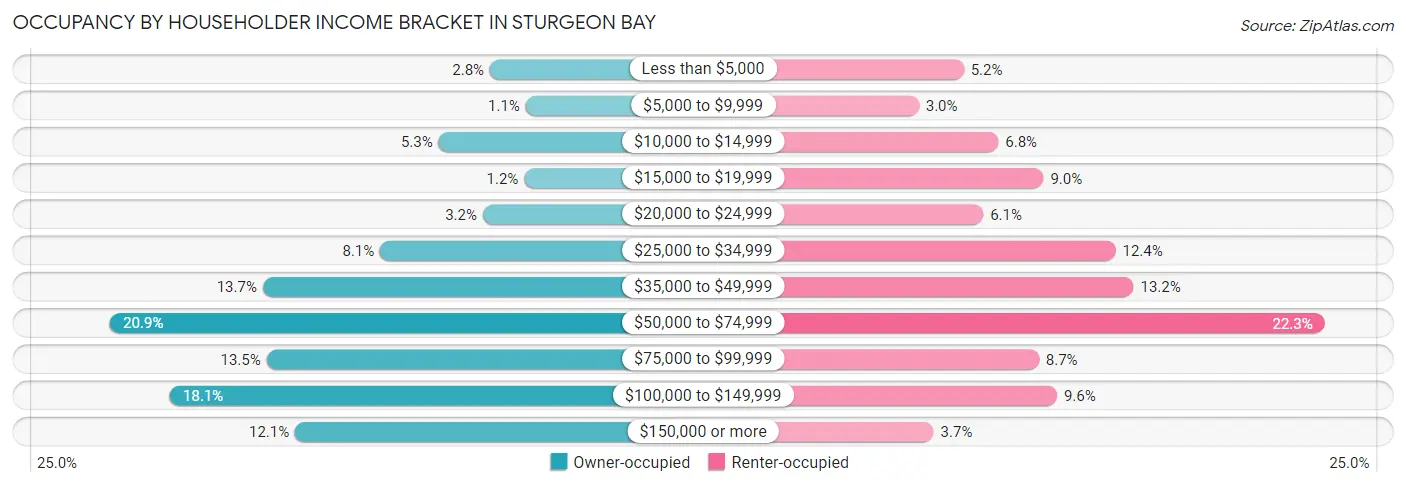
| Income Bracket | Owner-occupied | Renter-occupied |
| Less than $5,000 | 92 (2.8%) | 72 (5.1%) |
| $5,000 to $9,999 | 37 (1.1%) | 42 (3.0%) |
| $10,000 to $14,999 | 171 (5.3%) | 95 (6.8%) |
| $15,000 to $19,999 | 39 (1.2%) | 125 (8.9%) |
| $20,000 to $24,999 | 103 (3.2%) | 85 (6.1%) |
| $25,000 to $34,999 | 261 (8.1%) | 173 (12.4%) |
| $35,000 to $49,999 | 442 (13.7%) | 185 (13.2%) |
| $50,000 to $74,999 | 677 (20.9%) | 312 (22.3%) |
| $75,000 to $99,999 | 436 (13.5%) | 122 (8.7%) |
| $100,000 to $149,999 | 585 (18.1%) | 134 (9.6%) |
| $150,000 or more | 392 (12.1%) | 52 (3.7%) |
| Total | 3,235 (100.0%) | 1,397 (100.0%) |
Monthly Housing Cost Tiers in Sturgeon Bay
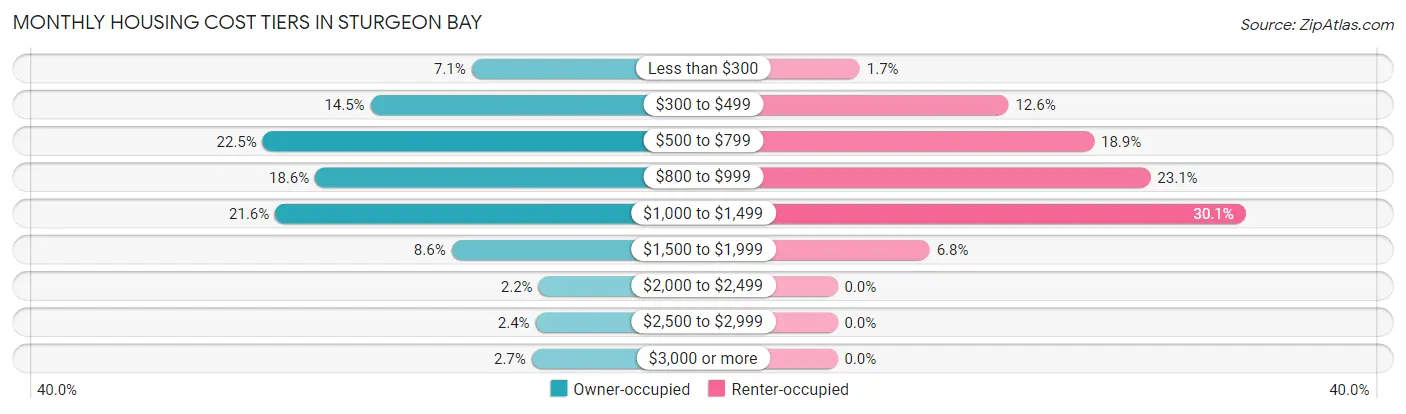
| Monthly Cost | Owner-occupied | Renter-occupied |
| Less than $300 | 229 (7.1%) | 23 (1.7%) |
| $300 to $499 | 470 (14.5%) | 176 (12.6%) |
| $500 to $799 | 727 (22.5%) | 264 (18.9%) |
| $800 to $999 | 602 (18.6%) | 322 (23.1%) |
| $1,000 to $1,499 | 697 (21.5%) | 420 (30.1%) |
| $1,500 to $1,999 | 277 (8.6%) | 95 (6.8%) |
| $2,000 to $2,499 | 70 (2.2%) | 0 (0.0%) |
| $2,500 to $2,999 | 77 (2.4%) | 0 (0.0%) |
| $3,000 or more | 86 (2.7%) | 0 (0.0%) |
| Total | 3,235 (100.0%) | 1,397 (100.0%) |
Physical Housing Characteristics in Sturgeon Bay
Housing Structures in Sturgeon Bay
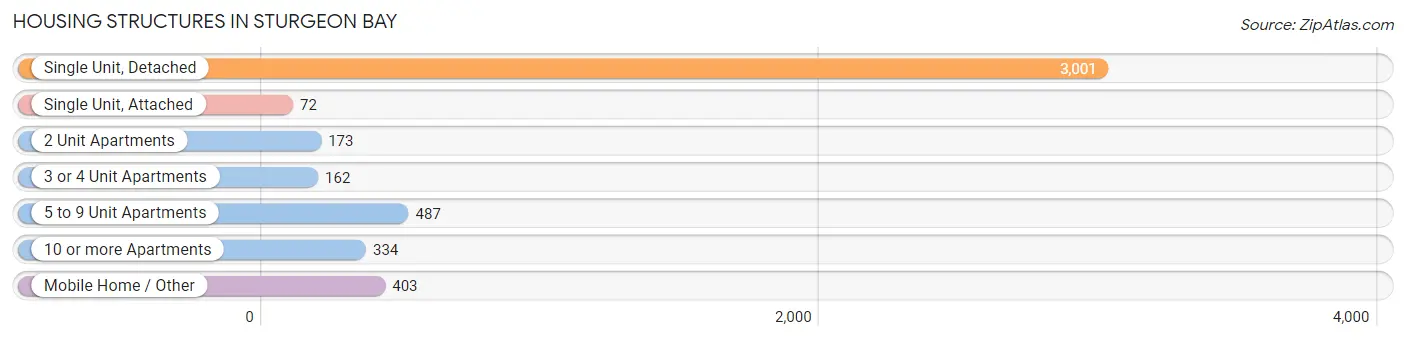
| Structure Type | # Housing Units | % Housing Units |
| Single Unit, Detached | 3,001 | 64.8% |
| Single Unit, Attached | 72 | 1.5% |
| 2 Unit Apartments | 173 | 3.7% |
| 3 or 4 Unit Apartments | 162 | 3.5% |
| 5 to 9 Unit Apartments | 487 | 10.5% |
| 10 or more Apartments | 334 | 7.2% |
| Mobile Home / Other | 403 | 8.7% |
| Total | 4,632 | 100.0% |
Housing Structures by Occupancy in Sturgeon Bay
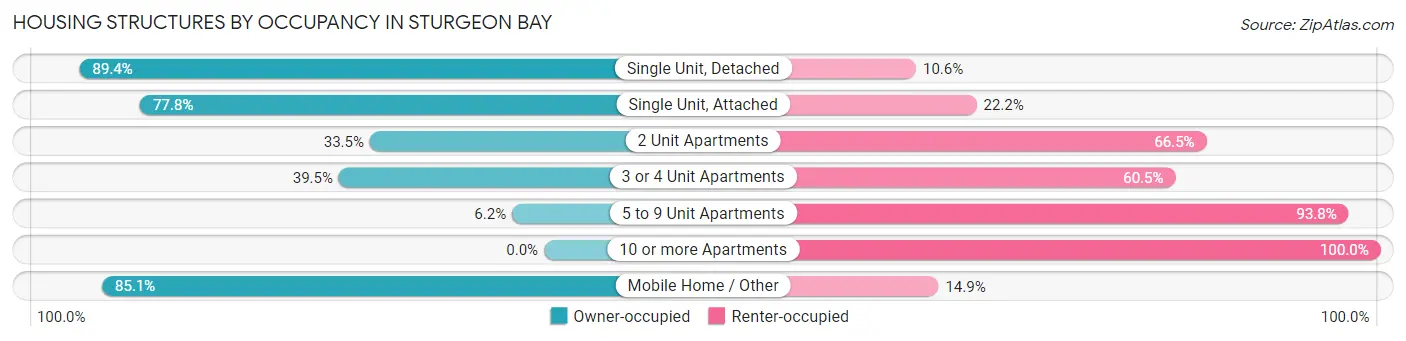
| Structure Type | Owner-occupied | Renter-occupied |
| Single Unit, Detached | 2,684 (89.4%) | 317 (10.6%) |
| Single Unit, Attached | 56 (77.8%) | 16 (22.2%) |
| 2 Unit Apartments | 58 (33.5%) | 115 (66.5%) |
| 3 or 4 Unit Apartments | 64 (39.5%) | 98 (60.5%) |
| 5 to 9 Unit Apartments | 30 (6.2%) | 457 (93.8%) |
| 10 or more Apartments | 0 (0.0%) | 334 (100.0%) |
| Mobile Home / Other | 343 (85.1%) | 60 (14.9%) |
| Total | 3,235 (69.8%) | 1,397 (30.2%) |
Housing Structures by Number of Rooms in Sturgeon Bay
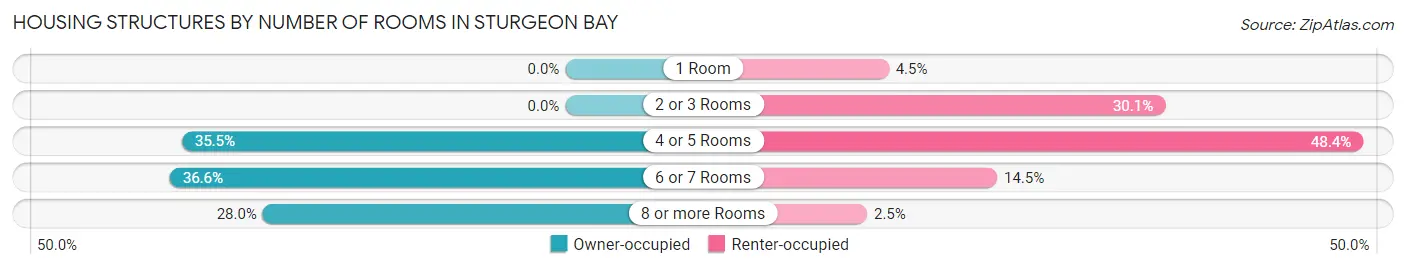
| Number of Rooms | Owner-occupied | Renter-occupied |
| 1 Room | 0 (0.0%) | 63 (4.5%) |
| 2 or 3 Rooms | 0 (0.0%) | 420 (30.1%) |
| 4 or 5 Rooms | 1,147 (35.5%) | 676 (48.4%) |
| 6 or 7 Rooms | 1,183 (36.6%) | 203 (14.5%) |
| 8 or more Rooms | 905 (28.0%) | 35 (2.5%) |
| Total | 3,235 (100.0%) | 1,397 (100.0%) |
Housing Structure by Heating Type in Sturgeon Bay
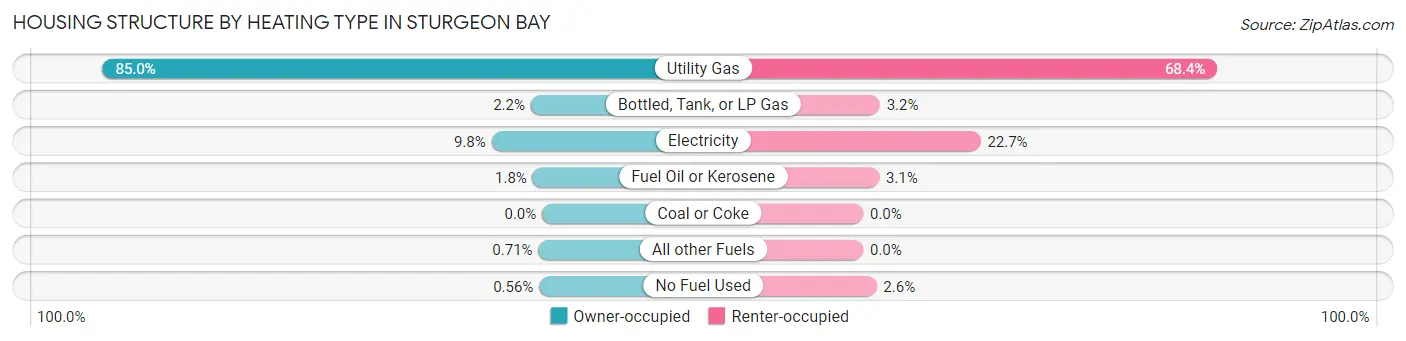
| Heating Type | Owner-occupied | Renter-occupied |
| Utility Gas | 2,748 (85.0%) | 956 (68.4%) |
| Bottled, Tank, or LP Gas | 71 (2.2%) | 45 (3.2%) |
| Electricity | 316 (9.8%) | 317 (22.7%) |
| Fuel Oil or Kerosene | 59 (1.8%) | 43 (3.1%) |
| Coal or Coke | 0 (0.0%) | 0 (0.0%) |
| All other Fuels | 23 (0.7%) | 0 (0.0%) |
| No Fuel Used | 18 (0.6%) | 36 (2.6%) |
| Total | 3,235 (100.0%) | 1,397 (100.0%) |
Household Vehicle Usage in Sturgeon Bay
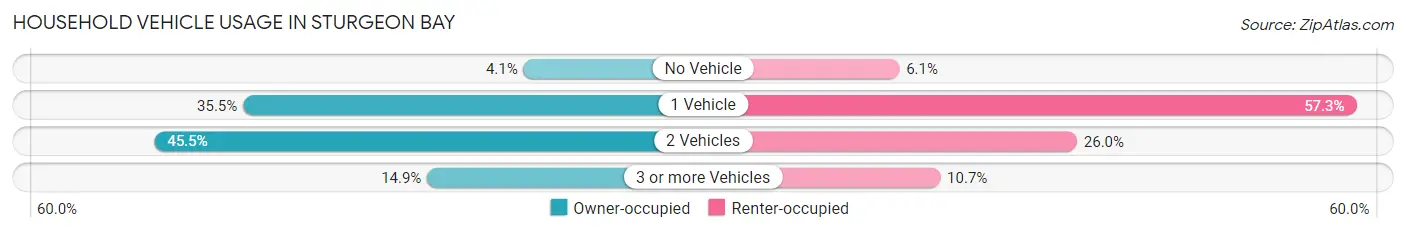
| Vehicles per Household | Owner-occupied | Renter-occupied |
| No Vehicle | 133 (4.1%) | 85 (6.1%) |
| 1 Vehicle | 1,149 (35.5%) | 800 (57.3%) |
| 2 Vehicles | 1,471 (45.5%) | 363 (26.0%) |
| 3 or more Vehicles | 482 (14.9%) | 149 (10.7%) |
| Total | 3,235 (100.0%) | 1,397 (100.0%) |
Real Estate & Mortgages in Sturgeon Bay
Real Estate and Mortgage Overview in Sturgeon Bay
| Characteristic | Without Mortgage | With Mortgage |
| Housing Units | 1,629 | 1,606 |
| Median Property Value | $176,200 | $186,300 |
| Median Household Income | $49,446 | $253 |
| Monthly Housing Costs | $581 | $86 |
| Real Estate Taxes | $3,539 | $19 |
Property Value by Mortgage Status in Sturgeon Bay
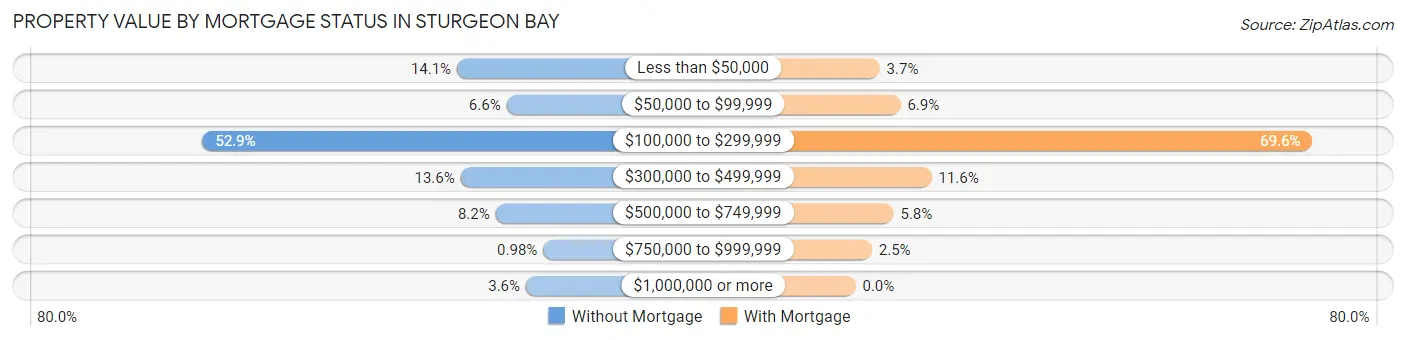
| Property Value | Without Mortgage | With Mortgage |
| Less than $50,000 | 230 (14.1%) | 59 (3.7%) |
| $50,000 to $99,999 | 107 (6.6%) | 110 (6.9%) |
| $100,000 to $299,999 | 862 (52.9%) | 1,118 (69.6%) |
| $300,000 to $499,999 | 221 (13.6%) | 186 (11.6%) |
| $500,000 to $749,999 | 134 (8.2%) | 93 (5.8%) |
| $750,000 to $999,999 | 16 (1.0%) | 40 (2.5%) |
| $1,000,000 or more | 59 (3.6%) | 0 (0.0%) |
| Total | 1,629 (100.0%) | 1,606 (100.0%) |
Household Income by Mortgage Status in Sturgeon Bay
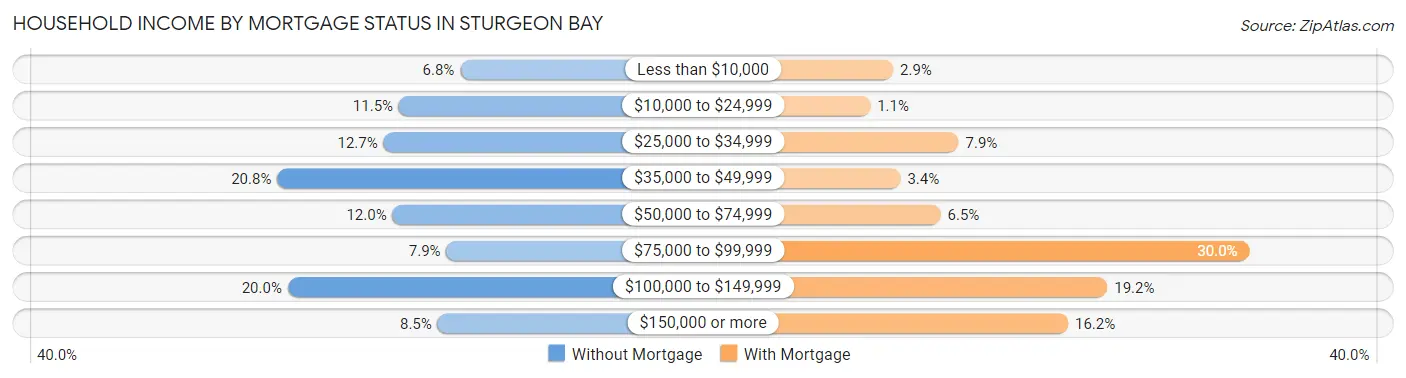
| Household Income | Without Mortgage | With Mortgage |
| Less than $10,000 | 111 (6.8%) | 46 (2.9%) |
| $10,000 to $24,999 | 187 (11.5%) | 18 (1.1%) |
| $25,000 to $34,999 | 206 (12.7%) | 126 (7.9%) |
| $35,000 to $49,999 | 338 (20.7%) | 55 (3.4%) |
| $50,000 to $74,999 | 195 (12.0%) | 104 (6.5%) |
| $75,000 to $99,999 | 128 (7.9%) | 482 (30.0%) |
| $100,000 to $149,999 | 325 (20.0%) | 308 (19.2%) |
| $150,000 or more | 139 (8.5%) | 260 (16.2%) |
| Total | 1,629 (100.0%) | 1,606 (100.0%) |
Property Value to Household Income Ratio in Sturgeon Bay
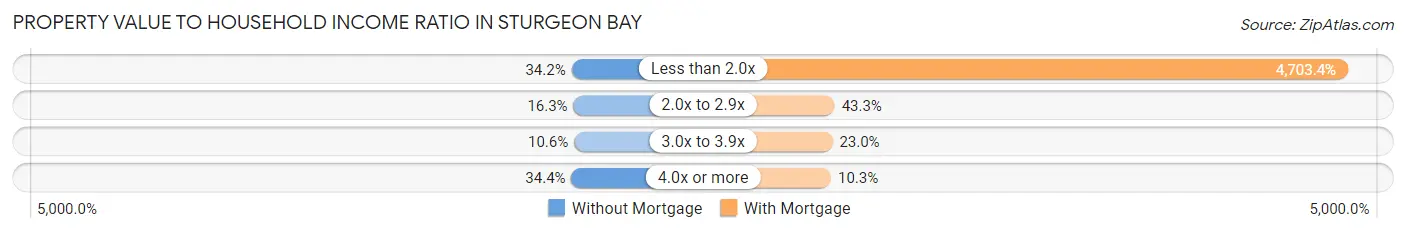
| Value-to-Income Ratio | Without Mortgage | With Mortgage |
| Less than 2.0x | 557 (34.2%) | 75,536 (4,703.4%) |
| 2.0x to 2.9x | 265 (16.3%) | 696 (43.3%) |
| 3.0x to 3.9x | 172 (10.6%) | 370 (23.0%) |
| 4.0x or more | 561 (34.4%) | 166 (10.3%) |
| Total | 1,629 (100.0%) | 1,606 (100.0%) |
Real Estate Taxes by Mortgage Status in Sturgeon Bay
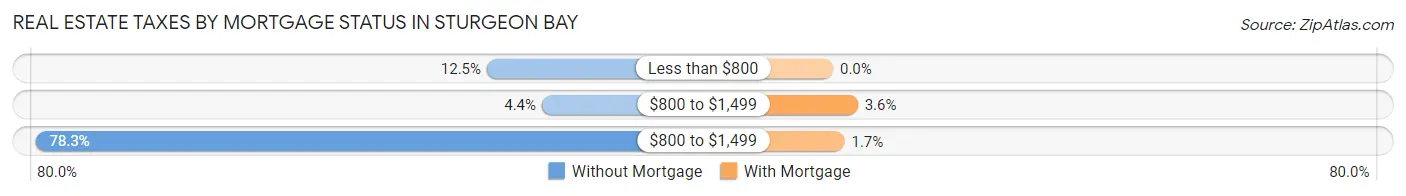
| Property Taxes | Without Mortgage | With Mortgage |
| Less than $800 | 203 (12.5%) | 0 (0.0%) |
| $800 to $1,499 | 72 (4.4%) | 58 (3.6%) |
| $800 to $1,499 | 1,275 (78.3%) | 27 (1.7%) |
| Total | 1,629 (100.0%) | 1,606 (100.0%) |
Health & Disability in Sturgeon Bay
Health Insurance Coverage by Age in Sturgeon Bay
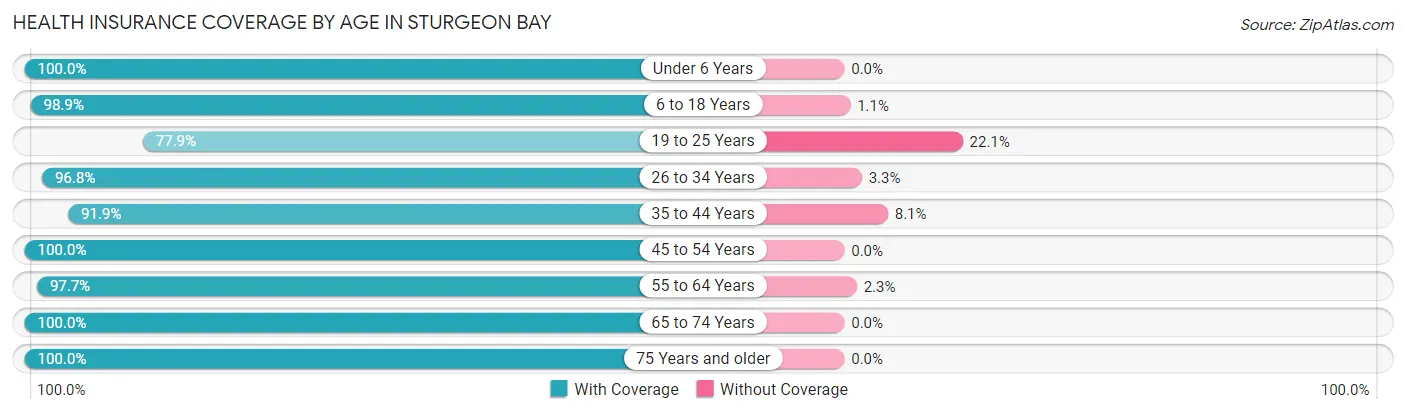
| Age Bracket | With Coverage | Without Coverage |
| Under 6 Years | 417 (100.0%) | 0 (0.0%) |
| 6 to 18 Years | 1,419 (98.9%) | 16 (1.1%) |
| 19 to 25 Years | 424 (77.9%) | 120 (22.1%) |
| 26 to 34 Years | 893 (96.8%) | 30 (3.3%) |
| 35 to 44 Years | 1,043 (91.9%) | 92 (8.1%) |
| 45 to 54 Years | 1,085 (100.0%) | 0 (0.0%) |
| 55 to 64 Years | 1,648 (97.7%) | 39 (2.3%) |
| 65 to 74 Years | 1,464 (100.0%) | 0 (0.0%) |
| 75 Years and older | 741 (100.0%) | 0 (0.0%) |
| Total | 9,134 (96.9%) | 297 (3.2%) |
Health Insurance Coverage by Citizenship Status in Sturgeon Bay
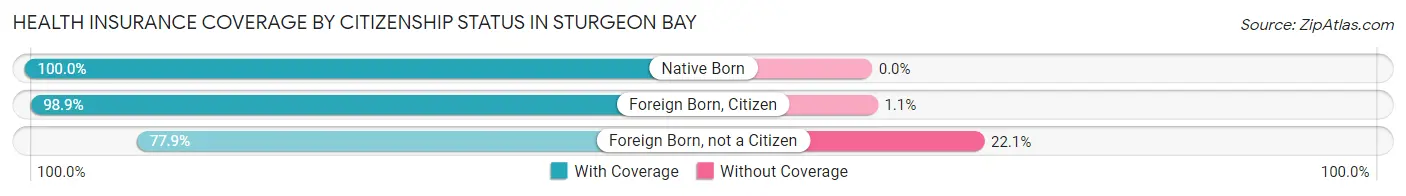
| Citizenship Status | With Coverage | Without Coverage |
| Native Born | 417 (100.0%) | 0 (0.0%) |
| Foreign Born, Citizen | 1,419 (98.9%) | 16 (1.1%) |
| Foreign Born, not a Citizen | 424 (77.9%) | 120 (22.1%) |
Health Insurance Coverage by Household Income in Sturgeon Bay
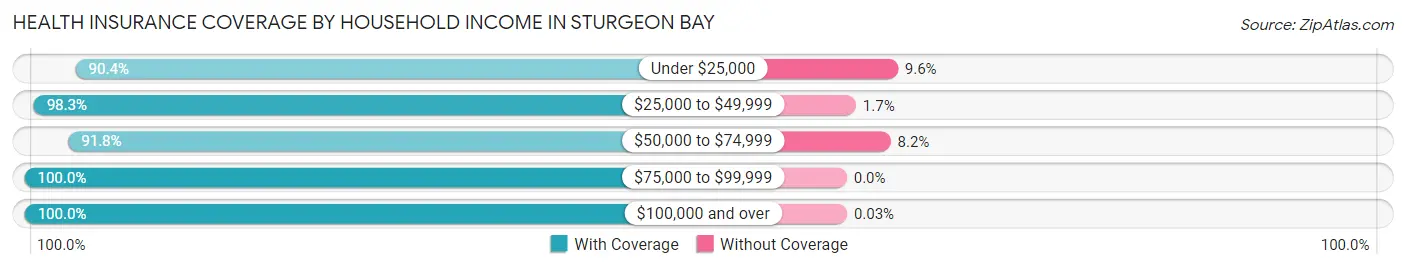
| Household Income | With Coverage | Without Coverage |
| Under $25,000 | 1,049 (90.4%) | 111 (9.6%) |
| $25,000 to $49,999 | 1,494 (98.3%) | 26 (1.7%) |
| $50,000 to $74,999 | 1,778 (91.8%) | 159 (8.2%) |
| $75,000 to $99,999 | 1,540 (100.0%) | 0 (0.0%) |
| $100,000 and over | 3,258 (100.0%) | 1 (0.0%) |
Public vs Private Health Insurance Coverage by Age in Sturgeon Bay
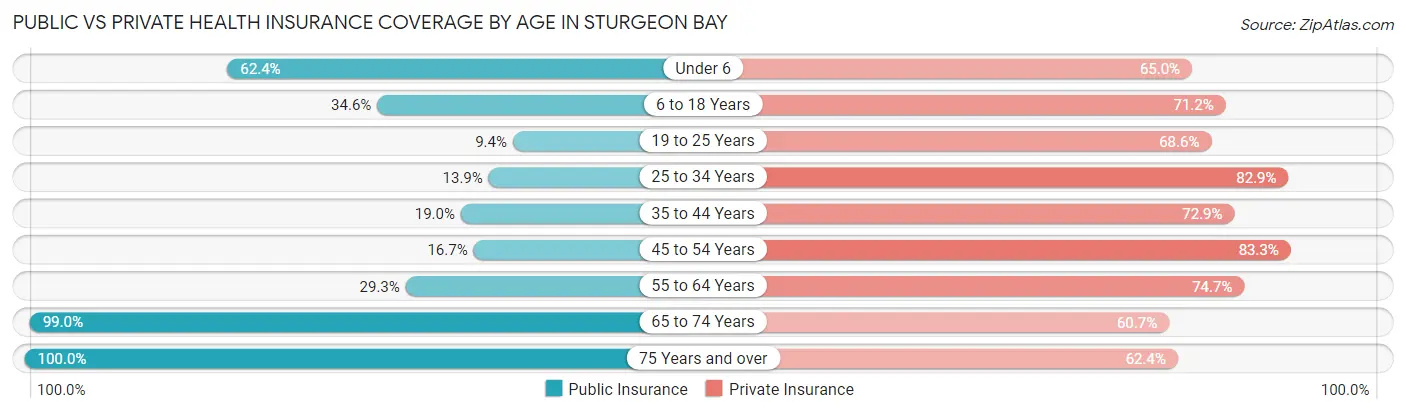
| Age Bracket | Public Insurance | Private Insurance |
| Under 6 | 260 (62.4%) | 271 (65.0%) |
| 6 to 18 Years | 496 (34.6%) | 1,022 (71.2%) |
| 19 to 25 Years | 51 (9.4%) | 373 (68.6%) |
| 25 to 34 Years | 128 (13.9%) | 765 (82.9%) |
| 35 to 44 Years | 216 (19.0%) | 827 (72.9%) |
| 45 to 54 Years | 181 (16.7%) | 904 (83.3%) |
| 55 to 64 Years | 494 (29.3%) | 1,260 (74.7%) |
| 65 to 74 Years | 1,450 (99.0%) | 889 (60.7%) |
| 75 Years and over | 741 (100.0%) | 462 (62.4%) |
| Total | 4,017 (42.6%) | 6,773 (71.8%) |
Disability Status by Sex by Age in Sturgeon Bay
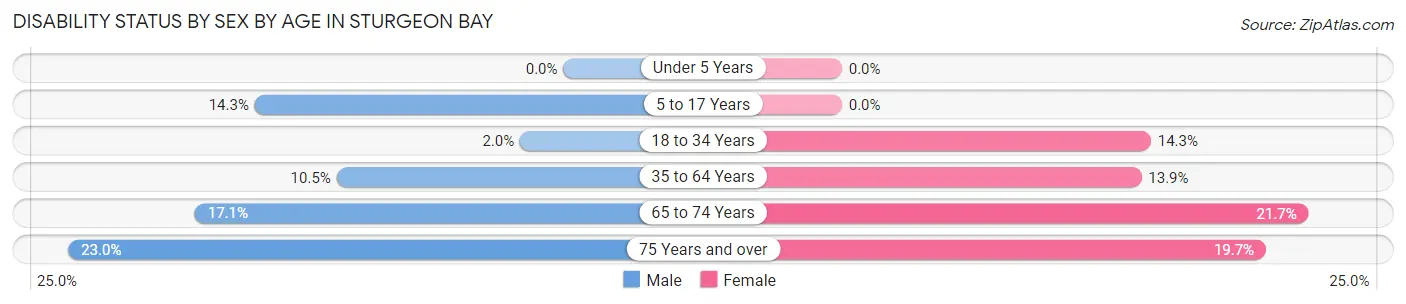
| Age Bracket | Male | Female |
| Under 5 Years | 0 (0.0%) | 0 (0.0%) |
| 5 to 17 Years | 109 (14.3%) | 0 (0.0%) |
| 18 to 34 Years | 15 (2.0%) | 116 (14.3%) |
| 35 to 64 Years | 206 (10.5%) | 271 (13.9%) |
| 65 to 74 Years | 98 (17.1%) | 193 (21.7%) |
| 75 Years and over | 71 (23.0%) | 85 (19.7%) |
Disability Class by Sex by Age in Sturgeon Bay
Disability Class: Hearing Difficulty
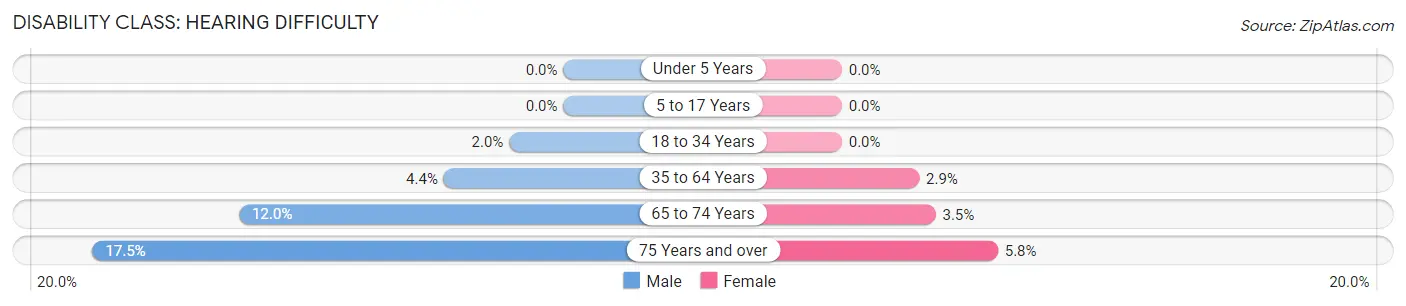
| Age Bracket | Male | Female |
| Under 5 Years | 0 (0.0%) | 0 (0.0%) |
| 5 to 17 Years | 0 (0.0%) | 0 (0.0%) |
| 18 to 34 Years | 15 (2.0%) | 0 (0.0%) |
| 35 to 64 Years | 87 (4.4%) | 56 (2.9%) |
| 65 to 74 Years | 69 (12.0%) | 31 (3.5%) |
| 75 Years and over | 54 (17.5%) | 25 (5.8%) |
Disability Class: Vision Difficulty
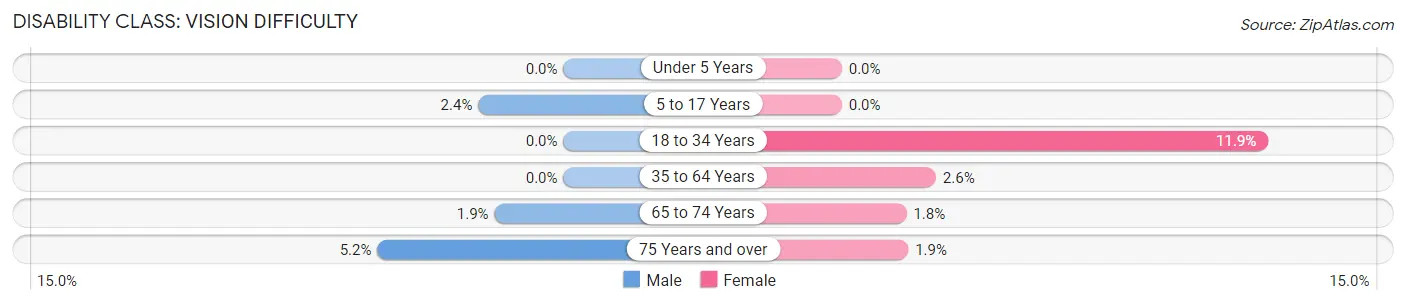
| Age Bracket | Male | Female |
| Under 5 Years | 0 (0.0%) | 0 (0.0%) |
| 5 to 17 Years | 18 (2.4%) | 0 (0.0%) |
| 18 to 34 Years | 0 (0.0%) | 96 (11.9%) |
| 35 to 64 Years | 0 (0.0%) | 51 (2.6%) |
| 65 to 74 Years | 11 (1.9%) | 16 (1.8%) |
| 75 Years and over | 16 (5.2%) | 8 (1.8%) |
Disability Class: Cognitive Difficulty
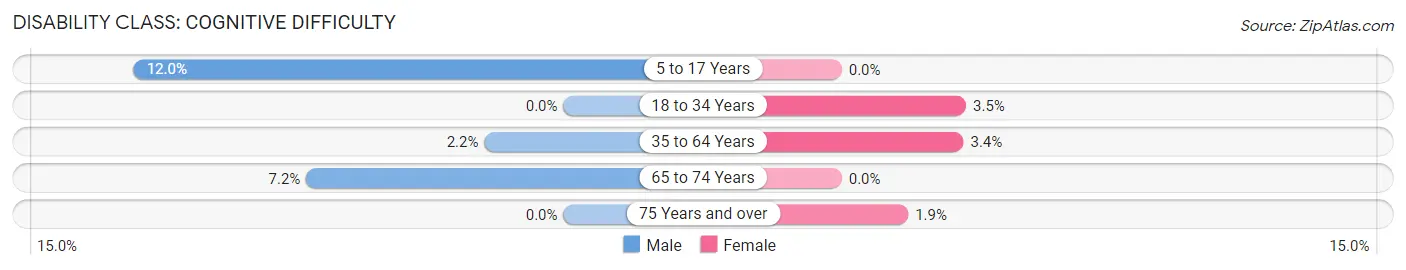
| Age Bracket | Male | Female |
| 5 to 17 Years | 91 (12.0%) | 0 (0.0%) |
| 18 to 34 Years | 0 (0.0%) | 28 (3.5%) |
| 35 to 64 Years | 43 (2.2%) | 66 (3.4%) |
| 65 to 74 Years | 41 (7.2%) | 0 (0.0%) |
| 75 Years and over | 0 (0.0%) | 8 (1.8%) |
Disability Class: Ambulatory Difficulty
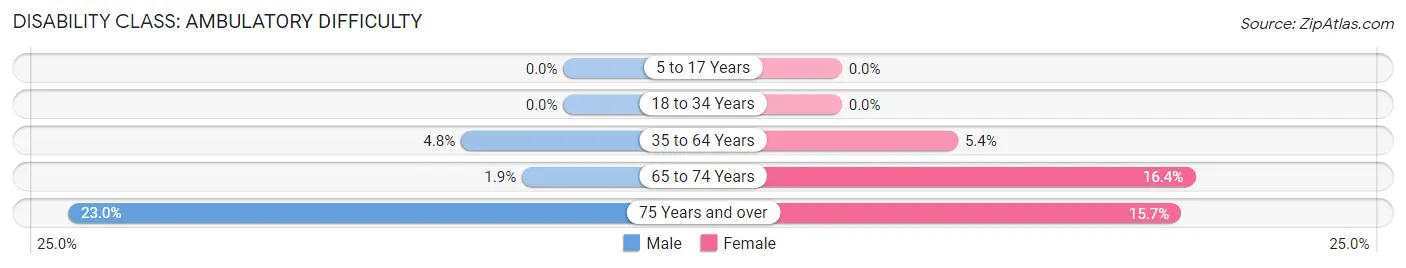
| Age Bracket | Male | Female |
| 5 to 17 Years | 0 (0.0%) | 0 (0.0%) |
| 18 to 34 Years | 0 (0.0%) | 0 (0.0%) |
| 35 to 64 Years | 93 (4.8%) | 105 (5.4%) |
| 65 to 74 Years | 11 (1.9%) | 146 (16.4%) |
| 75 Years and over | 71 (23.0%) | 68 (15.7%) |
Disability Class: Self-Care Difficulty
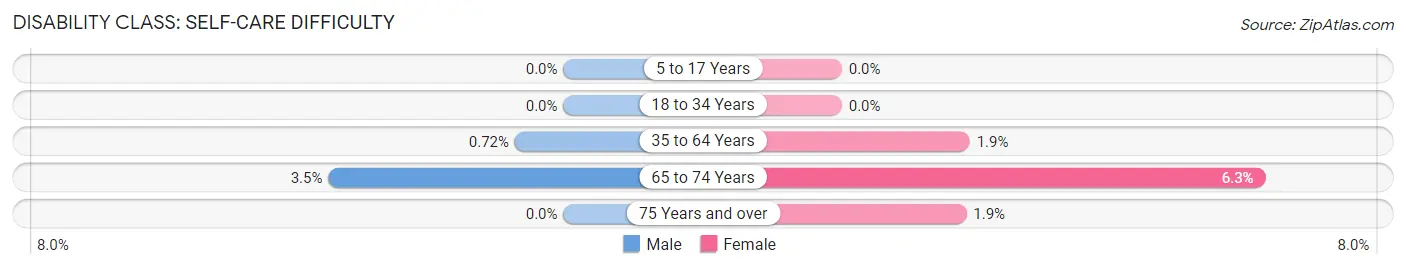
| Age Bracket | Male | Female |
| 5 to 17 Years | 0 (0.0%) | 0 (0.0%) |
| 18 to 34 Years | 0 (0.0%) | 0 (0.0%) |
| 35 to 64 Years | 14 (0.7%) | 37 (1.9%) |
| 65 to 74 Years | 20 (3.5%) | 56 (6.3%) |
| 75 Years and over | 0 (0.0%) | 8 (1.8%) |
Technology Access in Sturgeon Bay
Computing Device Access in Sturgeon Bay
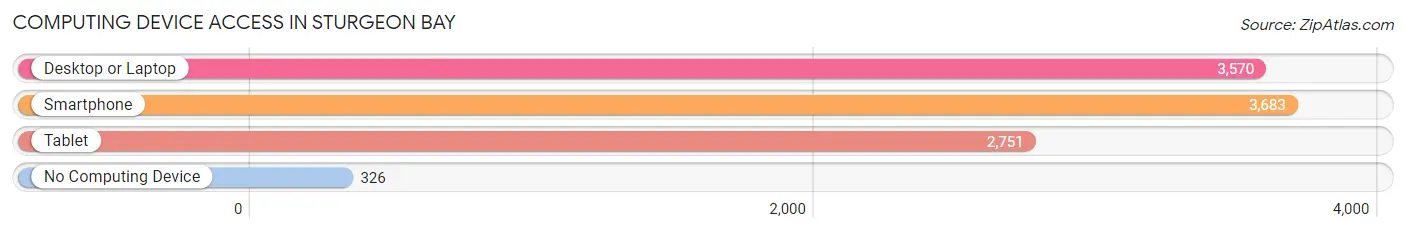
| Device Type | # Households | % Households |
| Desktop or Laptop | 3,570 | 77.1% |
| Smartphone | 3,683 | 79.5% |
| Tablet | 2,751 | 59.4% |
| No Computing Device | 326 | 7.0% |
| Total | 4,632 | 100.0% |
Internet Access in Sturgeon Bay
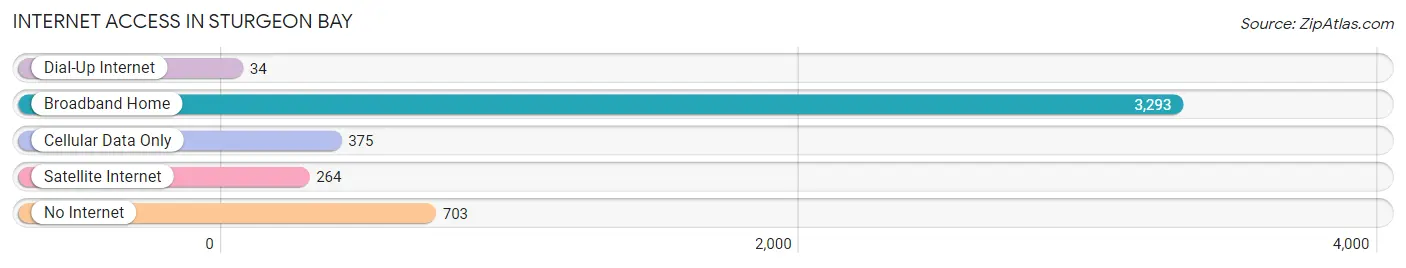
| Internet Type | # Households | % Households |
| Dial-Up Internet | 34 | 0.7% |
| Broadband Home | 3,293 | 71.1% |
| Cellular Data Only | 375 | 8.1% |
| Satellite Internet | 264 | 5.7% |
| No Internet | 703 | 15.2% |
| Total | 4,632 | 100.0% |
Sturgeon Bay Summary
Sturgeon Bay is a city located in Door County, Wisconsin, United States. It is the county seat of Door County and is located on the eastern shore of the Bay of Green Bay. The city is situated on the Sturgeon Bay Ship Canal, which connects the Bay of Green Bay to Lake Michigan. As of the 2010 census, the city had a population of 9,144.
History
The area that is now Sturgeon Bay was first inhabited by the Menominee and Potawatomi Native American tribes. The first European settlers arrived in the area in the early 19th century, and the city was officially incorporated in 1884. The city was named after the Sturgeon Bay Ship Canal, which was built in 1881 to connect the Bay of Green Bay to Lake Michigan.
The city quickly became an important port and commercial center for the region. The city was home to a number of industries, including shipbuilding, lumber, and fishing. The city also became a popular tourist destination, with many visitors coming to enjoy the city’s beaches and waterfront.
In the late 20th century, the city began to experience a decline in its traditional industries. The city’s economy shifted to focus more on tourism and service industries. The city has also become a popular destination for retirees.
Geography
Sturgeon Bay is located at 44°49′N 87°22′W (44.817, -87.367). According to the United States Census Bureau, the city has a total area of 8.2 square miles (21.2 km2), of which 7.9 square miles (20.5 km2) is land and 0.3 square miles (0.7 km2) is water.
The city is located on the eastern shore of the Bay of Green Bay, which is connected to Lake Michigan by the Sturgeon Bay Ship Canal. The city is surrounded by a number of small islands, including Little Sturgeon Bay, Pilot Island, and Washington Island.
Economy
Sturgeon Bay’s economy is largely based on tourism and service industries. The city is home to a number of hotels, restaurants, and other tourist attractions. The city is also home to a number of manufacturing and industrial businesses, including shipbuilding, lumber, and fishing.
Demographics
As of the 2010 census, there were 9,144 people, 3,945 households, and 2,521 families residing in the city. The population density was 1,154.3 people per square mile (446.3/km2). There were 4,093 housing units at an average density of 517.3 per square mile (199.7/km2). The racial makeup of the city was 95.2% White, 0.7% African American, 0.7% Native American, 0.7% Asian, 0.1% Pacific Islander, 1.3% from other races, and 1.5% from two or more races. Hispanic or Latino of any race were 3.2% of the population.
There were 3,945 households, out of which 28.2% had children under the age of 18 living with them, 48.2% were married couples living together, 11.2% had a female householder with no husband present, and 36.3% were non-families. 30.2% of all households were made up of individuals, and 13.2% had someone living alone who was 65 years of age or older. The average household size was 2.31 and the average family size was 2.86.
In the city, the population was spread out, with 23.2% under the age of 18, 8.2% from 18 to 24, 25.7% from 25 to 44, 25.2% from 45 to 64, and 17.7% who were 65 years of age or older. The median age was 40 years. For every 100 females, there were 92.3 males. For every 100 females age 18 and over, there were 88.7 males.
The median income for a household in the city was $41,945, and the median income for a family was $51,945. Males had a median income of $36,945 versus $25,945 for females. The per capita income for the city was $21,945. About 6.2% of families and 8.7% of the population were below the poverty line, including 11.2% of those under age 18 and 6.2% of those age 65 or over.
Common Questions
What is Per Capita Income in Sturgeon Bay?
Per Capita income in Sturgeon Bay is $39,271.
What is the Median Family Income in Sturgeon Bay?
Median Family Income in Sturgeon Bay is $77,414.
What is the Median Household income in Sturgeon Bay?
Median Household Income in Sturgeon Bay is $55,791.
What is Income or Wage Gap in Sturgeon Bay?
Income or Wage Gap in Sturgeon Bay is 24.8%.
Women in Sturgeon Bay earn 75.2 cents for every dollar earned by a man.
What is Inequality or Gini Index in Sturgeon Bay?
Inequality or Gini Index in Sturgeon Bay is 0.45.
What is the Total Population of Sturgeon Bay?
Total Population of Sturgeon Bay is 9,620.
What is the Total Male Population of Sturgeon Bay?
Total Male Population of Sturgeon Bay is 4,624.
What is the Total Female Population of Sturgeon Bay?
Total Female Population of Sturgeon Bay is 4,996.
What is the Ratio of Males per 100 Females in Sturgeon Bay?
There are 92.55 Males per 100 Females in Sturgeon Bay.
What is the Ratio of Females per 100 Males in Sturgeon Bay?
There are 108.04 Females per 100 Males in Sturgeon Bay.
What is the Median Population Age in Sturgeon Bay?
Median Population Age in Sturgeon Bay is 46.2 Years.
What is the Average Family Size in Sturgeon Bay
Average Family Size in Sturgeon Bay is 2.8 People.
What is the Average Household Size in Sturgeon Bay
Average Household Size in Sturgeon Bay is 2.0 People.
How Large is the Labor Force in Sturgeon Bay?
There are 5,075 People in the Labor Forcein in Sturgeon Bay.
What is the Percentage of People in the Labor Force in Sturgeon Bay?
63.5% of People are in the Labor Force in Sturgeon Bay.
What is the Unemployment Rate in Sturgeon Bay?
Unemployment Rate in Sturgeon Bay is 5.0%.