Cities with the Most Immigrants from Europe in Wisconsin
RELATED REPORTS & OPTIONS
Europe
Wisconsin
Compare Cities
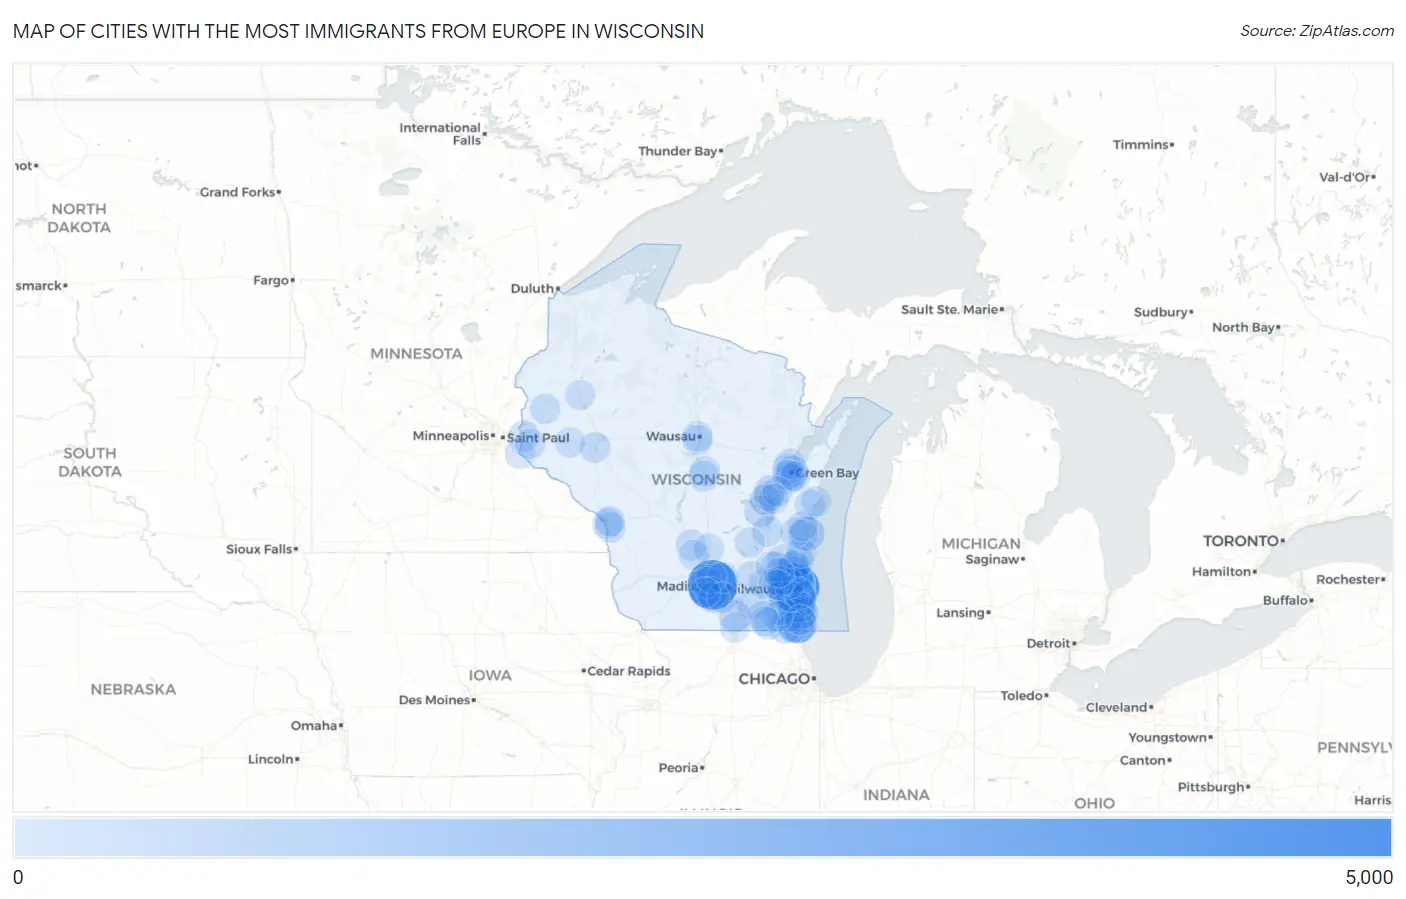
Map of Cities with the Most Immigrants from Europe in Wisconsin
0
5,000
Cities with the Most Immigrants from Europe in Wisconsin
| City | Europe | vs State | vs National | |
| 1. | Madison | 4,002 | 46,485(8.61%)#1 | 4,820,287(0.08%)#120 |
| 2. | Milwaukee | 3,804 | 46,485(8.18%)#2 | 4,820,287(0.08%)#129 |
| 3. | Kenosha | 1,768 | 46,485(3.80%)#3 | 4,820,287(0.04%)#348 |
| 4. | Oak Creek | 952 | 46,485(2.05%)#4 | 4,820,287(0.02%)#724 |
| 5. | Sheboygan | 845 | 46,485(1.82%)#5 | 4,820,287(0.02%)#810 |
| 6. | Greenfield | 830 | 46,485(1.79%)#6 | 4,820,287(0.02%)#818 |
| 7. | Mequon | 825 | 46,485(1.77%)#7 | 4,820,287(0.02%)#822 |
| 8. | South Milwaukee | 712 | 46,485(1.53%)#8 | 4,820,287(0.01%)#965 |
| 9. | Brookfield | 701 | 46,485(1.51%)#9 | 4,820,287(0.01%)#984 |
| 10. | Wauwatosa | 677 | 46,485(1.46%)#10 | 4,820,287(0.01%)#1,032 |
| 11. | New Berlin | 618 | 46,485(1.33%)#11 | 4,820,287(0.01%)#1,124 |
| 12. | Shorewood | 552 | 46,485(1.19%)#12 | 4,820,287(0.01%)#1,266 |
| 13. | West Allis | 504 | 46,485(1.08%)#13 | 4,820,287(0.01%)#1,370 |
| 14. | Mount Pleasant | 501 | 46,485(1.08%)#14 | 4,820,287(0.01%)#1,377 |
| 15. | Menomonee Falls | 468 | 46,485(1.01%)#15 | 4,820,287(0.01%)#1,460 |
| 16. | Franklin | 433 | 46,485(0.93%)#16 | 4,820,287(0.01%)#1,544 |
| 17. | Racine | 413 | 46,485(0.89%)#17 | 4,820,287(0.01%)#1,621 |
| 18. | Muskego | 407 | 46,485(0.88%)#18 | 4,820,287(0.01%)#1,654 |
| 19. | Glendale | 398 | 46,485(0.86%)#19 | 4,820,287(0.01%)#1,694 |
| 20. | Cudahy | 396 | 46,485(0.85%)#20 | 4,820,287(0.01%)#1,702 |
| 21. | Appleton | 392 | 46,485(0.84%)#21 | 4,820,287(0.01%)#1,713 |
| 22. | Janesville | 391 | 46,485(0.84%)#22 | 4,820,287(0.01%)#1,717 |
| 23. | Greendale | 355 | 46,485(0.76%)#23 | 4,820,287(0.01%)#1,836 |
| 24. | Whitefish Bay | 350 | 46,485(0.75%)#24 | 4,820,287(0.01%)#1,855 |
| 25. | Salem Lakes | 339 | 46,485(0.73%)#25 | 4,820,287(0.01%)#1,913 |
| 26. | Whitewater | 330 | 46,485(0.71%)#26 | 4,820,287(0.01%)#1,946 |
| 27. | Middleton | 321 | 46,485(0.69%)#27 | 4,820,287(0.01%)#1,998 |
| 28. | Grafton | 308 | 46,485(0.66%)#28 | 4,820,287(0.01%)#2,065 |
| 29. | Oshkosh | 287 | 46,485(0.62%)#29 | 4,820,287(0.01%)#2,163 |
| 30. | Cedarburg | 282 | 46,485(0.61%)#30 | 4,820,287(0.01%)#2,185 |
| 31. | Green Bay | 271 | 46,485(0.58%)#31 | 4,820,287(0.01%)#2,233 |
| 32. | Lake Geneva | 259 | 46,485(0.56%)#32 | 4,820,287(0.01%)#2,315 |
| 33. | Fox Point | 259 | 46,485(0.56%)#33 | 4,820,287(0.01%)#2,317 |
| 34. | Pleasant Prairie | 252 | 46,485(0.54%)#34 | 4,820,287(0.01%)#2,360 |
| 35. | Hudson | 236 | 46,485(0.51%)#35 | 4,820,287(0.00%)#2,476 |
| 36. | Fitchburg | 233 | 46,485(0.50%)#36 | 4,820,287(0.00%)#2,499 |
| 37. | Brown Deer | 232 | 46,485(0.50%)#37 | 4,820,287(0.00%)#2,512 |
| 38. | Oregon | 228 | 46,485(0.49%)#38 | 4,820,287(0.00%)#2,546 |
| 39. | Lake Delton | 210 | 46,485(0.45%)#39 | 4,820,287(0.00%)#2,667 |
| 40. | Fond Du Lac | 208 | 46,485(0.45%)#40 | 4,820,287(0.00%)#2,684 |
| 41. | Germantown | 205 | 46,485(0.44%)#41 | 4,820,287(0.00%)#2,708 |
| 42. | Caledonia | 203 | 46,485(0.44%)#42 | 4,820,287(0.00%)#2,724 |
| 43. | Sun Prairie | 202 | 46,485(0.43%)#43 | 4,820,287(0.00%)#2,732 |
| 44. | Neenah | 196 | 46,485(0.42%)#44 | 4,820,287(0.00%)#2,788 |
| 45. | Bayside | 196 | 46,485(0.42%)#45 | 4,820,287(0.00%)#2,795 |
| 46. | West Bend | 181 | 46,485(0.39%)#46 | 4,820,287(0.00%)#2,923 |
| 47. | Eau Claire | 175 | 46,485(0.38%)#47 | 4,820,287(0.00%)#3,003 |
| 48. | Manitowoc | 173 | 46,485(0.37%)#48 | 4,820,287(0.00%)#3,016 |
| 49. | Oconomowoc | 173 | 46,485(0.37%)#49 | 4,820,287(0.00%)#3,017 |
| 50. | Plover | 172 | 46,485(0.37%)#50 | 4,820,287(0.00%)#3,029 |
| 51. | Union Grove | 171 | 46,485(0.37%)#51 | 4,820,287(0.00%)#3,047 |
| 52. | La Crosse | 166 | 46,485(0.36%)#52 | 4,820,287(0.00%)#3,105 |
| 53. | Waunakee | 159 | 46,485(0.34%)#53 | 4,820,287(0.00%)#3,208 |
| 54. | Hales Corners | 156 | 46,485(0.34%)#54 | 4,820,287(0.00%)#3,249 |
| 55. | Wausau | 153 | 46,485(0.33%)#55 | 4,820,287(0.00%)#3,276 |
| 56. | Stoughton | 152 | 46,485(0.33%)#56 | 4,820,287(0.00%)#3,289 |
| 57. | Sheboygan Falls | 146 | 46,485(0.31%)#57 | 4,820,287(0.00%)#3,380 |
| 58. | Waupun | 139 | 46,485(0.30%)#58 | 4,820,287(0.00%)#3,478 |
| 59. | Hartford | 136 | 46,485(0.29%)#59 | 4,820,287(0.00%)#3,516 |
| 60. | De Pere | 135 | 46,485(0.29%)#60 | 4,820,287(0.00%)#3,528 |
| 61. | Allouez | 135 | 46,485(0.29%)#61 | 4,820,287(0.00%)#3,532 |
| 62. | Butler | 132 | 46,485(0.28%)#62 | 4,820,287(0.00%)#3,581 |
| 63. | Howard | 128 | 46,485(0.28%)#63 | 4,820,287(0.00%)#3,639 |
| 64. | Slinger | 122 | 46,485(0.26%)#64 | 4,820,287(0.00%)#3,757 |
| 65. | St Francis | 120 | 46,485(0.26%)#65 | 4,820,287(0.00%)#3,791 |
| 66. | French Island | 116 | 46,485(0.25%)#66 | 4,820,287(0.00%)#3,861 |
| 67. | Sussex | 115 | 46,485(0.25%)#67 | 4,820,287(0.00%)#3,867 |
| 68. | Port Washington | 114 | 46,485(0.25%)#68 | 4,820,287(0.00%)#3,880 |
| 69. | Amery | 112 | 46,485(0.24%)#69 | 4,820,287(0.00%)#3,937 |
| 70. | Stevens Point | 111 | 46,485(0.24%)#70 | 4,820,287(0.00%)#3,943 |
| 71. | Portage | 111 | 46,485(0.24%)#71 | 4,820,287(0.00%)#3,949 |
| 72. | Onalaska | 104 | 46,485(0.22%)#72 | 4,820,287(0.00%)#4,079 |
| 73. | Bristol | 104 | 46,485(0.22%)#73 | 4,820,287(0.00%)#4,094 |
| 74. | Waterford | 103 | 46,485(0.22%)#74 | 4,820,287(0.00%)#4,123 |
| 75. | Watertown | 101 | 46,485(0.22%)#75 | 4,820,287(0.00%)#4,156 |
| 76. | Baraboo | 99 | 46,485(0.21%)#76 | 4,820,287(0.00%)#4,209 |
| 77. | Menomonie | 98 | 46,485(0.21%)#77 | 4,820,287(0.00%)#4,225 |
| 78. | Verona | 97 | 46,485(0.21%)#78 | 4,820,287(0.00%)#4,251 |
| 79. | Somers | 94 | 46,485(0.20%)#79 | 4,820,287(0.00%)#4,325 |
| 80. | Beloit | 93 | 46,485(0.20%)#80 | 4,820,287(0.00%)#4,337 |
| 81. | Belgium | 93 | 46,485(0.20%)#81 | 4,820,287(0.00%)#4,357 |
| 82. | Rib Mountain | 92 | 46,485(0.20%)#82 | 4,820,287(0.00%)#4,381 |
| 83. | Menasha | 88 | 46,485(0.19%)#83 | 4,820,287(0.00%)#4,473 |
| 84. | Hartland | 84 | 46,485(0.18%)#84 | 4,820,287(0.00%)#4,596 |
| 85. | Prescott | 84 | 46,485(0.18%)#85 | 4,820,287(0.00%)#4,606 |
| 86. | Suamico | 83 | 46,485(0.18%)#86 | 4,820,287(0.00%)#4,621 |
| 87. | Plymouth | 81 | 46,485(0.17%)#87 | 4,820,287(0.00%)#4,675 |
| 88. | Ashwaubenon | 75 | 46,485(0.16%)#88 | 4,820,287(0.00%)#4,851 |
| 89. | Burlington | 75 | 46,485(0.16%)#89 | 4,820,287(0.00%)#4,858 |
| 90. | Howards Grove | 75 | 46,485(0.16%)#90 | 4,820,287(0.00%)#4,868 |
| 91. | Elkhorn | 74 | 46,485(0.16%)#91 | 4,820,287(0.00%)#4,885 |
| 92. | Kaukauna | 73 | 46,485(0.16%)#92 | 4,820,287(0.00%)#4,905 |
| 93. | Harrison | 72 | 46,485(0.15%)#93 | 4,820,287(0.00%)#4,933 |
| 94. | Pewaukee | 72 | 46,485(0.15%)#94 | 4,820,287(0.00%)#4,936 |
| 95. | River Falls | 69 | 46,485(0.15%)#95 | 4,820,287(0.00%)#5,031 |
| 96. | Richfield | 67 | 46,485(0.14%)#96 | 4,820,287(0.00%)#5,097 |
| 97. | Rice Lake | 67 | 46,485(0.14%)#97 | 4,820,287(0.00%)#5,100 |
| 98. | Bellevue | 64 | 46,485(0.14%)#98 | 4,820,287(0.00%)#5,197 |
| 99. | Como | 62 | 46,485(0.13%)#99 | 4,820,287(0.00%)#5,294 |
| 100. | Two Rivers | 61 | 46,485(0.13%)#100 | 4,820,287(0.00%)#5,305 |
Common Questions
What are the Top 10 Cities with the Most Immigrants from Europe in Wisconsin?
Top 10 Cities with the Most Immigrants from Europe in Wisconsin are:
#1
4,002
#2
3,804
#3
1,768
#4
952
#5
845
#6
830
#7
825
#8
712
#9
701
#10
677
What city has the Most Immigrants from Europe in Wisconsin?
Madison has the Most Immigrants from Europe in Wisconsin with 4,002.
What is the Total Immigrants from Europe in the State of Wisconsin?
Total Immigrants from Europe in Wisconsin is 46,485.
What is the Total Immigrants from Europe in the United States?
Total Immigrants from Europe in the United States is 4,820,287.