Westfield, WI
Westfield Map
Westfield Overview
1,270
TOTAL POPULATION
737
MALE POPULATION
533
FEMALE POPULATION
138.27
MALES / 100 FEMALES
72.32
FEMALES / 100 MALES
35.1
MEDIAN AGE
3.3
AVG FAMILY SIZE
2.5
AVG HOUSEHOLD SIZE
$26,595
PER CAPITA INCOME
$65,865
AVG FAMILY INCOME
$54,000
AVG HOUSEHOLD INCOME
1.8%
WAGE / INCOME GAP [ % ]
98.2¢/ $1
WAGE / INCOME GAP [ $ ]
0.36
INEQUALITY / GINI INDEX
677
LABOR FORCE [ PEOPLE ]
70.2%
PERCENT IN LABOR FORCE
1.9%
UNEMPLOYMENT RATE
Westfield Zip Codes
Westfield Area Codes
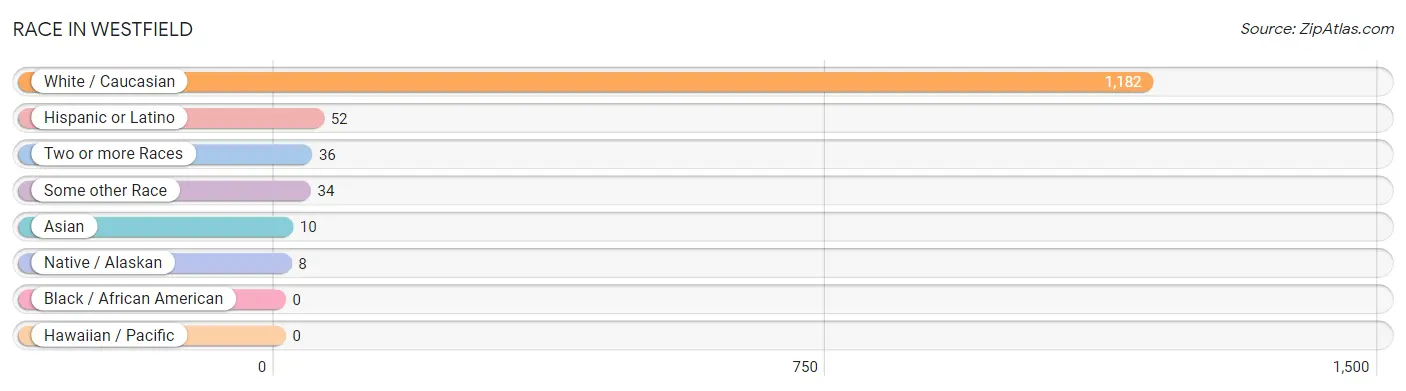
Race in Westfield
The most populous races in Westfield are White / Caucasian (1,182 | 93.1%), Hispanic or Latino (52 | 4.1%), and Two or more Races (36 | 2.8%).
| Race | # Population | % Population |
| Asian | 10 | 0.8% |
| Black / African American | 0 | 0.0% |
| Hawaiian / Pacific | 0 | 0.0% |
| Hispanic or Latino | 52 | 4.1% |
| Native / Alaskan | 8 | 0.6% |
| White / Caucasian | 1,182 | 93.1% |
| Two or more Races | 36 | 2.8% |
| Some other Race | 34 | 2.7% |
| Total | 1,270 | 100.0% |
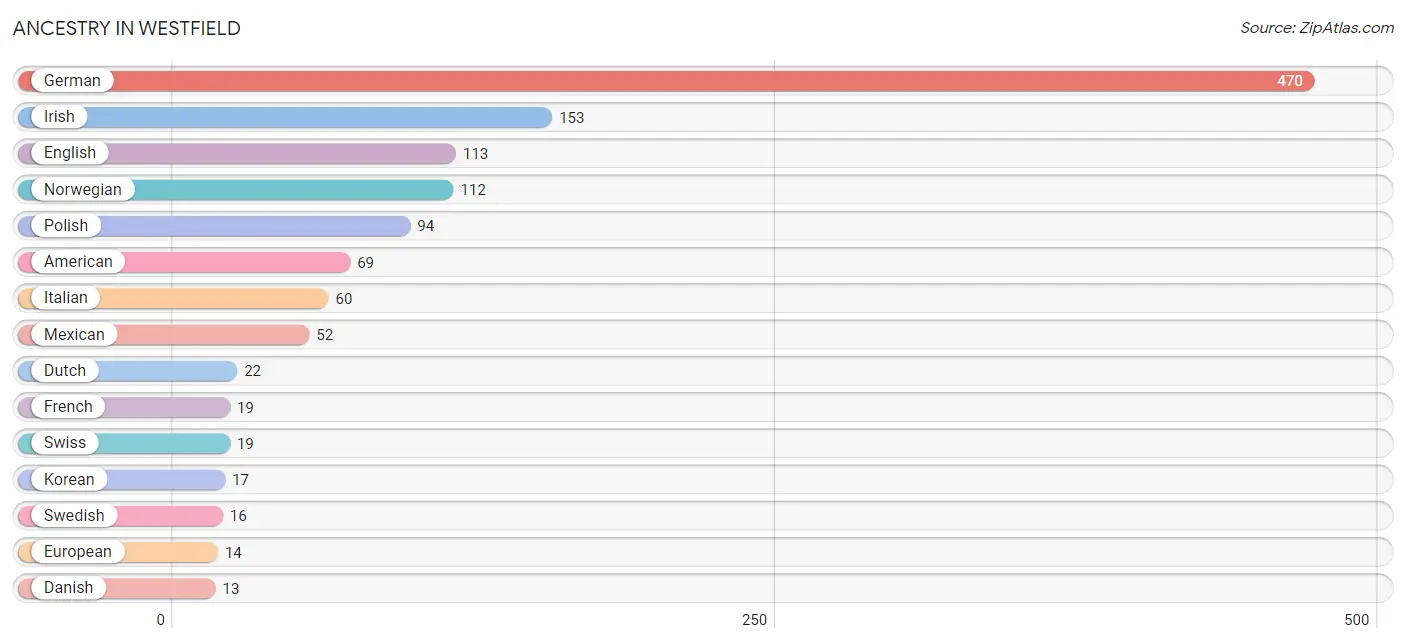
Ancestry in Westfield
The most populous ancestries reported in Westfield are German (470 | 37.0%), Irish (153 | 12.0%), English (113 | 8.9%), Norwegian (112 | 8.8%), and Polish (94 | 7.4%), together accounting for 74.2% of all Westfield residents.
| Ancestry | # Population | % Population |
| American | 69 | 5.4% |
| Austrian | 4 | 0.3% |
| British | 11 | 0.9% |
| Cherokee | 8 | 0.6% |
| Czech | 4 | 0.3% |
| Danish | 13 | 1.0% |
| Dutch | 22 | 1.7% |
| English | 113 | 8.9% |
| European | 14 | 1.1% |
| Finnish | 12 | 0.9% |
| French | 19 | 1.5% |
| French Canadian | 7 | 0.5% |
| German | 470 | 37.0% |
| Greek | 5 | 0.4% |
| Irish | 153 | 12.0% |
| Italian | 60 | 4.7% |
| Korean | 17 | 1.3% |
| Mexican | 52 | 4.1% |
| Norwegian | 112 | 8.8% |
| Polish | 94 | 7.4% |
| Portuguese | 3 | 0.2% |
| Russian | 3 | 0.2% |
| Scandinavian | 3 | 0.2% |
| Scottish | 9 | 0.7% |
| Slavic | 3 | 0.2% |
| Slovak | 3 | 0.2% |
| Swedish | 16 | 1.3% |
| Swiss | 19 | 1.5% |
| Ukrainian | 9 | 0.7% |
| Welsh | 9 | 0.7% | View All 30 Rows |
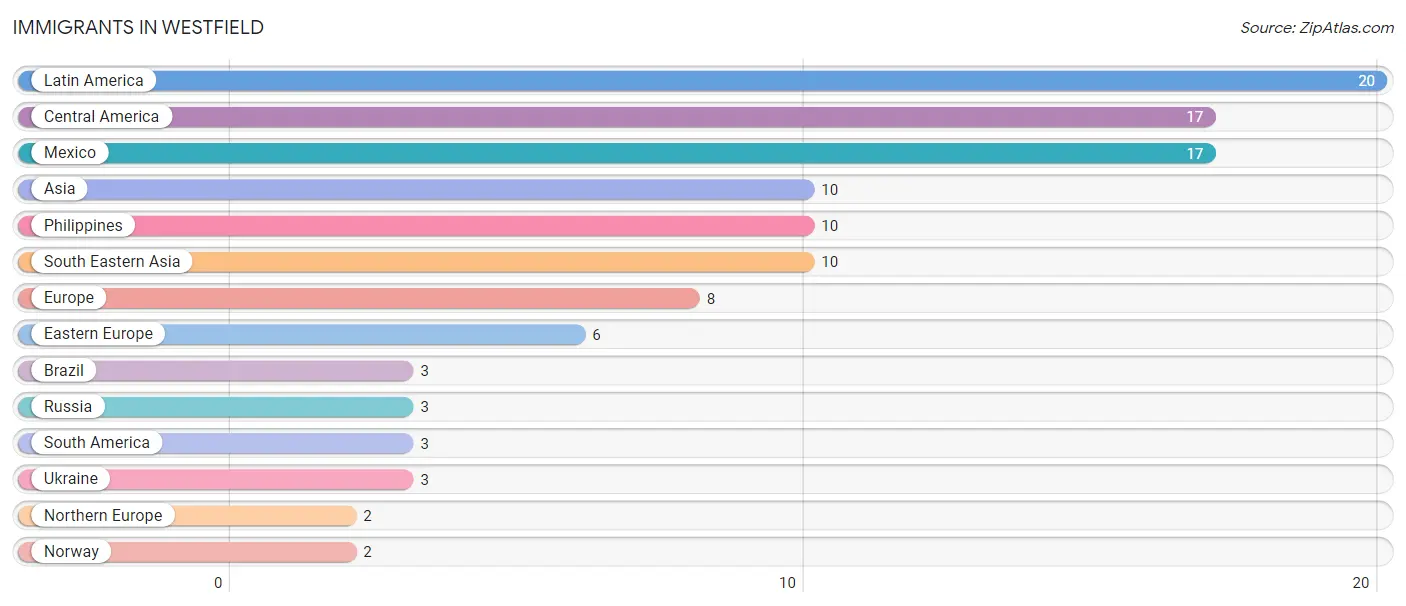
Immigrants in Westfield
The most numerous immigrant groups reported in Westfield came from Latin America (20 | 1.6%), Central America (17 | 1.3%), Mexico (17 | 1.3%), Asia (10 | 0.8%), and Philippines (10 | 0.8%), together accounting for 5.8% of all Westfield residents.
| Immigration Origin | # Population | % Population |
| Asia | 10 | 0.8% |
| Brazil | 3 | 0.2% |
| Central America | 17 | 1.3% |
| Eastern Europe | 6 | 0.5% |
| Europe | 8 | 0.6% |
| Latin America | 20 | 1.6% |
| Mexico | 17 | 1.3% |
| Northern Europe | 2 | 0.2% |
| Norway | 2 | 0.2% |
| Philippines | 10 | 0.8% |
| Russia | 3 | 0.2% |
| South America | 3 | 0.2% |
| South Eastern Asia | 10 | 0.8% |
| Ukraine | 3 | 0.2% | View All 14 Rows |
Sex and Age in Westfield
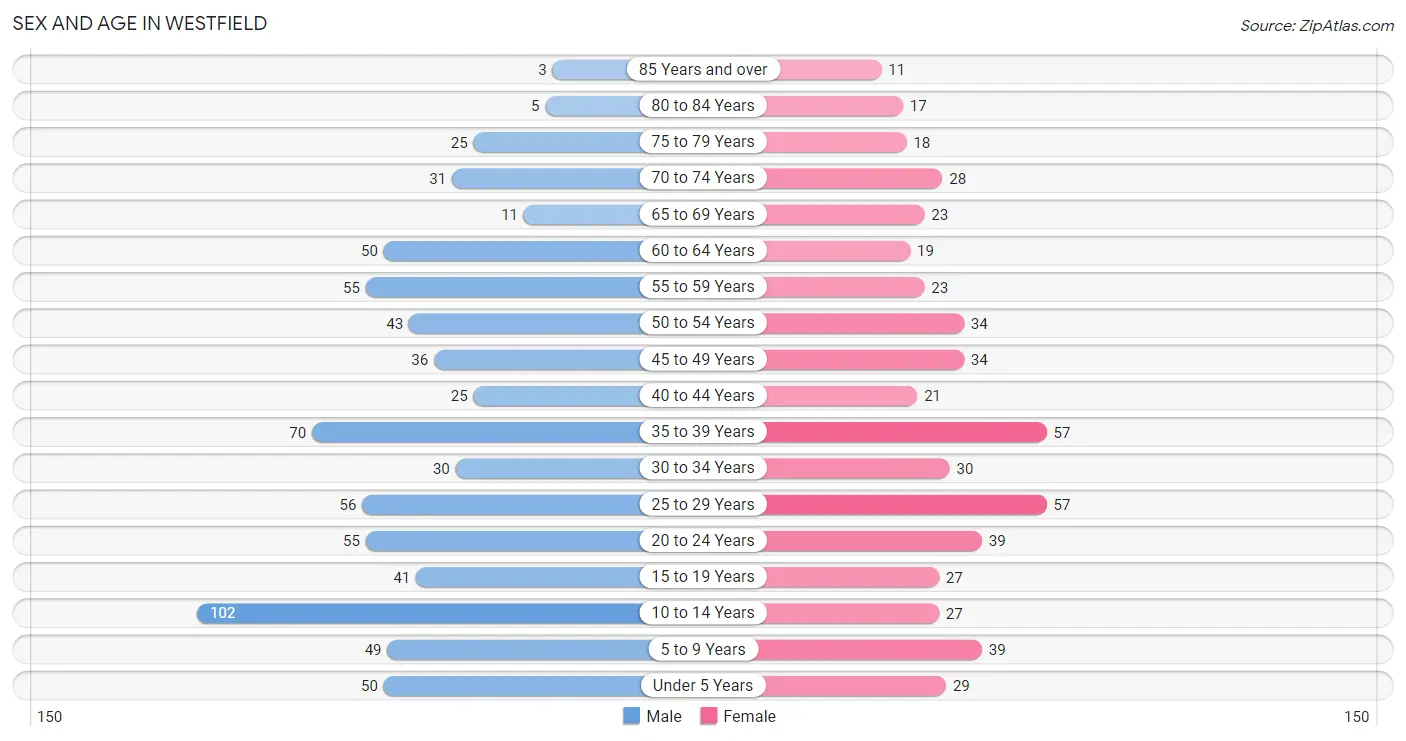
Sex and Age in Westfield
The most populous age groups in Westfield are 10 to 14 Years (102 | 13.8%) for men and 25 to 29 Years (57 | 10.7%) for women.
| Age Bracket | Male | Female |
| Under 5 Years | 50 (6.8%) | 29 (5.4%) |
| 5 to 9 Years | 49 (6.7%) | 39 (7.3%) |
| 10 to 14 Years | 102 (13.8%) | 27 (5.1%) |
| 15 to 19 Years | 41 (5.6%) | 27 (5.1%) |
| 20 to 24 Years | 55 (7.5%) | 39 (7.3%) |
| 25 to 29 Years | 56 (7.6%) | 57 (10.7%) |
| 30 to 34 Years | 30 (4.1%) | 30 (5.6%) |
| 35 to 39 Years | 70 (9.5%) | 57 (10.7%) |
| 40 to 44 Years | 25 (3.4%) | 21 (3.9%) |
| 45 to 49 Years | 36 (4.9%) | 34 (6.4%) |
| 50 to 54 Years | 43 (5.8%) | 34 (6.4%) |
| 55 to 59 Years | 55 (7.5%) | 23 (4.3%) |
| 60 to 64 Years | 50 (6.8%) | 19 (3.6%) |
| 65 to 69 Years | 11 (1.5%) | 23 (4.3%) |
| 70 to 74 Years | 31 (4.2%) | 28 (5.2%) |
| 75 to 79 Years | 25 (3.4%) | 18 (3.4%) |
| 80 to 84 Years | 5 (0.7%) | 17 (3.2%) |
| 85 Years and over | 3 (0.4%) | 11 (2.1%) |
| Total | 737 (100.0%) | 533 (100.0%) |
Families and Households in Westfield
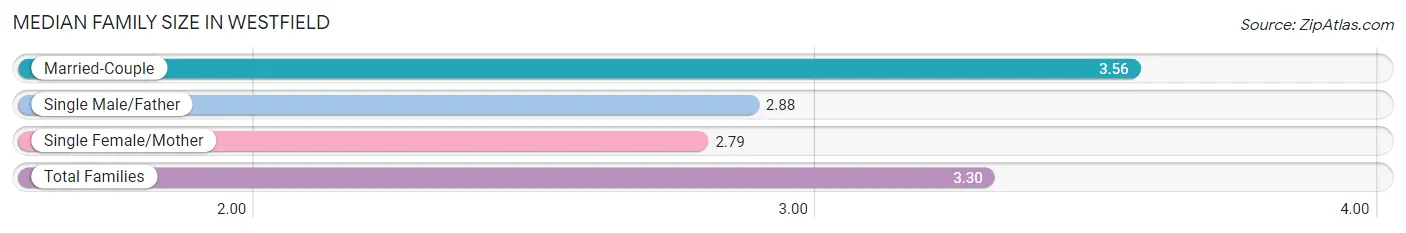
Median Family Size in Westfield
The median family size in Westfield is 3.30 persons per family, with married-couple families (175 | 64.6%) accounting for the largest median family size of 3.56 persons per family. On the other hand, single female/mother families (63 | 23.3%) represent the smallest median family size with 2.79 persons per family.
| Family Type | # Families | Family Size |
| Married-Couple | 175 (64.6%) | 3.56 |
| Single Male/Father | 33 (12.2%) | 2.88 |
| Single Female/Mother | 63 (23.3%) | 2.79 |
| Total Families | 271 (100.0%) | 3.30 |
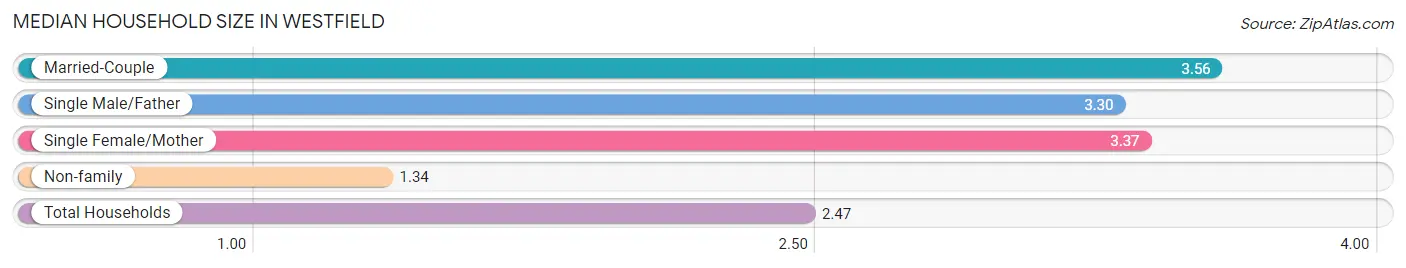
Median Household Size in Westfield
The median household size in Westfield is 2.47 persons per household, with married-couple households (175 | 34.2%) accounting for the largest median household size of 3.56 persons per household. non-family households (241 | 47.1%) represent the smallest median household size with 1.34 persons per household.
| Household Type | # Households | Household Size |
| Married-Couple | 175 (34.2%) | 3.56 |
| Single Male/Father | 33 (6.5%) | 3.30 |
| Single Female/Mother | 63 (12.3%) | 3.37 |
| Non-family | 241 (47.1%) | 1.34 |
| Total Households | 512 (100.0%) | 2.47 |
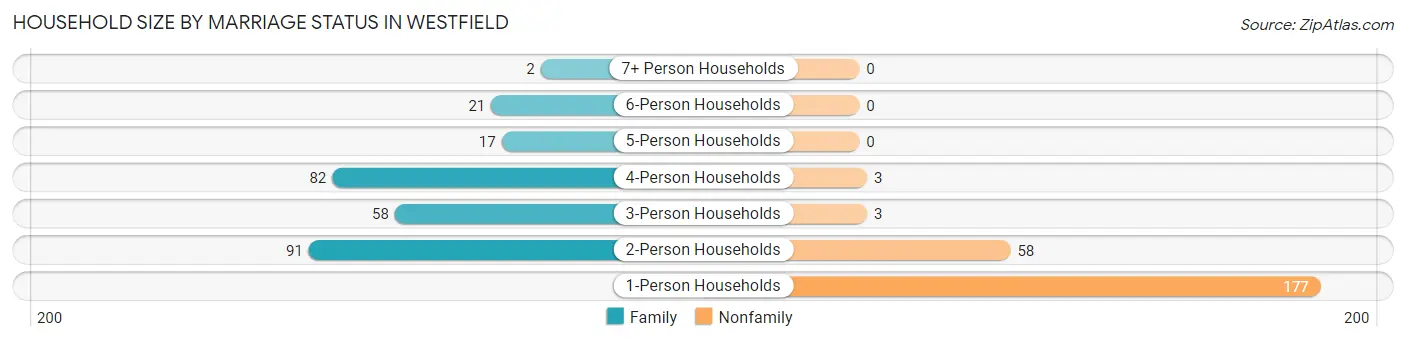
Household Size by Marriage Status in Westfield
Out of a total of 512 households in Westfield, 271 (52.9%) are family households, while 241 (47.1%) are nonfamily households. The most numerous type of family households are 2-person households, comprising 91, and the most common type of nonfamily households are 1-person households, comprising 177.
| Household Size | Family Households | Nonfamily Households |
| 1-Person Households | - | 177 (34.6%) |
| 2-Person Households | 91 (17.8%) | 58 (11.3%) |
| 3-Person Households | 58 (11.3%) | 3 (0.6%) |
| 4-Person Households | 82 (16.0%) | 3 (0.6%) |
| 5-Person Households | 17 (3.3%) | 0 (0.0%) |
| 6-Person Households | 21 (4.1%) | 0 (0.0%) |
| 7+ Person Households | 2 (0.4%) | 0 (0.0%) |
| Total | 271 (52.9%) | 241 (47.1%) |
Female Fertility in Westfield
Fertility by Age in Westfield
Average fertility rate in Westfield is 62.0 births per 1,000 women. Women in the age bracket of 15 to 19 years have the highest fertility rate with 148.0 births per 1,000 women. Women in the age bracket of 20 to 34 years acount for 58.8% of all women with births.
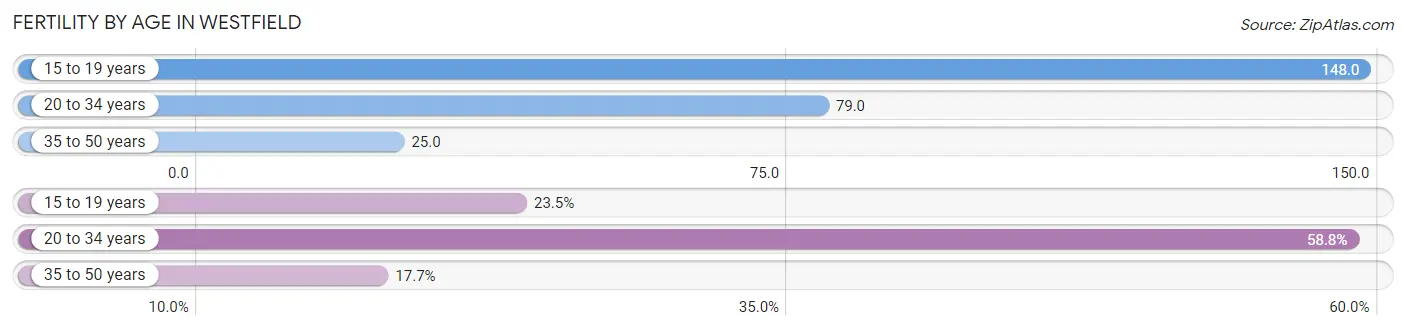
| Age Bracket | Women with Births | Births / 1,000 Women |
| 15 to 19 years | 4 (23.5%) | 148.0 |
| 20 to 34 years | 10 (58.8%) | 79.0 |
| 35 to 50 years | 3 (17.6%) | 25.0 |
| Total | 17 (100.0%) | 62.0 |
Fertility by Age by Marriage Status in Westfield
47.1% of women with births (17) in Westfield are married. The highest percentage of unmarried women with births falls into 15 to 19 years age bracket with 100.0% of them unmarried at the time of birth, while the lowest percentage of unmarried women with births belong to 35 to 50 years age bracket with 0.0% of them unmarried.
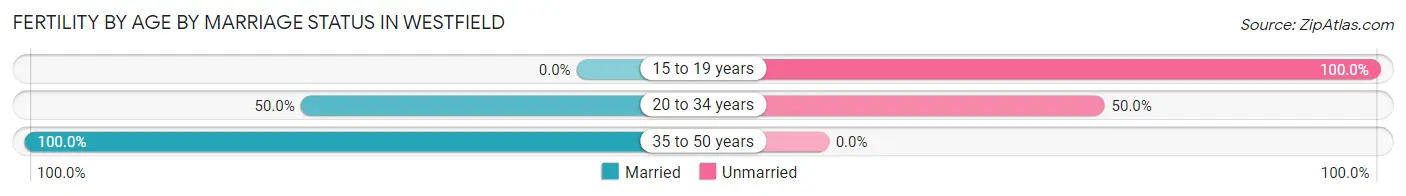
| Age Bracket | Married | Unmarried |
| 15 to 19 years | 0 (0.0%) | 4 (100.0%) |
| 20 to 34 years | 5 (50.0%) | 5 (50.0%) |
| 35 to 50 years | 3 (100.0%) | 0 (0.0%) |
| Total | 8 (47.1%) | 9 (52.9%) |
Fertility by Education in Westfield
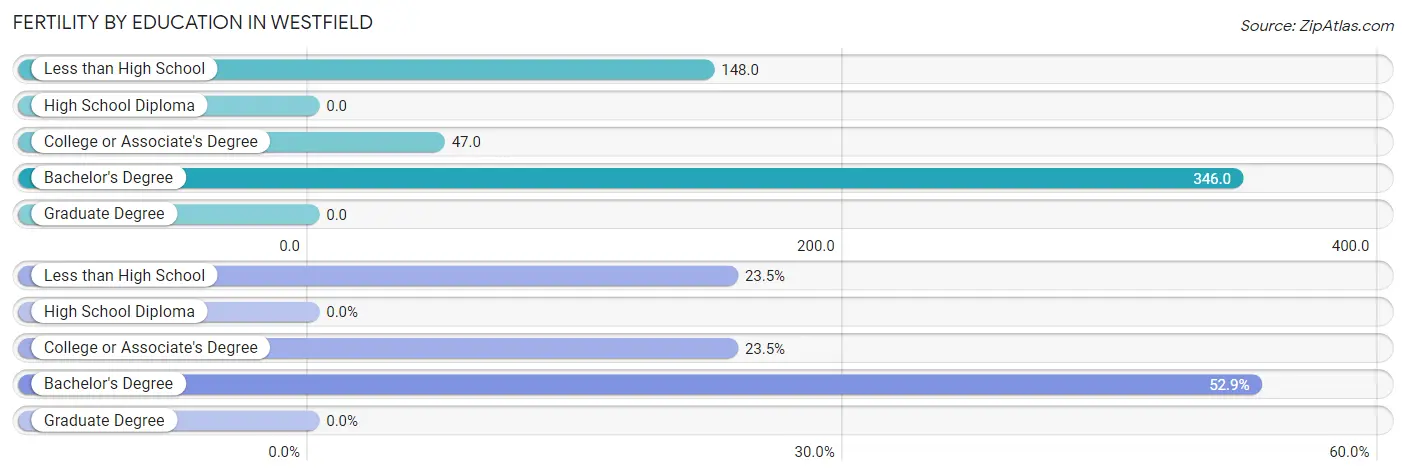
| Educational Attainment | Women with Births | Births / 1,000 Women |
| Less than High School | 4 (23.5%) | 148.0 |
| High School Diploma | 0 (0.0%) | 0.0 |
| College or Associate's Degree | 4 (23.5%) | 47.0 |
| Bachelor's Degree | 9 (52.9%) | 346.0 |
| Graduate Degree | 0 (0.0%) | 0.0 |
| Total | 17 (100.0%) | 62.0 |
Fertility by Education by Marriage Status in Westfield
52.9% of women with births in Westfield are unmarried. Women with the educational attainment of bachelor's degree are most likely to be married with 66.7% of them married at childbirth, while women with the educational attainment of less than high school are least likely to be married with 100.0% of them unmarried at childbirth.
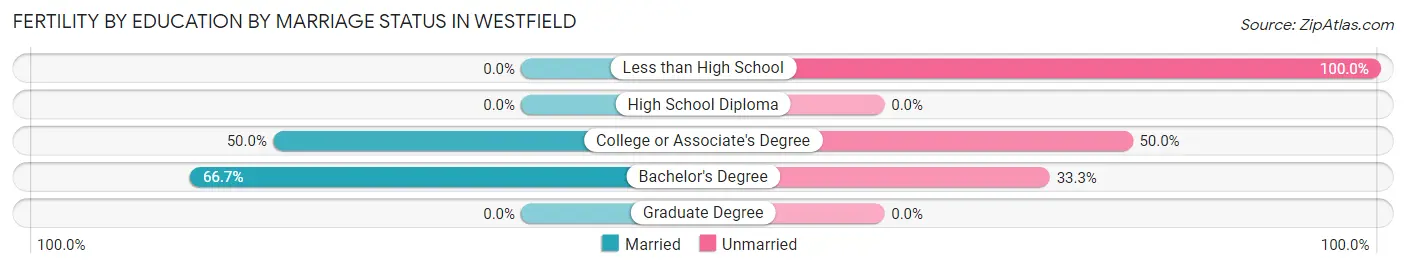
| Educational Attainment | Married | Unmarried |
| Less than High School | 0 (0.0%) | 4 (100.0%) |
| High School Diploma | 0 (0.0%) | 0 (0.0%) |
| College or Associate's Degree | 2 (50.0%) | 2 (50.0%) |
| Bachelor's Degree | 6 (66.7%) | 3 (33.3%) |
| Graduate Degree | 0 (0.0%) | 0 (0.0%) |
| Total | 8 (47.1%) | 9 (52.9%) |
Income in Westfield
Income Overview in Westfield
Per Capita Income in Westfield is $26,595, while median incomes of families and households are $65,865 and $54,000 respectively.
| Characteristic | Number | Measure |
| Per Capita Income | 1,270 | $26,595 |
| Median Family Income | 271 | $65,865 |
| Mean Family Income | 271 | $75,036 |
| Median Household Income | 512 | $54,000 |
| Mean Household Income | 512 | $64,477 |
| Income Deficit | 271 | $0 |
| Wage / Income Gap (%) | 1,270 | 1.84% |
| Wage / Income Gap ($) | 1,270 | 98.16¢ per $1 |
| Gini / Inequality Index | 1,270 | 0.36 |
Earnings by Sex in Westfield
Average Earnings in Westfield are $34,257, $34,479 for men and $33,846 for women, a difference of 1.8%.
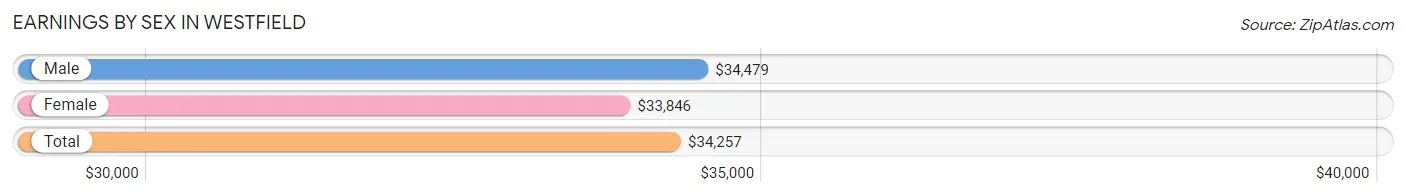
| Sex | Number | Average Earnings |
| Male | 404 (55.6%) | $34,479 |
| Female | 322 (44.4%) | $33,846 |
| Total | 726 (100.0%) | $34,257 |
Earnings by Sex by Income Bracket in Westfield
The most common earnings brackets in Westfield are $2,499 or less for men (45 | 11.1%) and $35,000 to $39,999 for women (51 | 15.8%).
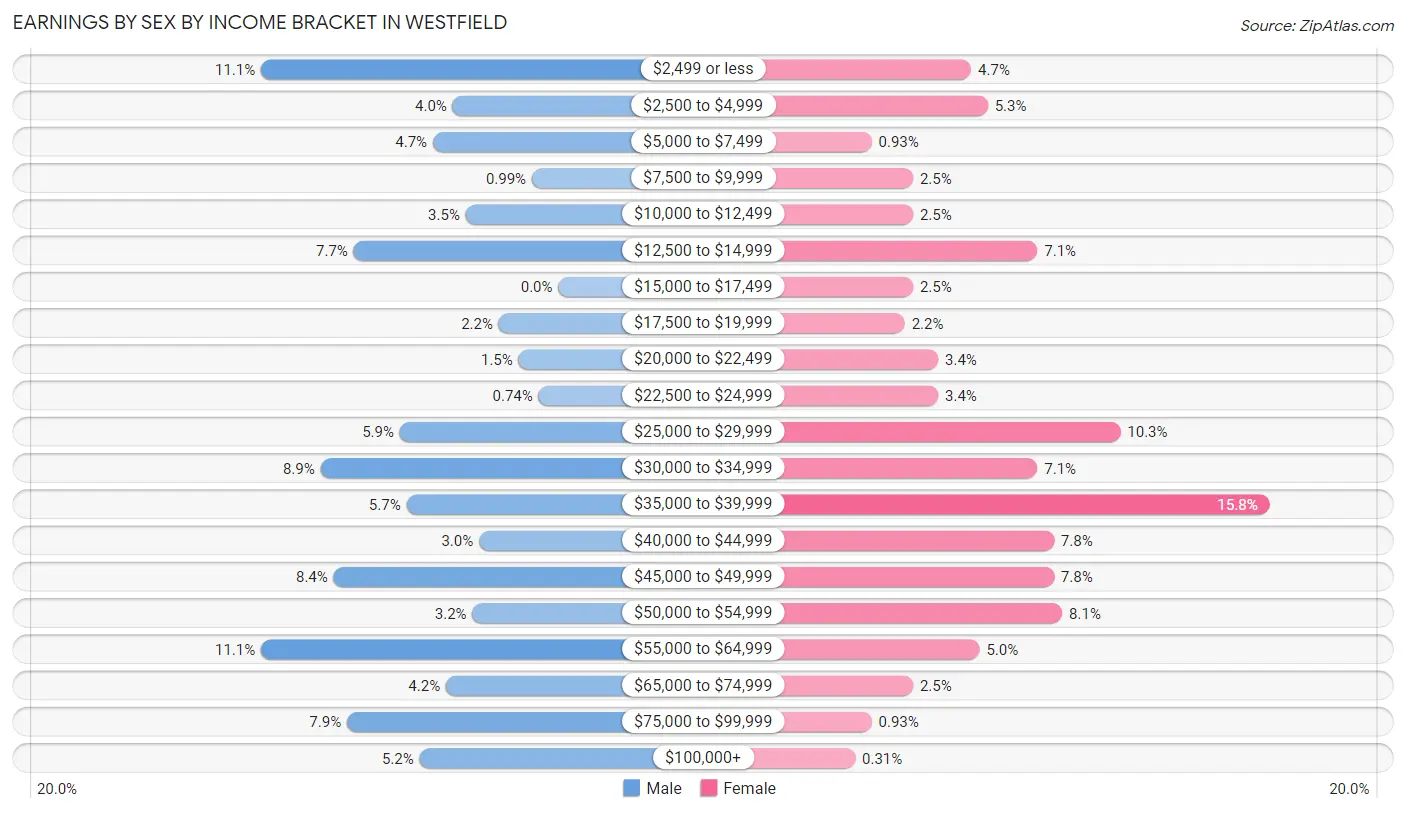
| Income | Male | Female |
| $2,499 or less | 45 (11.1%) | 15 (4.7%) |
| $2,500 to $4,999 | 16 (4.0%) | 17 (5.3%) |
| $5,000 to $7,499 | 19 (4.7%) | 3 (0.9%) |
| $7,500 to $9,999 | 4 (1.0%) | 8 (2.5%) |
| $10,000 to $12,499 | 14 (3.5%) | 8 (2.5%) |
| $12,500 to $14,999 | 31 (7.7%) | 23 (7.1%) |
| $15,000 to $17,499 | 0 (0.0%) | 8 (2.5%) |
| $17,500 to $19,999 | 9 (2.2%) | 7 (2.2%) |
| $20,000 to $22,499 | 6 (1.5%) | 11 (3.4%) |
| $22,500 to $24,999 | 3 (0.7%) | 11 (3.4%) |
| $25,000 to $29,999 | 24 (5.9%) | 33 (10.2%) |
| $30,000 to $34,999 | 36 (8.9%) | 23 (7.1%) |
| $35,000 to $39,999 | 23 (5.7%) | 51 (15.8%) |
| $40,000 to $44,999 | 12 (3.0%) | 25 (7.8%) |
| $45,000 to $49,999 | 34 (8.4%) | 25 (7.8%) |
| $50,000 to $54,999 | 13 (3.2%) | 26 (8.1%) |
| $55,000 to $64,999 | 45 (11.1%) | 16 (5.0%) |
| $65,000 to $74,999 | 17 (4.2%) | 8 (2.5%) |
| $75,000 to $99,999 | 32 (7.9%) | 3 (0.9%) |
| $100,000+ | 21 (5.2%) | 1 (0.3%) |
| Total | 404 (100.0%) | 322 (100.0%) |
Earnings by Sex by Educational Attainment in Westfield
Average earnings in Westfield are $35,924 for men and $36,383 for women, a difference of 1.3%. Men with an educational attainment of graduate degree enjoy the highest average annual earnings of $88,750, while those with high school diploma education earn the least with $34,063. Women with an educational attainment of graduate degree earn the most with the average annual earnings of $63,958, while those with bachelor's degree education have the smallest earnings of $33,750.
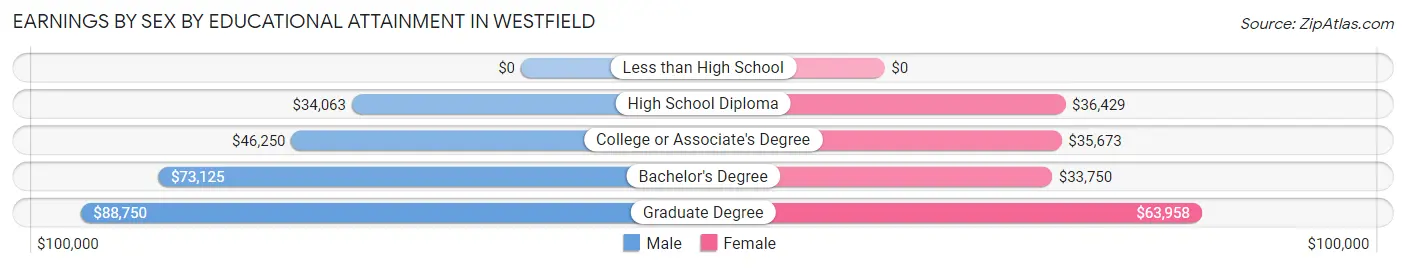
| Educational Attainment | Male Income | Female Income |
| Less than High School | - | - |
| High School Diploma | $34,063 | $36,429 |
| College or Associate's Degree | $46,250 | $35,673 |
| Bachelor's Degree | $73,125 | $33,750 |
| Graduate Degree | $88,750 | $63,958 |
| Total | $35,924 | $36,383 |
Family Income in Westfield
Family Income Brackets in Westfield
According to the Westfield family income data, there are 87 families falling into the $50,000 to $74,999 income range, which is the most common income bracket and makes up 32.1% of all families.
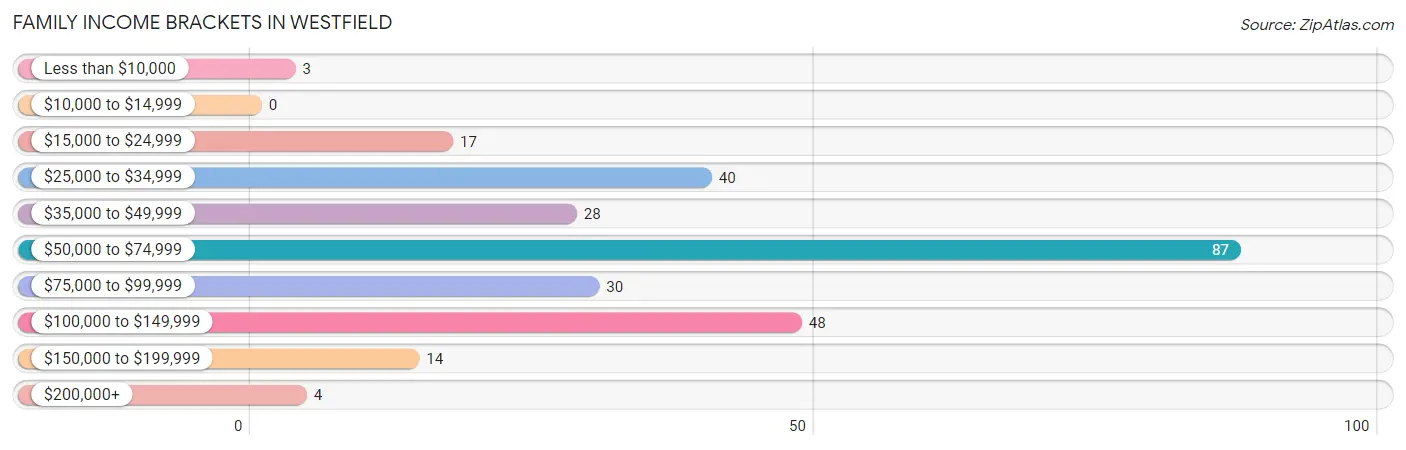
| Income Bracket | # Families | % Families |
| Less than $10,000 | 3 | 1.1% |
| $10,000 to $14,999 | 0 | 0.0% |
| $15,000 to $24,999 | 17 | 6.3% |
| $25,000 to $34,999 | 40 | 14.8% |
| $35,000 to $49,999 | 28 | 10.3% |
| $50,000 to $74,999 | 87 | 32.1% |
| $75,000 to $99,999 | 30 | 11.1% |
| $100,000 to $149,999 | 48 | 17.7% |
| $150,000 to $199,999 | 14 | 5.2% |
| $200,000+ | 4 | 1.5% |
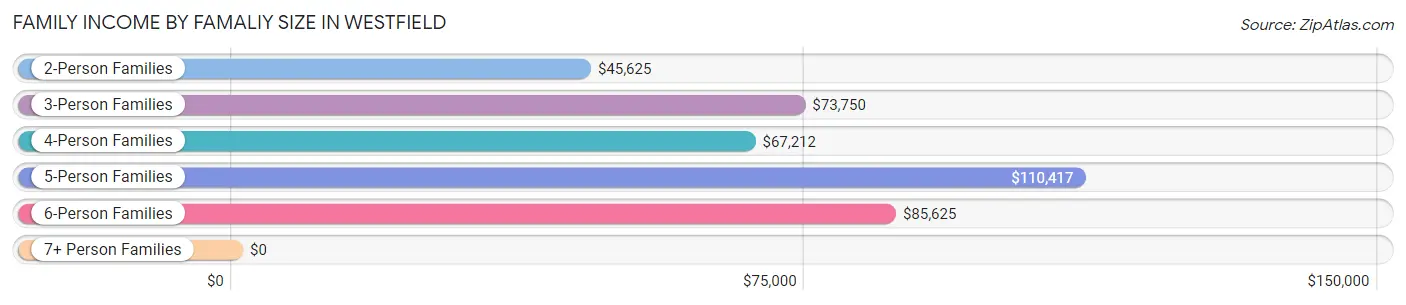
Family Income by Famaliy Size in Westfield
5-person families (17 | 6.3%) account for the highest median family income in Westfield with $110,417 per family, while 3-person families (50 | 18.4%) have the highest median income of $24,583 per family member.
| Income Bracket | # Families | Median Income |
| 2-Person Families | 106 (39.1%) | $45,625 |
| 3-Person Families | 50 (18.4%) | $73,750 |
| 4-Person Families | 81 (29.9%) | $67,212 |
| 5-Person Families | 17 (6.3%) | $110,417 |
| 6-Person Families | 15 (5.5%) | $85,625 |
| 7+ Person Families | 2 (0.7%) | $0 |
| Total | 271 (100.0%) | $65,865 |
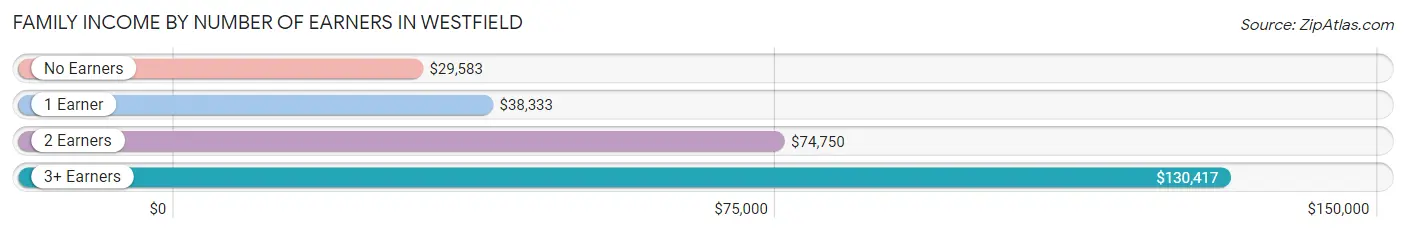
Family Income by Number of Earners in Westfield
The median family income in Westfield is $65,865, with families comprising 3+ earners (33) having the highest median family income of $130,417, while families with no earners (15) have the lowest median family income of $29,583, accounting for 12.2% and 5.5% of families, respectively.
| Number of Earners | # Families | Median Income |
| No Earners | 15 (5.5%) | $29,583 |
| 1 Earner | 104 (38.4%) | $38,333 |
| 2 Earners | 119 (43.9%) | $74,750 |
| 3+ Earners | 33 (12.2%) | $130,417 |
| Total | 271 (100.0%) | $65,865 |
Household Income in Westfield
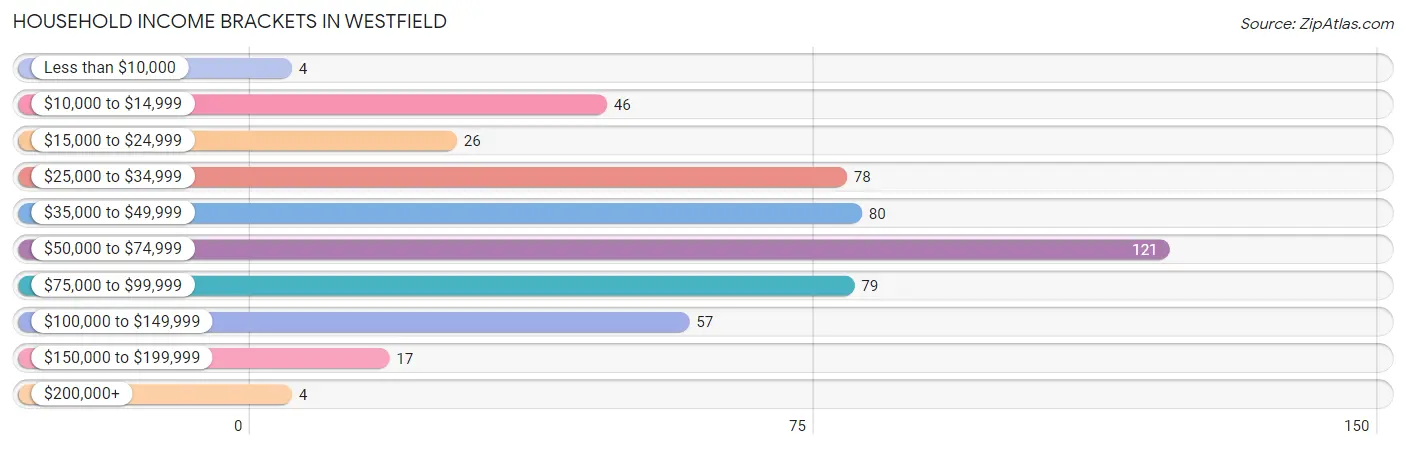
Household Income Brackets in Westfield
With 121 households falling in the category, the $50,000 to $74,999 income range is the most frequent in Westfield, accounting for 23.6% of all households. In contrast, only 4 households (0.8%) fall into the less than $10,000 income bracket, making it the least populous group.
| Income Bracket | # Households | % Households |
| Less than $10,000 | 4 | 0.8% |
| $10,000 to $14,999 | 46 | 9.0% |
| $15,000 to $24,999 | 26 | 5.1% |
| $25,000 to $34,999 | 78 | 15.2% |
| $35,000 to $49,999 | 80 | 15.6% |
| $50,000 to $74,999 | 121 | 23.6% |
| $75,000 to $99,999 | 79 | 15.4% |
| $100,000 to $149,999 | 57 | 11.1% |
| $150,000 to $199,999 | 17 | 3.3% |
| $200,000+ | 4 | 0.8% |
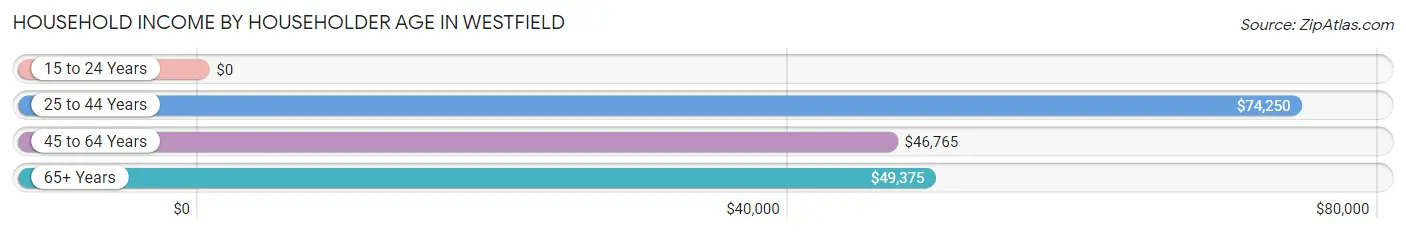
Household Income by Householder Age in Westfield
The median household income in Westfield is $54,000, with the highest median household income of $74,250 found in the 25 to 44 years age bracket for the primary householder. A total of 173 households (33.8%) fall into this category. Meanwhile, the 15 to 24 years age bracket for the primary householder has the lowest median household income of $0, with 56 households (10.9%) in this group.
| Income Bracket | # Households | Median Income |
| 15 to 24 Years | 56 (10.9%) | $0 |
| 25 to 44 Years | 173 (33.8%) | $74,250 |
| 45 to 64 Years | 172 (33.6%) | $46,765 |
| 65+ Years | 111 (21.7%) | $49,375 |
| Total | 512 (100.0%) | $54,000 |
Poverty in Westfield
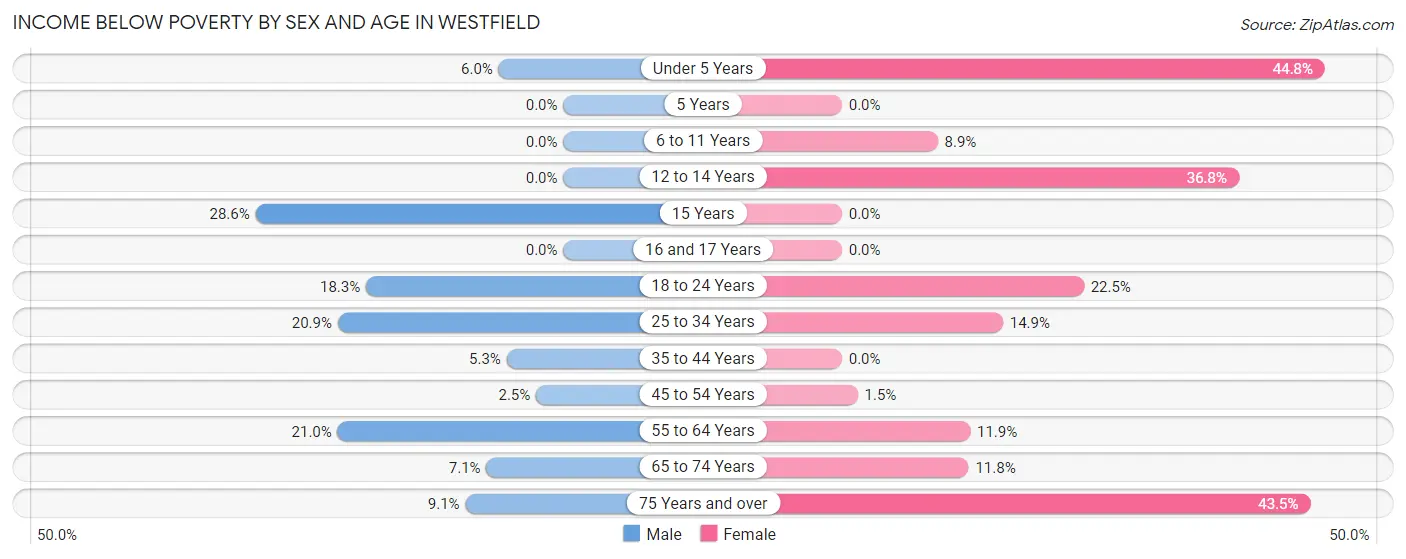
Income Below Poverty by Sex and Age in Westfield
With 9.9% poverty level for males and 15.1% for females among the residents of Westfield, 15 year old males and under 5 year old females are the most vulnerable to poverty, with 2 males (28.6%) and 13 females (44.8%) in their respective age groups living below the poverty level.
| Age Bracket | Male | Female |
| Under 5 Years | 3 (6.0%) | 13 (44.8%) |
| 5 Years | 0 (0.0%) | 0 (0.0%) |
| 6 to 11 Years | 0 (0.0%) | 4 (8.9%) |
| 12 to 14 Years | 0 (0.0%) | 7 (36.8%) |
| 15 Years | 2 (28.6%) | 0 (0.0%) |
| 16 and 17 Years | 0 (0.0%) | 0 (0.0%) |
| 18 to 24 Years | 13 (18.3%) | 11 (22.5%) |
| 25 to 34 Years | 18 (20.9%) | 13 (14.9%) |
| 35 to 44 Years | 5 (5.3%) | 0 (0.0%) |
| 45 to 54 Years | 2 (2.5%) | 1 (1.5%) |
| 55 to 64 Years | 22 (20.9%) | 5 (11.9%) |
| 65 to 74 Years | 3 (7.1%) | 6 (11.8%) |
| 75 Years and over | 3 (9.1%) | 20 (43.5%) |
| Total | 71 (9.9%) | 80 (15.1%) |
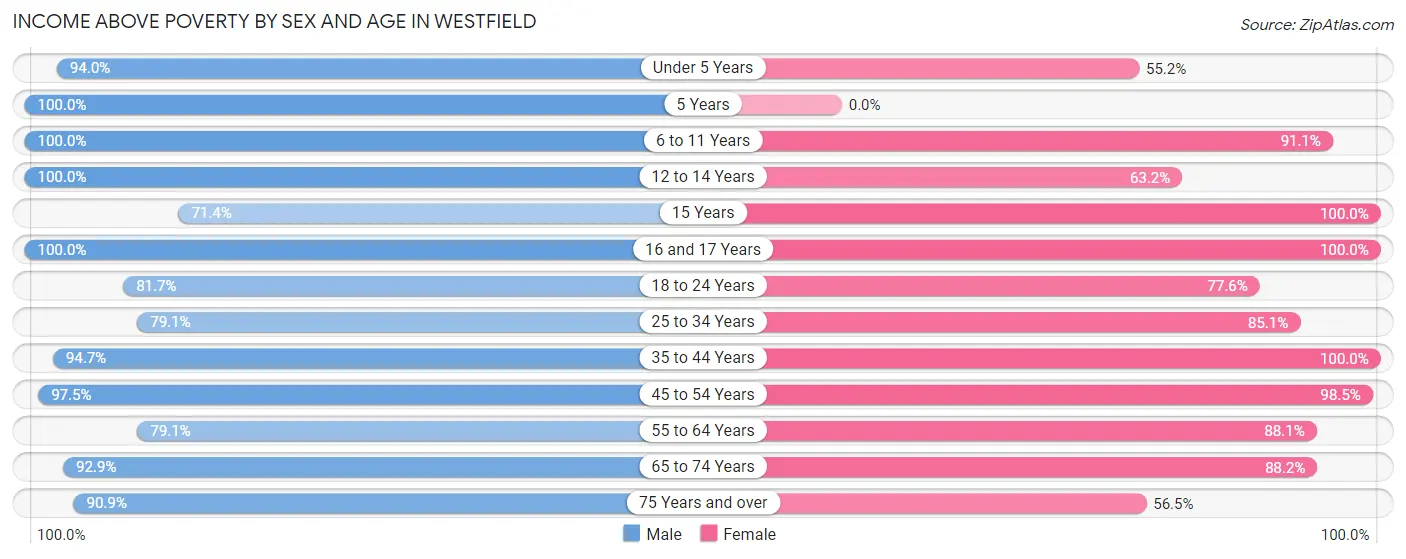
Income Above Poverty by Sex and Age in Westfield
According to the poverty statistics in Westfield, males aged 5 years and females aged 15 years are the age groups that are most secure financially, with 100.0% of males and 100.0% of females in these age groups living above the poverty line.
| Age Bracket | Male | Female |
| Under 5 Years | 47 (94.0%) | 16 (55.2%) |
| 5 Years | 11 (100.0%) | 0 (0.0%) |
| 6 to 11 Years | 87 (100.0%) | 41 (91.1%) |
| 12 to 14 Years | 36 (100.0%) | 12 (63.2%) |
| 15 Years | 5 (71.4%) | 2 (100.0%) |
| 16 and 17 Years | 18 (100.0%) | 15 (100.0%) |
| 18 to 24 Years | 58 (81.7%) | 38 (77.5%) |
| 25 to 34 Years | 68 (79.1%) | 74 (85.1%) |
| 35 to 44 Years | 90 (94.7%) | 78 (100.0%) |
| 45 to 54 Years | 77 (97.5%) | 67 (98.5%) |
| 55 to 64 Years | 83 (79.0%) | 37 (88.1%) |
| 65 to 74 Years | 39 (92.9%) | 45 (88.2%) |
| 75 Years and over | 30 (90.9%) | 26 (56.5%) |
| Total | 649 (90.1%) | 451 (84.9%) |
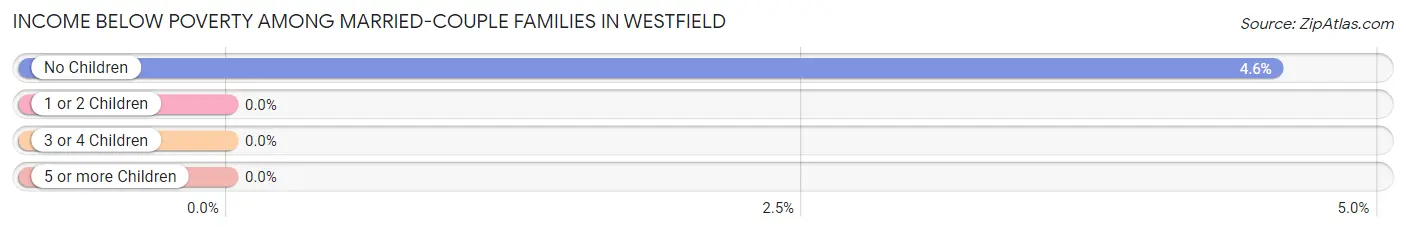
Income Below Poverty Among Married-Couple Families in Westfield
The poverty statistics for married-couple families in Westfield show that 1.7% or 3 of the total 175 families live below the poverty line. Families with no children have the highest poverty rate of 4.5%, comprising of 3 families. On the other hand, families with 1 or 2 children have the lowest poverty rate of 0.0%, which includes 0 families.
| Children | Above Poverty | Below Poverty |
| No Children | 63 (95.5%) | 3 (4.5%) |
| 1 or 2 Children | 95 (100.0%) | 0 (0.0%) |
| 3 or 4 Children | 14 (100.0%) | 0 (0.0%) |
| 5 or more Children | 0 (0.0%) | 0 (0.0%) |
| Total | 172 (98.3%) | 3 (1.7%) |
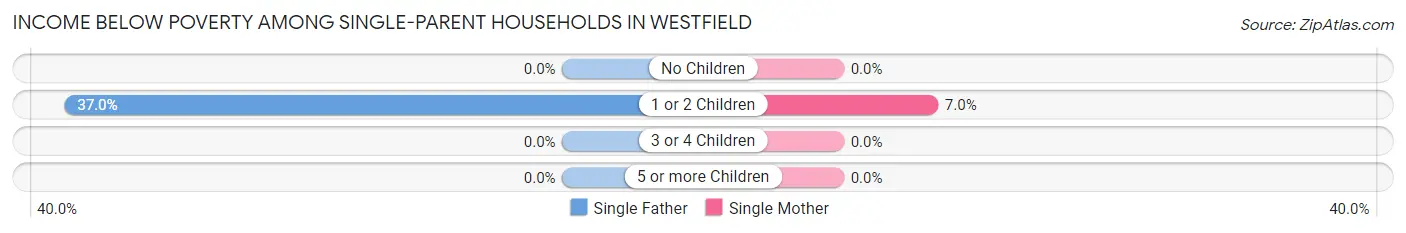
Income Below Poverty Among Single-Parent Households in Westfield
According to the poverty data in Westfield, 30.3% or 10 single-father households and 6.4% or 4 single-mother households are living below the poverty line. Among single-father households, those with 1 or 2 children have the highest poverty rate, with 10 households (37.0%) experiencing poverty. Likewise, among single-mother households, those with 1 or 2 children have the highest poverty rate, with 4 households (7.0%) falling below the poverty line.
| Children | Single Father | Single Mother |
| No Children | 0 (0.0%) | 0 (0.0%) |
| 1 or 2 Children | 10 (37.0%) | 4 (7.0%) |
| 3 or 4 Children | 0 (0.0%) | 0 (0.0%) |
| 5 or more Children | 0 (0.0%) | 0 (0.0%) |
| Total | 10 (30.3%) | 4 (6.4%) |
Income Below Poverty Among Married-Couple vs Single-Parent Households in Westfield
The poverty data for Westfield shows that 3 of the married-couple family households (1.7%) and 14 of the single-parent households (14.6%) are living below the poverty level. Within the married-couple family households, those with no children have the highest poverty rate, with 3 households (4.5%) falling below the poverty line. Among the single-parent households, those with 1 or 2 children have the highest poverty rate, with 14 household (16.7%) living below poverty.
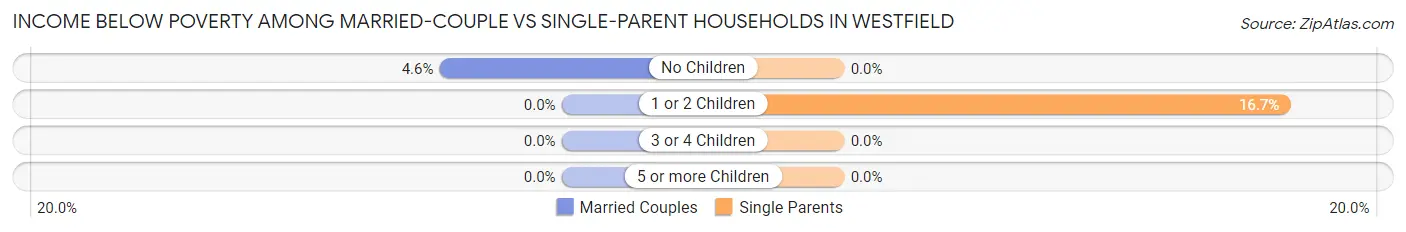
| Children | Married-Couple Families | Single-Parent Households |
| No Children | 3 (4.5%) | 0 (0.0%) |
| 1 or 2 Children | 0 (0.0%) | 14 (16.7%) |
| 3 or 4 Children | 0 (0.0%) | 0 (0.0%) |
| 5 or more Children | 0 (0.0%) | 0 (0.0%) |
| Total | 3 (1.7%) | 14 (14.6%) |
Employment Characteristics in Westfield
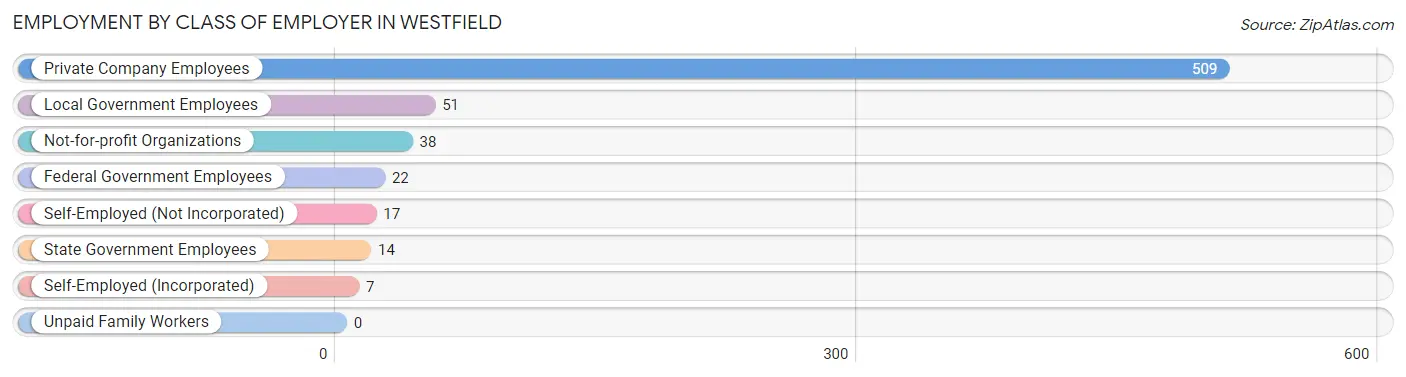
Employment by Class of Employer in Westfield
Among the 658 employed individuals in Westfield, private company employees (509 | 77.4%), local government employees (51 | 7.7%), and not-for-profit organizations (38 | 5.8%) make up the most common classes of employment.
| Employer Class | # Employees | % Employees |
| Private Company Employees | 509 | 77.4% |
| Self-Employed (Incorporated) | 7 | 1.1% |
| Self-Employed (Not Incorporated) | 17 | 2.6% |
| Not-for-profit Organizations | 38 | 5.8% |
| Local Government Employees | 51 | 7.7% |
| State Government Employees | 14 | 2.1% |
| Federal Government Employees | 22 | 3.3% |
| Unpaid Family Workers | 0 | 0.0% |
| Total | 658 | 100.0% |
Employment Status by Age in Westfield
According to the labor force statistics for Westfield, out of the total population over 16 years of age (965), 70.2% or 677 individuals are in the labor force, with 1.9% or 13 of them unemployed. The age group with the highest labor force participation rate is 35 to 44 years, with 90.8% or 157 individuals in the labor force. Within the labor force, the 35 to 44 years age range has the highest percentage of unemployed individuals, with 7.6% or 12 of them being unemployed.
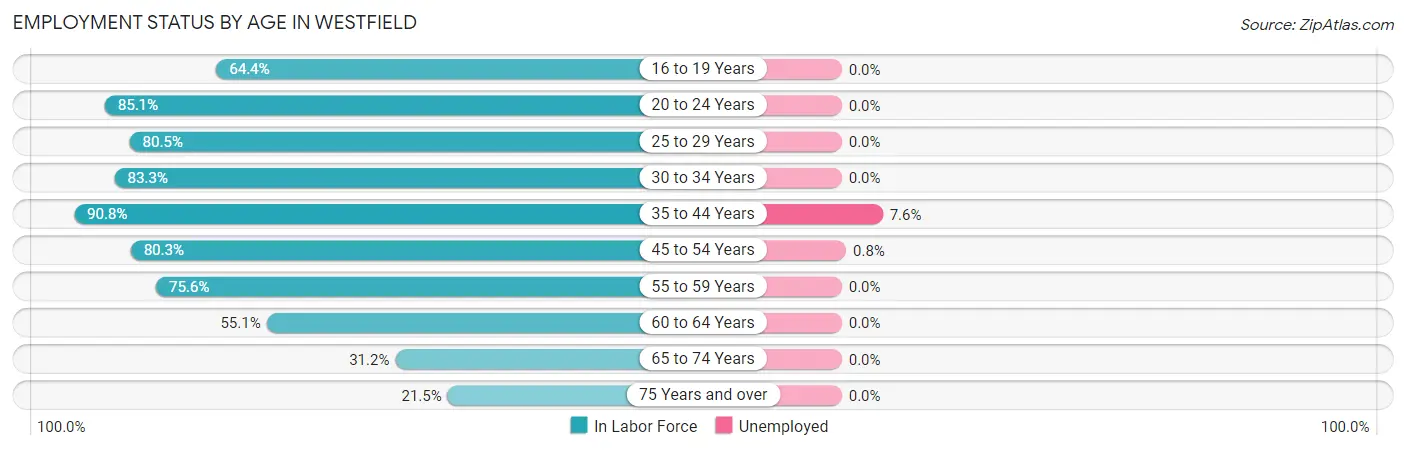
| Age Bracket | In Labor Force | Unemployed |
| 16 to 19 Years | 38 (64.4%) | 0 (0.0%) |
| 20 to 24 Years | 80 (85.1%) | 0 (0.0%) |
| 25 to 29 Years | 91 (80.5%) | 0 (0.0%) |
| 30 to 34 Years | 50 (83.3%) | 0 (0.0%) |
| 35 to 44 Years | 157 (90.8%) | 12 (7.6%) |
| 45 to 54 Years | 118 (80.3%) | 1 (0.8%) |
| 55 to 59 Years | 59 (75.6%) | 0 (0.0%) |
| 60 to 64 Years | 38 (55.1%) | 0 (0.0%) |
| 65 to 74 Years | 29 (31.2%) | 0 (0.0%) |
| 75 Years and over | 17 (21.5%) | 0 (0.0%) |
| Total | 677 (70.2%) | 13 (1.9%) |
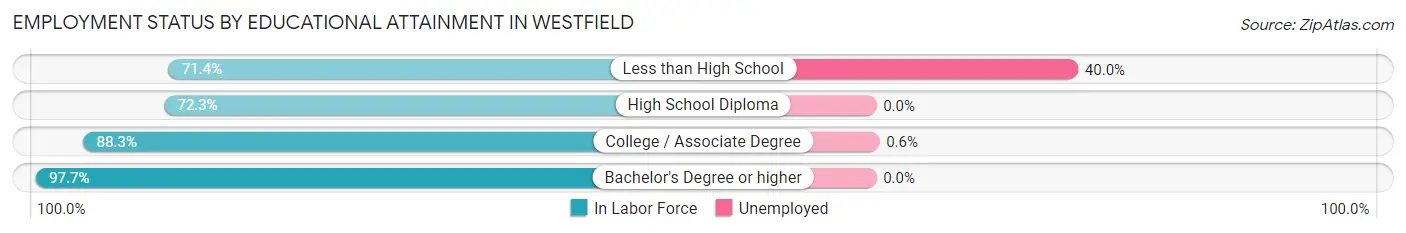
Employment Status by Educational Attainment in Westfield
According to labor force statistics for Westfield, 80.2% of individuals (513) out of the total population between 25 and 64 years of age (640) are in the labor force, with 2.5% or 13 of them being unemployed. The group with the highest labor force participation rate are those with the educational attainment of bachelor's degree or higher, with 97.7% or 85 individuals in the labor force. Within the labor force, individuals with less than high school education have the highest percentage of unemployment, with 40.0% or 12 of them being unemployed.
| Educational Attainment | In Labor Force | Unemployed |
| Less than High School | 30 (71.4%) | 17 (40.0%) |
| High School Diploma | 240 (72.3%) | 0 (0.0%) |
| College / Associate Degree | 158 (88.3%) | 1 (0.6%) |
| Bachelor's Degree or higher | 85 (97.7%) | 0 (0.0%) |
| Total | 513 (80.2%) | 16 (2.5%) |
Employment Occupations by Sex in Westfield
Management, Business, Science and Arts Occupations
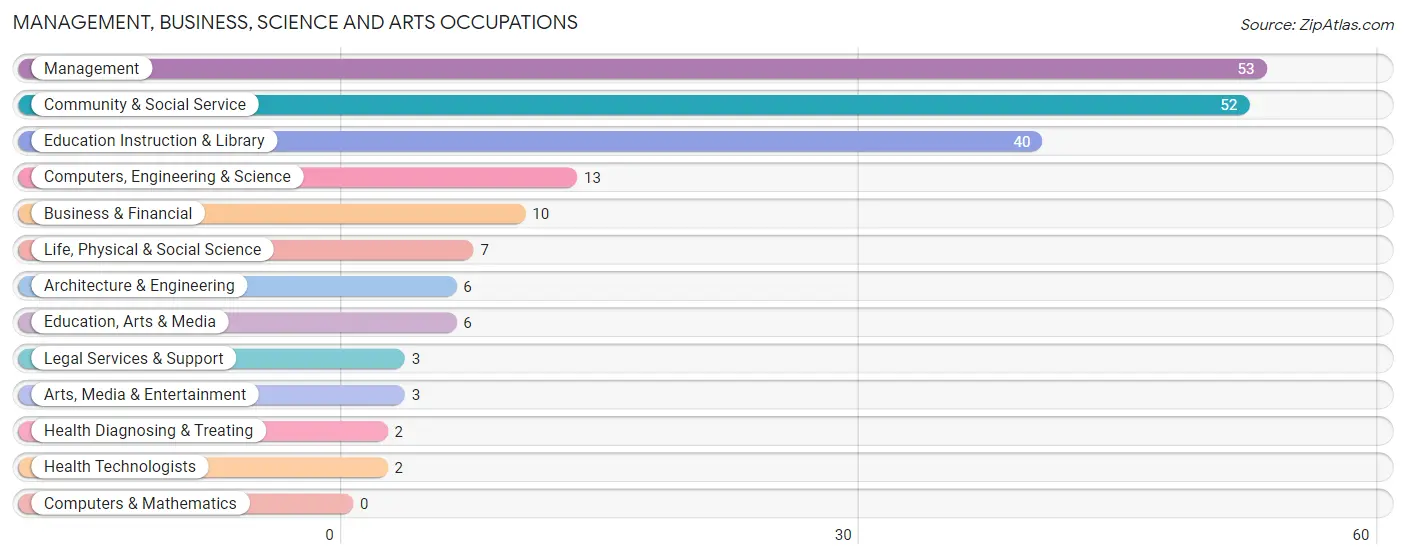
The most common Management, Business, Science and Arts occupations in Westfield are Management (53 | 8.0%), Community & Social Service (52 | 7.8%), Education Instruction & Library (40 | 6.0%), Computers, Engineering & Science (13 | 2.0%), and Business & Financial (10 | 1.5%).
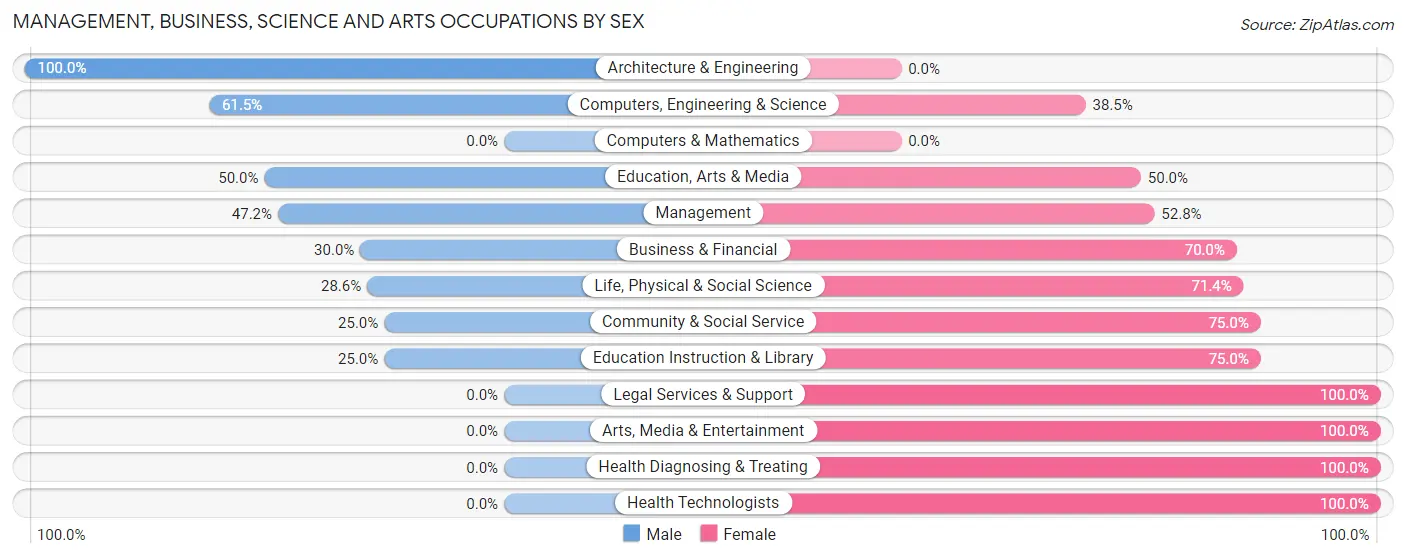
Management, Business, Science and Arts Occupations by Sex
Within the Management, Business, Science and Arts occupations in Westfield, the most male-oriented occupations are Architecture & Engineering (100.0%), Computers, Engineering & Science (61.5%), and Education, Arts & Media (50.0%), while the most female-oriented occupations are Legal Services & Support (100.0%), Arts, Media & Entertainment (100.0%), and Health Diagnosing & Treating (100.0%).
| Occupation | Male | Female |
| Management | 25 (47.2%) | 28 (52.8%) |
| Business & Financial | 3 (30.0%) | 7 (70.0%) |
| Computers, Engineering & Science | 8 (61.5%) | 5 (38.5%) |
| Computers & Mathematics | 0 (0.0%) | 0 (0.0%) |
| Architecture & Engineering | 6 (100.0%) | 0 (0.0%) |
| Life, Physical & Social Science | 2 (28.6%) | 5 (71.4%) |
| Community & Social Service | 13 (25.0%) | 39 (75.0%) |
| Education, Arts & Media | 3 (50.0%) | 3 (50.0%) |
| Legal Services & Support | 0 (0.0%) | 3 (100.0%) |
| Education Instruction & Library | 10 (25.0%) | 30 (75.0%) |
| Arts, Media & Entertainment | 0 (0.0%) | 3 (100.0%) |
| Health Diagnosing & Treating | 0 (0.0%) | 2 (100.0%) |
| Health Technologists | 0 (0.0%) | 2 (100.0%) |
| Total (Category) | 49 (37.7%) | 81 (62.3%) |
| Total (Overall) | 360 (54.2%) | 304 (45.8%) |
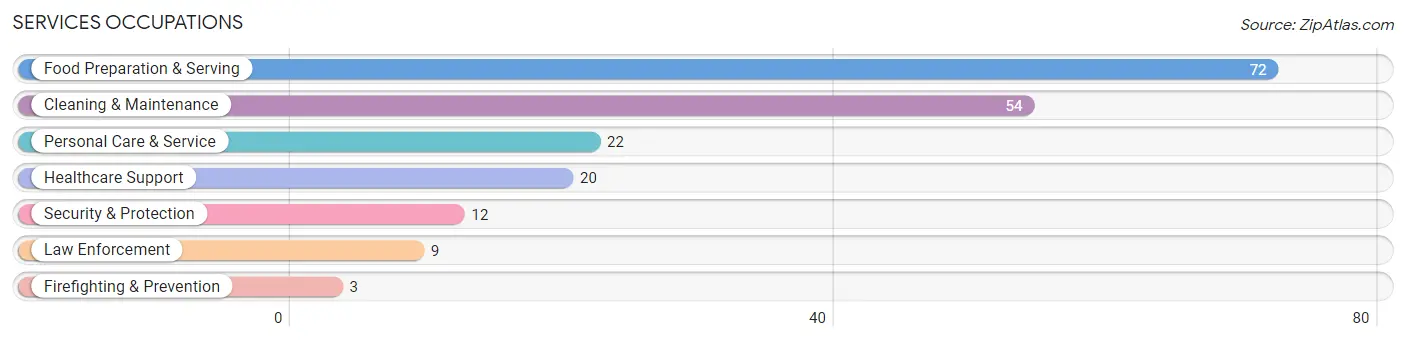
Services Occupations
The most common Services occupations in Westfield are Food Preparation & Serving (72 | 10.8%), Cleaning & Maintenance (54 | 8.1%), Personal Care & Service (22 | 3.3%), Healthcare Support (20 | 3.0%), and Security & Protection (12 | 1.8%).
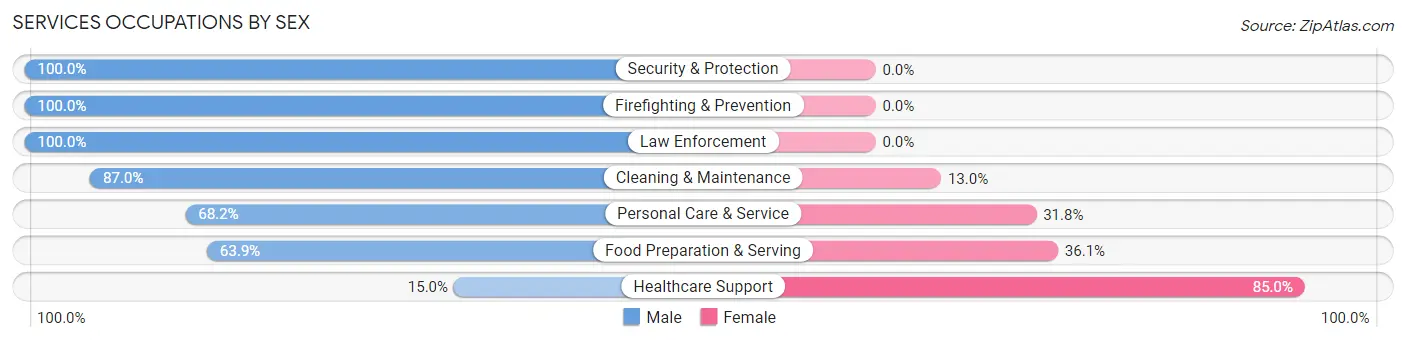
Services Occupations by Sex
Within the Services occupations in Westfield, the most male-oriented occupations are Security & Protection (100.0%), Firefighting & Prevention (100.0%), and Law Enforcement (100.0%), while the most female-oriented occupations are Healthcare Support (85.0%), Food Preparation & Serving (36.1%), and Personal Care & Service (31.8%).
| Occupation | Male | Female |
| Healthcare Support | 3 (15.0%) | 17 (85.0%) |
| Security & Protection | 12 (100.0%) | 0 (0.0%) |
| Firefighting & Prevention | 3 (100.0%) | 0 (0.0%) |
| Law Enforcement | 9 (100.0%) | 0 (0.0%) |
| Food Preparation & Serving | 46 (63.9%) | 26 (36.1%) |
| Cleaning & Maintenance | 47 (87.0%) | 7 (13.0%) |
| Personal Care & Service | 15 (68.2%) | 7 (31.8%) |
| Total (Category) | 123 (68.3%) | 57 (31.7%) |
| Total (Overall) | 360 (54.2%) | 304 (45.8%) |
Sales and Office Occupations
The most common Sales and Office occupations in Westfield are Office & Administration (96 | 14.5%), and Sales & Related (52 | 7.8%).
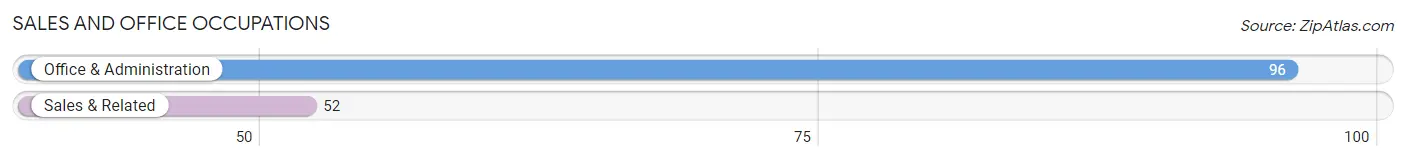
Sales and Office Occupations by Sex
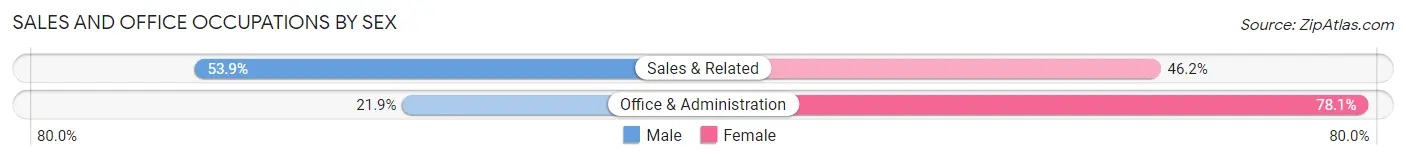
| Occupation | Male | Female |
| Sales & Related | 28 (53.8%) | 24 (46.2%) |
| Office & Administration | 21 (21.9%) | 75 (78.1%) |
| Total (Category) | 49 (33.1%) | 99 (66.9%) |
| Total (Overall) | 360 (54.2%) | 304 (45.8%) |
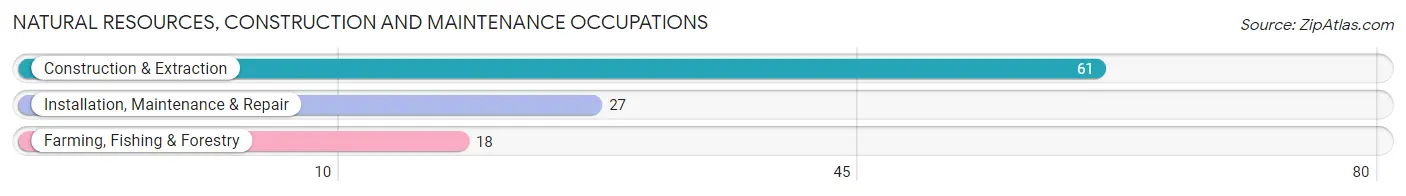
Natural Resources, Construction and Maintenance Occupations
The most common Natural Resources, Construction and Maintenance occupations in Westfield are Construction & Extraction (61 | 9.2%), Installation, Maintenance & Repair (27 | 4.1%), and Farming, Fishing & Forestry (18 | 2.7%).
Natural Resources, Construction and Maintenance Occupations by Sex
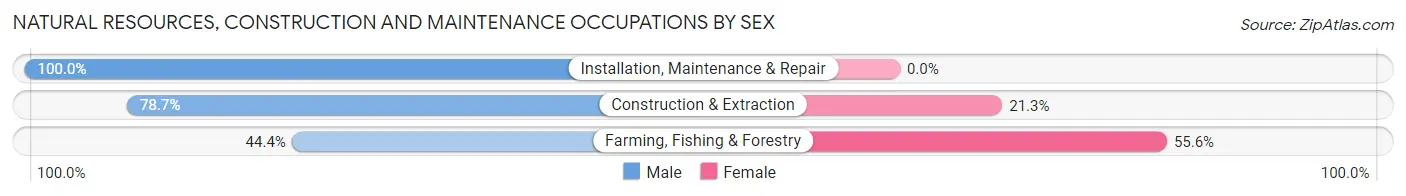
| Occupation | Male | Female |
| Farming, Fishing & Forestry | 8 (44.4%) | 10 (55.6%) |
| Construction & Extraction | 48 (78.7%) | 13 (21.3%) |
| Installation, Maintenance & Repair | 27 (100.0%) | 0 (0.0%) |
| Total (Category) | 83 (78.3%) | 23 (21.7%) |
| Total (Overall) | 360 (54.2%) | 304 (45.8%) |
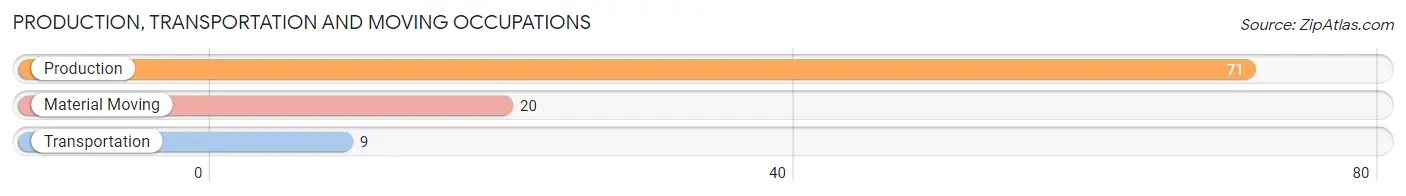
Production, Transportation and Moving Occupations
The most common Production, Transportation and Moving occupations in Westfield are Production (71 | 10.7%), Material Moving (20 | 3.0%), and Transportation (9 | 1.4%).
Production, Transportation and Moving Occupations by Sex
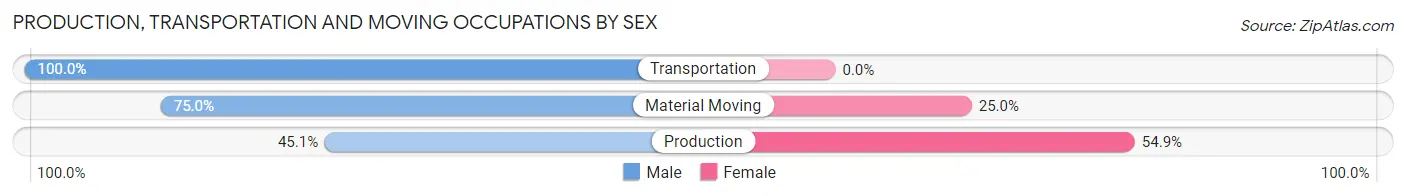
| Occupation | Male | Female |
| Production | 32 (45.1%) | 39 (54.9%) |
| Transportation | 9 (100.0%) | 0 (0.0%) |
| Material Moving | 15 (75.0%) | 5 (25.0%) |
| Total (Category) | 56 (56.0%) | 44 (44.0%) |
| Total (Overall) | 360 (54.2%) | 304 (45.8%) |
Employment Industries by Sex in Westfield
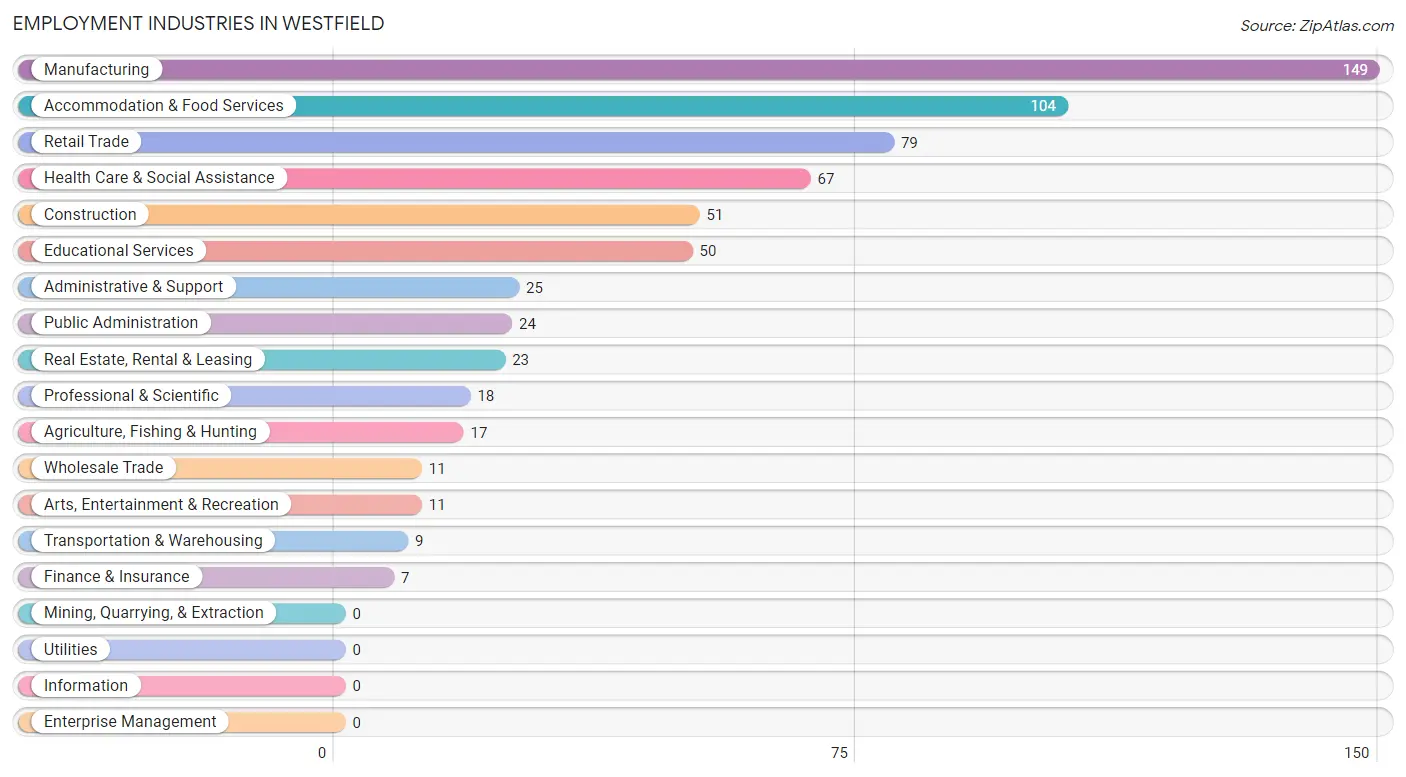
Employment Industries in Westfield
The major employment industries in Westfield include Manufacturing (149 | 22.4%), Accommodation & Food Services (104 | 15.7%), Retail Trade (79 | 11.9%), Health Care & Social Assistance (67 | 10.1%), and Construction (51 | 7.7%).
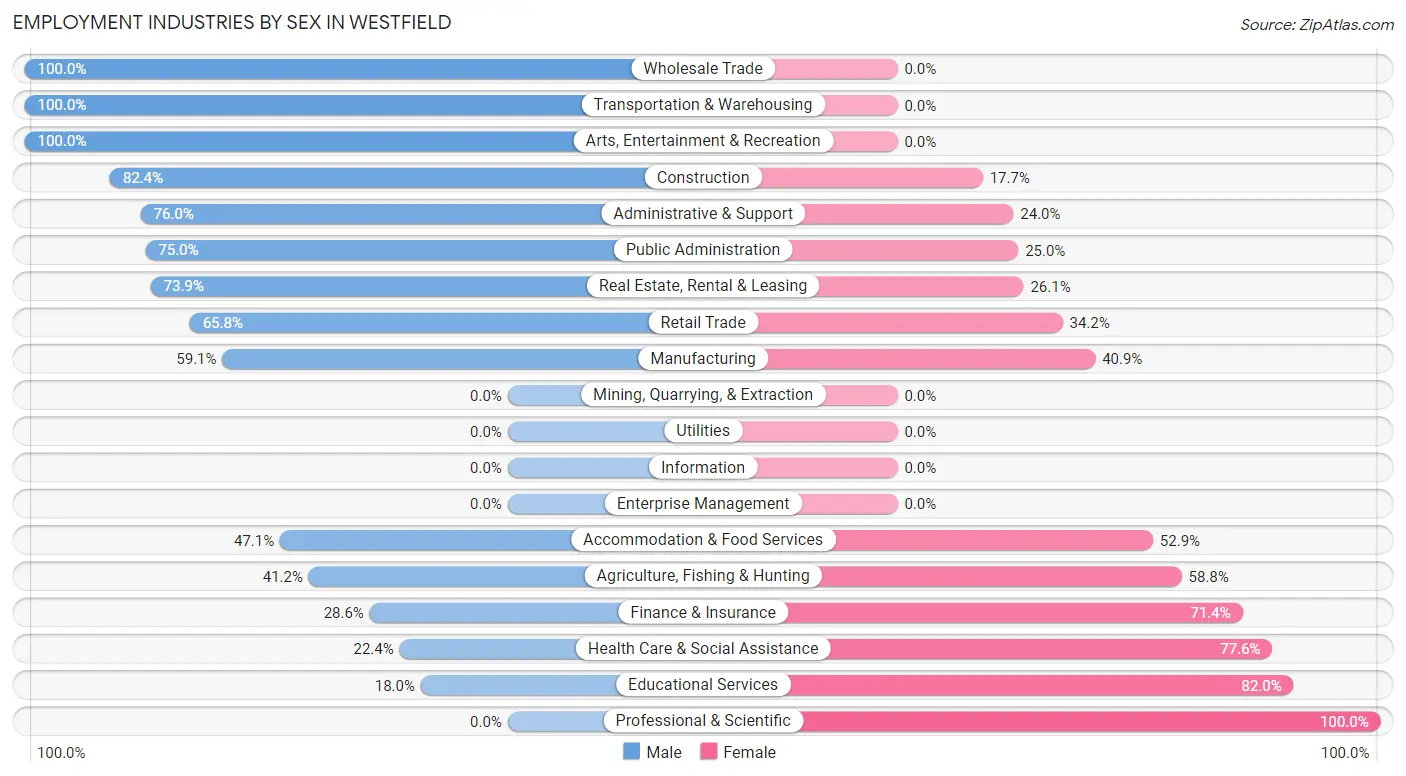
Employment Industries by Sex in Westfield
The Westfield industries that see more men than women are Wholesale Trade (100.0%), Transportation & Warehousing (100.0%), and Arts, Entertainment & Recreation (100.0%), whereas the industries that tend to have a higher number of women are Professional & Scientific (100.0%), Educational Services (82.0%), and Health Care & Social Assistance (77.6%).
| Industry | Male | Female |
| Agriculture, Fishing & Hunting | 7 (41.2%) | 10 (58.8%) |
| Mining, Quarrying, & Extraction | 0 (0.0%) | 0 (0.0%) |
| Construction | 42 (82.4%) | 9 (17.6%) |
| Manufacturing | 88 (59.1%) | 61 (40.9%) |
| Wholesale Trade | 11 (100.0%) | 0 (0.0%) |
| Retail Trade | 52 (65.8%) | 27 (34.2%) |
| Transportation & Warehousing | 9 (100.0%) | 0 (0.0%) |
| Utilities | 0 (0.0%) | 0 (0.0%) |
| Information | 0 (0.0%) | 0 (0.0%) |
| Finance & Insurance | 2 (28.6%) | 5 (71.4%) |
| Real Estate, Rental & Leasing | 17 (73.9%) | 6 (26.1%) |
| Professional & Scientific | 0 (0.0%) | 18 (100.0%) |
| Enterprise Management | 0 (0.0%) | 0 (0.0%) |
| Administrative & Support | 19 (76.0%) | 6 (24.0%) |
| Educational Services | 9 (18.0%) | 41 (82.0%) |
| Health Care & Social Assistance | 15 (22.4%) | 52 (77.6%) |
| Arts, Entertainment & Recreation | 11 (100.0%) | 0 (0.0%) |
| Accommodation & Food Services | 49 (47.1%) | 55 (52.9%) |
| Public Administration | 18 (75.0%) | 6 (25.0%) |
| Total | 360 (54.2%) | 304 (45.8%) |
Education in Westfield
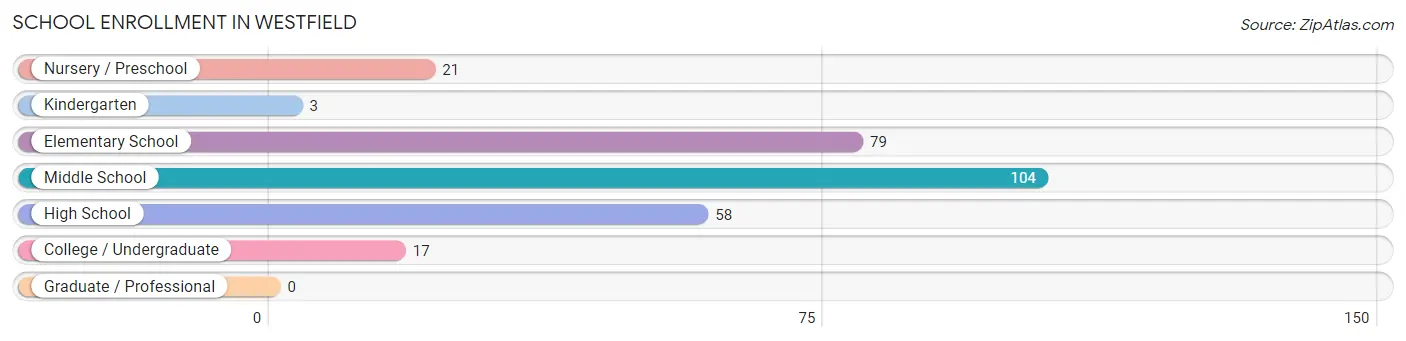
School Enrollment in Westfield
The most common levels of schooling among the 282 students in Westfield are middle school (104 | 36.9%), elementary school (79 | 28.0%), and high school (58 | 20.6%).
| School Level | # Students | % Students |
| Nursery / Preschool | 21 | 7.4% |
| Kindergarten | 3 | 1.1% |
| Elementary School | 79 | 28.0% |
| Middle School | 104 | 36.9% |
| High School | 58 | 20.6% |
| College / Undergraduate | 17 | 6.0% |
| Graduate / Professional | 0 | 0.0% |
| Total | 282 | 100.0% |
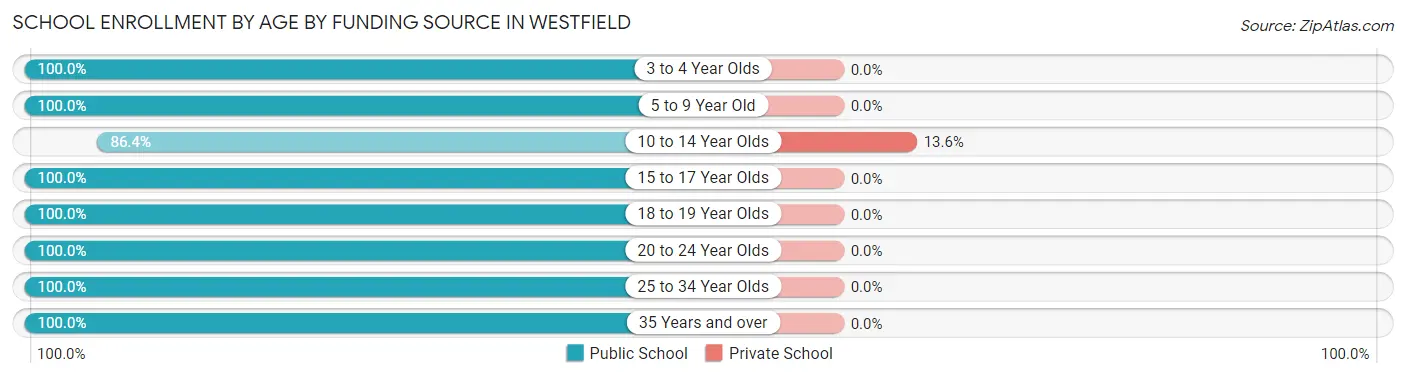
School Enrollment by Age by Funding Source in Westfield
Out of a total of 282 students who are enrolled in schools in Westfield, 17 (6.0%) attend a private institution, while the remaining 265 (94.0%) are enrolled in public schools. The age group of 10 to 14 year olds has the highest likelihood of being enrolled in private schools, with 17 (13.6% in the age bracket) enrolled. Conversely, the age group of 3 to 4 year olds has the lowest likelihood of being enrolled in a private school, with 10 (100.0% in the age bracket) attending a public institution.
| Age Bracket | Public School | Private School |
| 3 to 4 Year Olds | 10 (100.0%) | 0 (0.0%) |
| 5 to 9 Year Old | 74 (100.0%) | 0 (0.0%) |
| 10 to 14 Year Olds | 108 (86.4%) | 17 (13.6%) |
| 15 to 17 Year Olds | 42 (100.0%) | 0 (0.0%) |
| 18 to 19 Year Olds | 14 (100.0%) | 0 (0.0%) |
| 20 to 24 Year Olds | 4 (100.0%) | 0 (0.0%) |
| 25 to 34 Year Olds | 11 (100.0%) | 0 (0.0%) |
| 35 Years and over | 2 (100.0%) | 0 (0.0%) |
| Total | 265 (94.0%) | 17 (6.0%) |
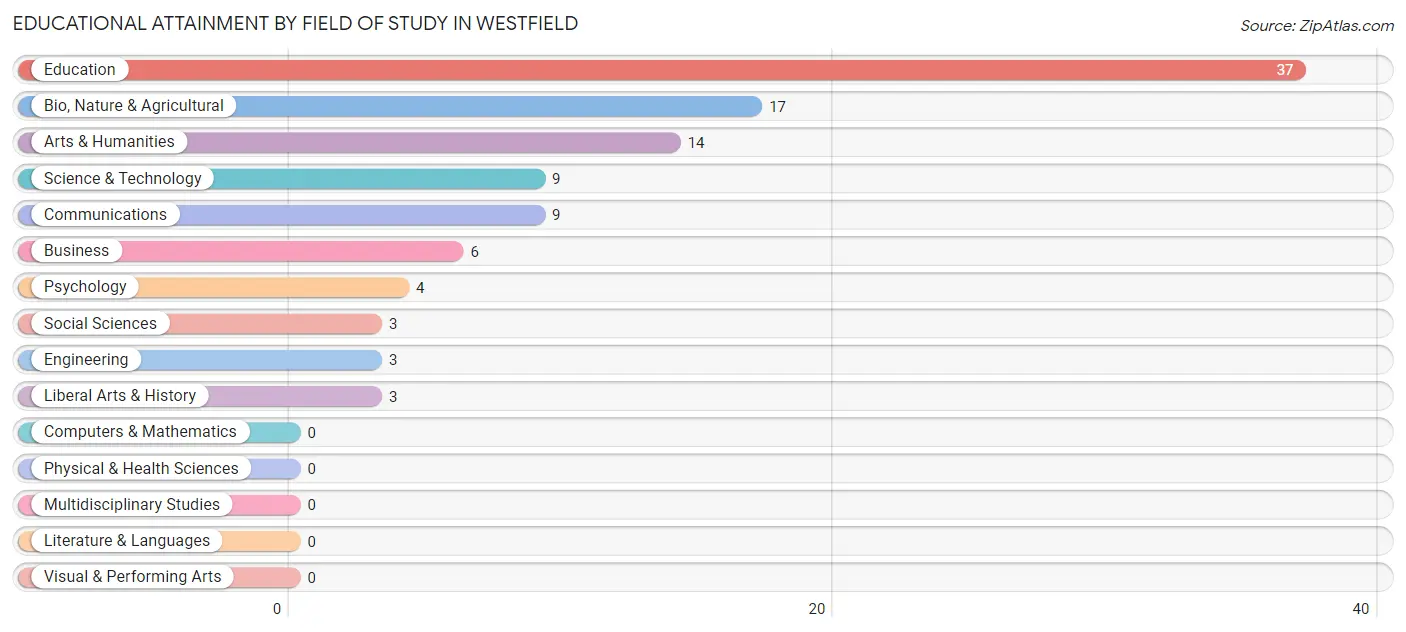
Educational Attainment by Field of Study in Westfield
Education (37 | 35.2%), bio, nature & agricultural (17 | 16.2%), arts & humanities (14 | 13.3%), science & technology (9 | 8.6%), and communications (9 | 8.6%) are the most common fields of study among 105 individuals in Westfield who have obtained a bachelor's degree or higher.
| Field of Study | # Graduates | % Graduates |
| Computers & Mathematics | 0 | 0.0% |
| Bio, Nature & Agricultural | 17 | 16.2% |
| Physical & Health Sciences | 0 | 0.0% |
| Psychology | 4 | 3.8% |
| Social Sciences | 3 | 2.9% |
| Engineering | 3 | 2.9% |
| Multidisciplinary Studies | 0 | 0.0% |
| Science & Technology | 9 | 8.6% |
| Business | 6 | 5.7% |
| Education | 37 | 35.2% |
| Literature & Languages | 0 | 0.0% |
| Liberal Arts & History | 3 | 2.9% |
| Visual & Performing Arts | 0 | 0.0% |
| Communications | 9 | 8.6% |
| Arts & Humanities | 14 | 13.3% |
| Total | 105 | 100.0% |
Transportation & Commute in Westfield
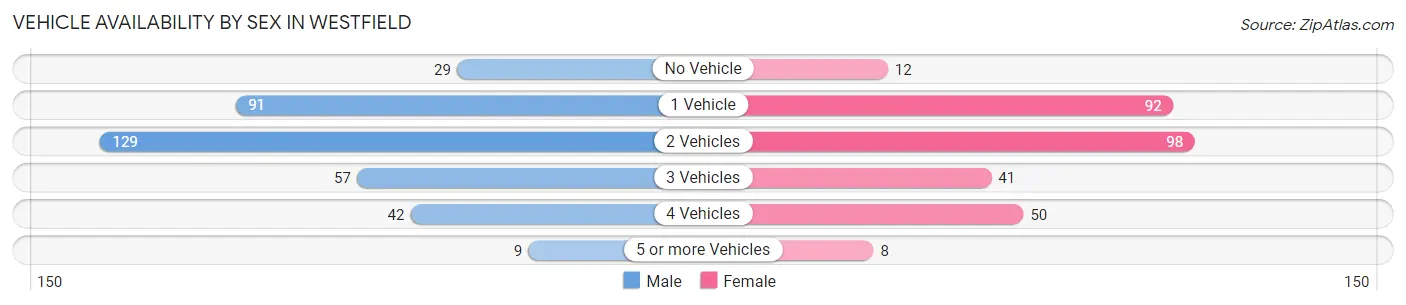
Vehicle Availability by Sex in Westfield
The most prevalent vehicle ownership categories in Westfield are males with 2 vehicles (129, accounting for 36.1%) and females with 2 vehicles (98, making up 42.9%).
| Vehicles Available | Male | Female |
| No Vehicle | 29 (8.1%) | 12 (4.0%) |
| 1 Vehicle | 91 (25.5%) | 92 (30.6%) |
| 2 Vehicles | 129 (36.1%) | 98 (32.6%) |
| 3 Vehicles | 57 (16.0%) | 41 (13.6%) |
| 4 Vehicles | 42 (11.8%) | 50 (16.6%) |
| 5 or more Vehicles | 9 (2.5%) | 8 (2.7%) |
| Total | 357 (100.0%) | 301 (100.0%) |
Commute Time in Westfield
The most frequently occuring commute durations in Westfield are 5 to 9 minutes (172 commuters, 27.0%), 10 to 14 minutes (109 commuters, 17.1%), and 25 to 29 minutes (85 commuters, 13.3%).
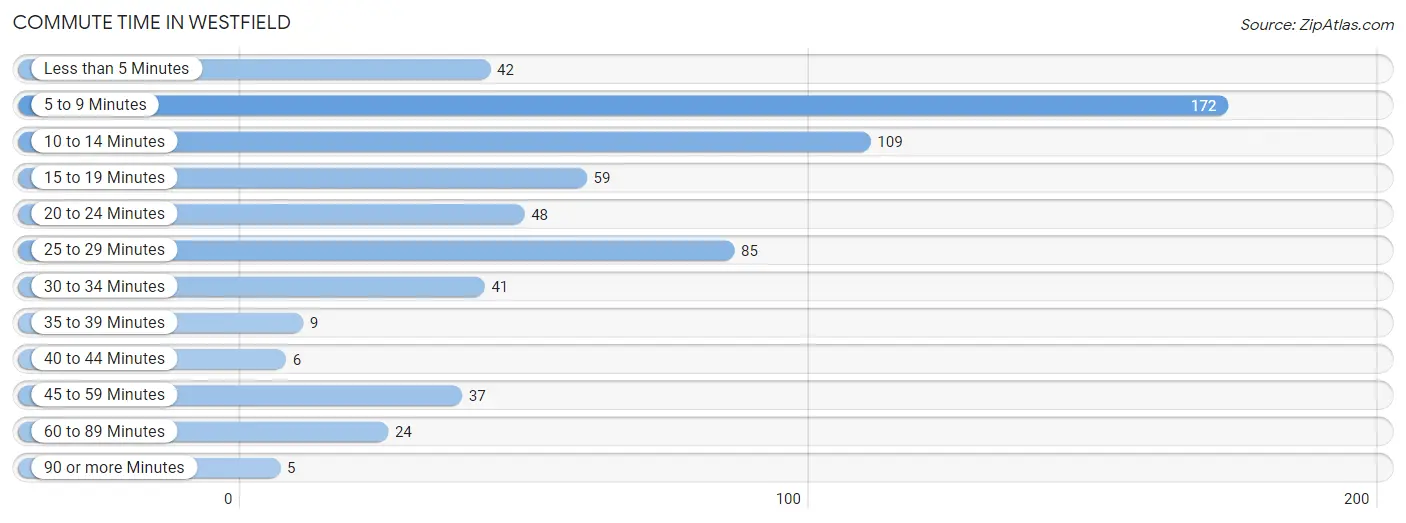
| Commute Time | # Commuters | % Commuters |
| Less than 5 Minutes | 42 | 6.6% |
| 5 to 9 Minutes | 172 | 27.0% |
| 10 to 14 Minutes | 109 | 17.1% |
| 15 to 19 Minutes | 59 | 9.3% |
| 20 to 24 Minutes | 48 | 7.5% |
| 25 to 29 Minutes | 85 | 13.3% |
| 30 to 34 Minutes | 41 | 6.4% |
| 35 to 39 Minutes | 9 | 1.4% |
| 40 to 44 Minutes | 6 | 0.9% |
| 45 to 59 Minutes | 37 | 5.8% |
| 60 to 89 Minutes | 24 | 3.8% |
| 90 or more Minutes | 5 | 0.8% |
Commute Time by Sex in Westfield
The most common commute times in Westfield are 5 to 9 minutes (96 commuters, 27.2%) for males and 5 to 9 minutes (76 commuters, 26.8%) for females.
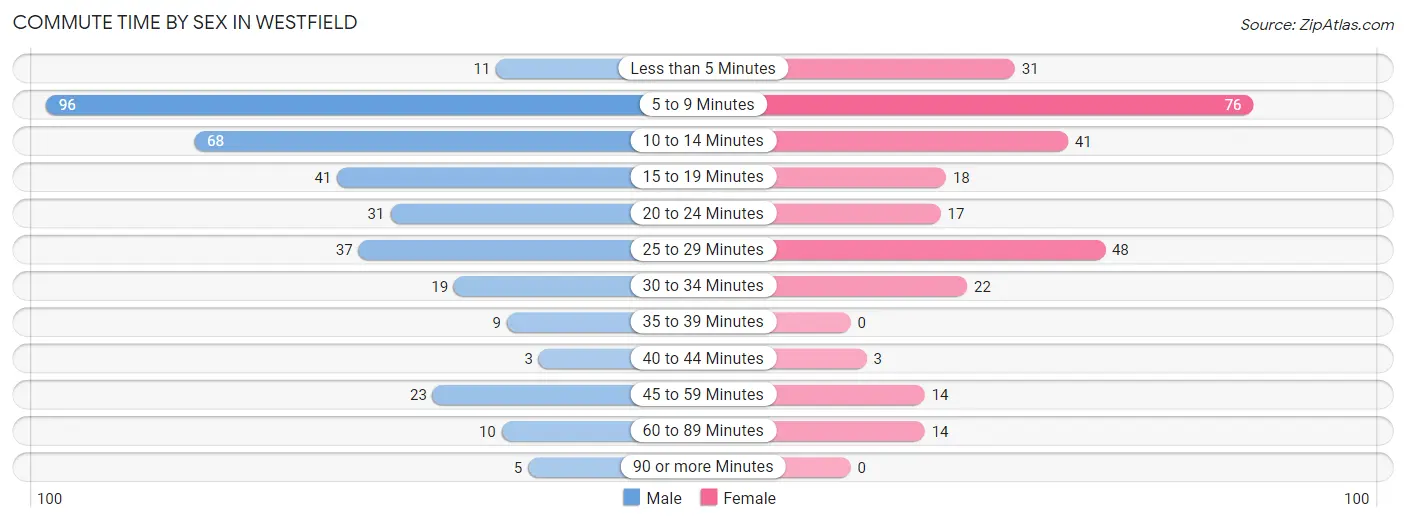
| Commute Time | Male | Female |
| Less than 5 Minutes | 11 (3.1%) | 31 (10.9%) |
| 5 to 9 Minutes | 96 (27.2%) | 76 (26.8%) |
| 10 to 14 Minutes | 68 (19.3%) | 41 (14.4%) |
| 15 to 19 Minutes | 41 (11.6%) | 18 (6.3%) |
| 20 to 24 Minutes | 31 (8.8%) | 17 (6.0%) |
| 25 to 29 Minutes | 37 (10.5%) | 48 (16.9%) |
| 30 to 34 Minutes | 19 (5.4%) | 22 (7.7%) |
| 35 to 39 Minutes | 9 (2.5%) | 0 (0.0%) |
| 40 to 44 Minutes | 3 (0.9%) | 3 (1.1%) |
| 45 to 59 Minutes | 23 (6.5%) | 14 (4.9%) |
| 60 to 89 Minutes | 10 (2.8%) | 14 (4.9%) |
| 90 or more Minutes | 5 (1.4%) | 0 (0.0%) |
Time of Departure to Work by Sex in Westfield
The most frequent times of departure to work in Westfield are 6:00 AM to 6:29 AM (69, 19.6%) for males and 7:30 AM to 7:59 AM (46, 16.2%) for females.
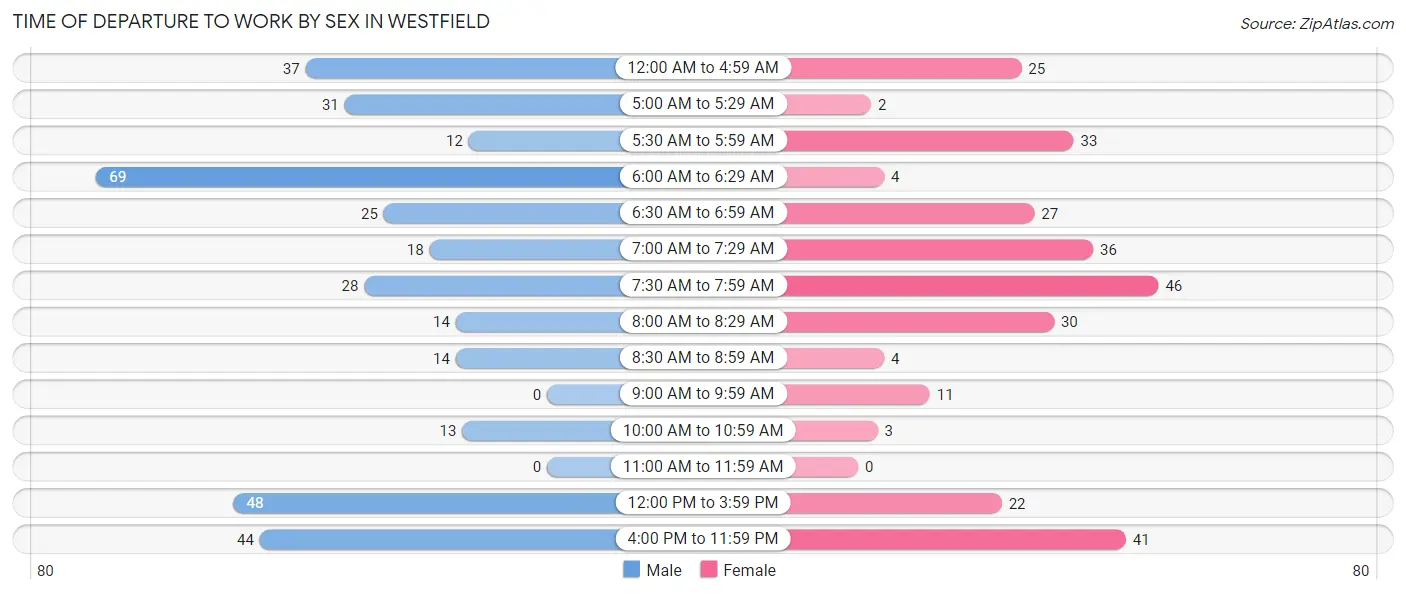
| Time of Departure | Male | Female |
| 12:00 AM to 4:59 AM | 37 (10.5%) | 25 (8.8%) |
| 5:00 AM to 5:29 AM | 31 (8.8%) | 2 (0.7%) |
| 5:30 AM to 5:59 AM | 12 (3.4%) | 33 (11.6%) |
| 6:00 AM to 6:29 AM | 69 (19.6%) | 4 (1.4%) |
| 6:30 AM to 6:59 AM | 25 (7.1%) | 27 (9.5%) |
| 7:00 AM to 7:29 AM | 18 (5.1%) | 36 (12.7%) |
| 7:30 AM to 7:59 AM | 28 (7.9%) | 46 (16.2%) |
| 8:00 AM to 8:29 AM | 14 (4.0%) | 30 (10.6%) |
| 8:30 AM to 8:59 AM | 14 (4.0%) | 4 (1.4%) |
| 9:00 AM to 9:59 AM | 0 (0.0%) | 11 (3.9%) |
| 10:00 AM to 10:59 AM | 13 (3.7%) | 3 (1.1%) |
| 11:00 AM to 11:59 AM | 0 (0.0%) | 0 (0.0%) |
| 12:00 PM to 3:59 PM | 48 (13.6%) | 22 (7.7%) |
| 4:00 PM to 11:59 PM | 44 (12.5%) | 41 (14.4%) |
| Total | 353 (100.0%) | 284 (100.0%) |
Housing Occupancy in Westfield
Occupancy by Ownership in Westfield
Of the total 512 dwellings in Westfield, owner-occupied units account for 251 (49.0%), while renter-occupied units make up 261 (51.0%).
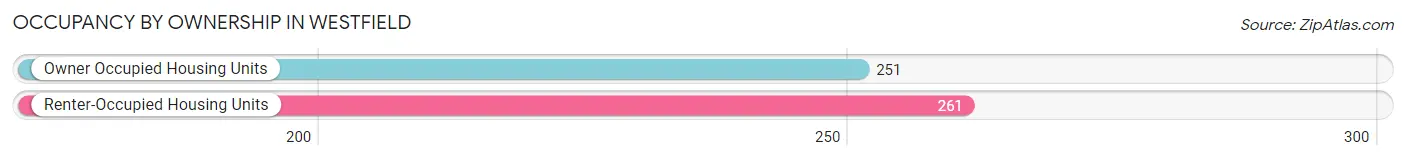
| Occupancy | # Housing Units | % Housing Units |
| Owner Occupied Housing Units | 251 | 49.0% |
| Renter-Occupied Housing Units | 261 | 51.0% |
| Total Occupied Housing Units | 512 | 100.0% |
Occupancy by Household Size in Westfield
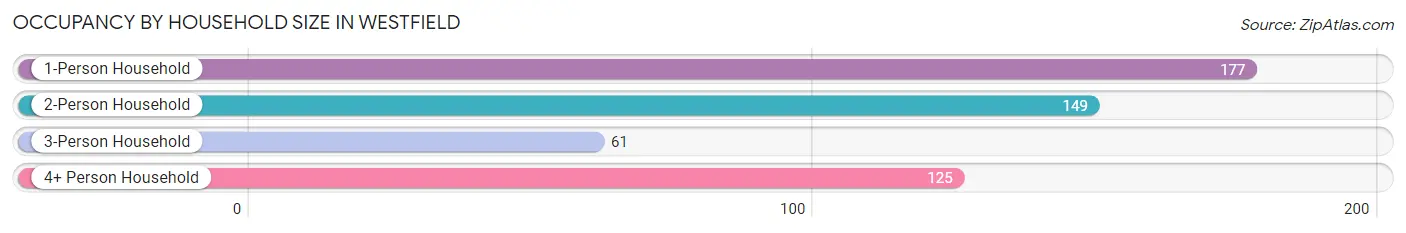
| Household Size | # Housing Units | % Housing Units |
| 1-Person Household | 177 | 34.6% |
| 2-Person Household | 149 | 29.1% |
| 3-Person Household | 61 | 11.9% |
| 4+ Person Household | 125 | 24.4% |
| Total Housing Units | 512 | 100.0% |
Occupancy by Ownership by Household Size in Westfield
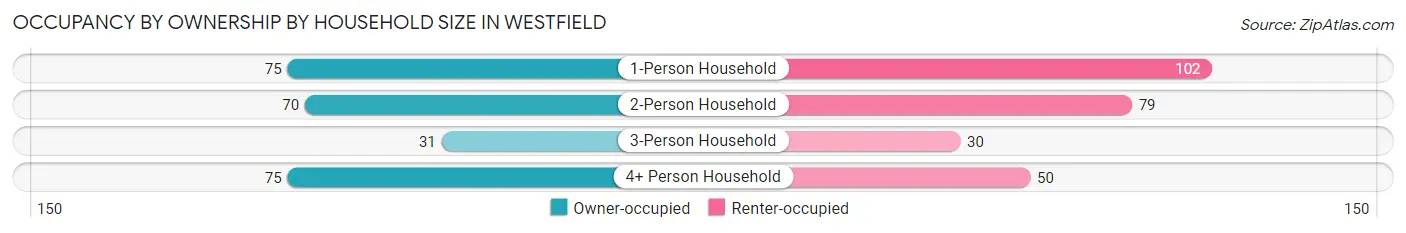
| Household Size | Owner-occupied | Renter-occupied |
| 1-Person Household | 75 (42.4%) | 102 (57.6%) |
| 2-Person Household | 70 (47.0%) | 79 (53.0%) |
| 3-Person Household | 31 (50.8%) | 30 (49.2%) |
| 4+ Person Household | 75 (60.0%) | 50 (40.0%) |
| Total Housing Units | 251 (49.0%) | 261 (51.0%) |
Occupancy by Educational Attainment in Westfield
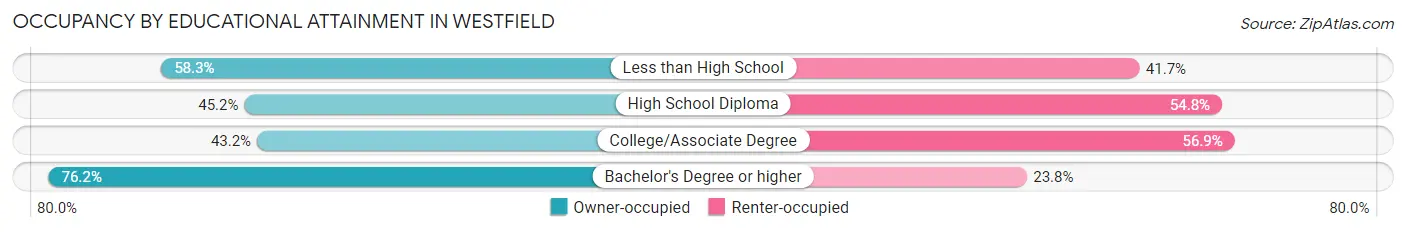
| Household Size | Owner-occupied | Renter-occupied |
| Less than High School | 14 (58.3%) | 10 (41.7%) |
| High School Diploma | 126 (45.2%) | 153 (54.8%) |
| College/Associate Degree | 63 (43.1%) | 83 (56.9%) |
| Bachelor's Degree or higher | 48 (76.2%) | 15 (23.8%) |
Occupancy by Age of Householder in Westfield
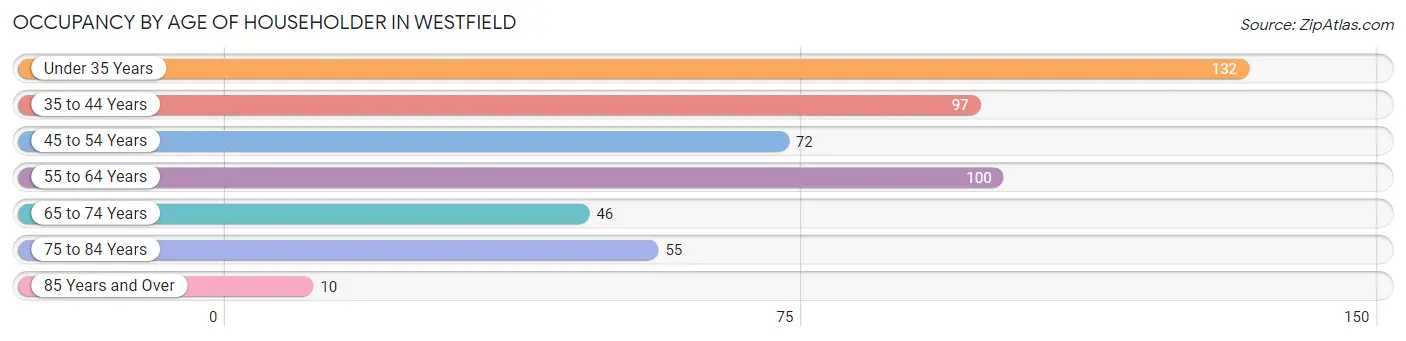
| Age Bracket | # Households | % Households |
| Under 35 Years | 132 | 25.8% |
| 35 to 44 Years | 97 | 19.0% |
| 45 to 54 Years | 72 | 14.1% |
| 55 to 64 Years | 100 | 19.5% |
| 65 to 74 Years | 46 | 9.0% |
| 75 to 84 Years | 55 | 10.7% |
| 85 Years and Over | 10 | 1.9% |
| Total | 512 | 100.0% |
Housing Finances in Westfield
Median Income by Occupancy in Westfield
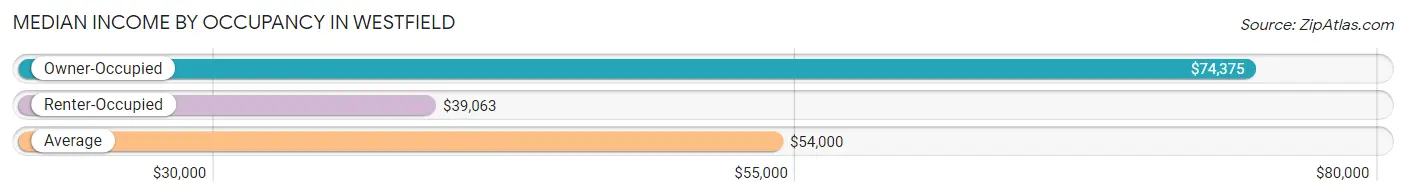
| Occupancy Type | # Households | Median Income |
| Owner-Occupied | 251 (49.0%) | $74,375 |
| Renter-Occupied | 261 (51.0%) | $39,063 |
| Average | 512 (100.0%) | $54,000 |
Occupancy by Householder Income Bracket in Westfield
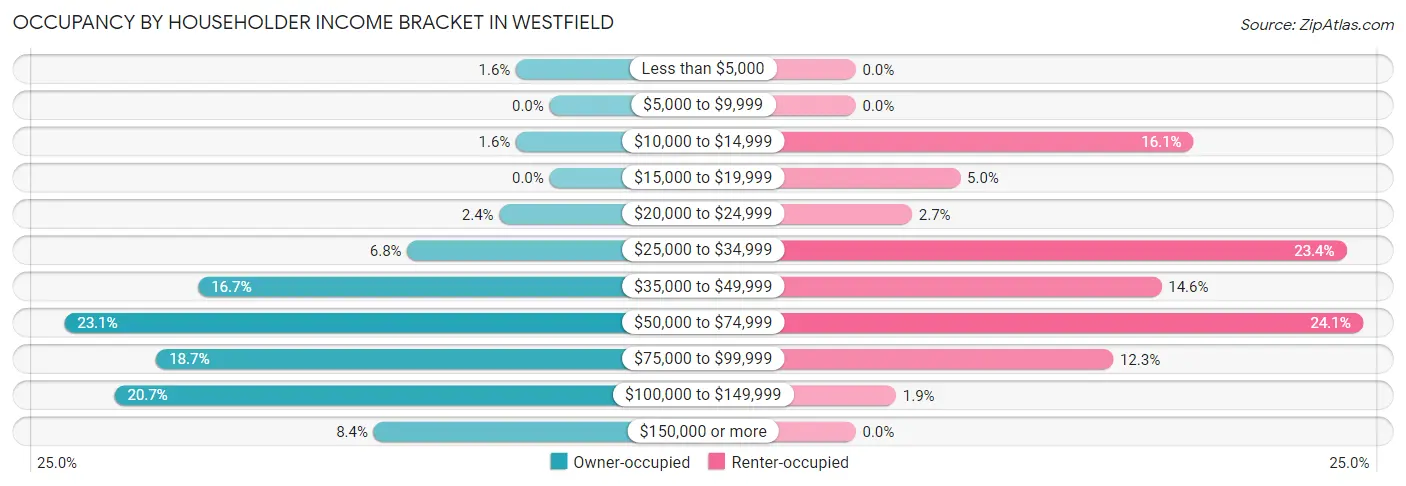
| Income Bracket | Owner-occupied | Renter-occupied |
| Less than $5,000 | 4 (1.6%) | 0 (0.0%) |
| $5,000 to $9,999 | 0 (0.0%) | 0 (0.0%) |
| $10,000 to $14,999 | 4 (1.6%) | 42 (16.1%) |
| $15,000 to $19,999 | 0 (0.0%) | 13 (5.0%) |
| $20,000 to $24,999 | 6 (2.4%) | 7 (2.7%) |
| $25,000 to $34,999 | 17 (6.8%) | 61 (23.4%) |
| $35,000 to $49,999 | 42 (16.7%) | 38 (14.6%) |
| $50,000 to $74,999 | 58 (23.1%) | 63 (24.1%) |
| $75,000 to $99,999 | 47 (18.7%) | 32 (12.3%) |
| $100,000 to $149,999 | 52 (20.7%) | 5 (1.9%) |
| $150,000 or more | 21 (8.4%) | 0 (0.0%) |
| Total | 251 (100.0%) | 261 (100.0%) |
Monthly Housing Cost Tiers in Westfield
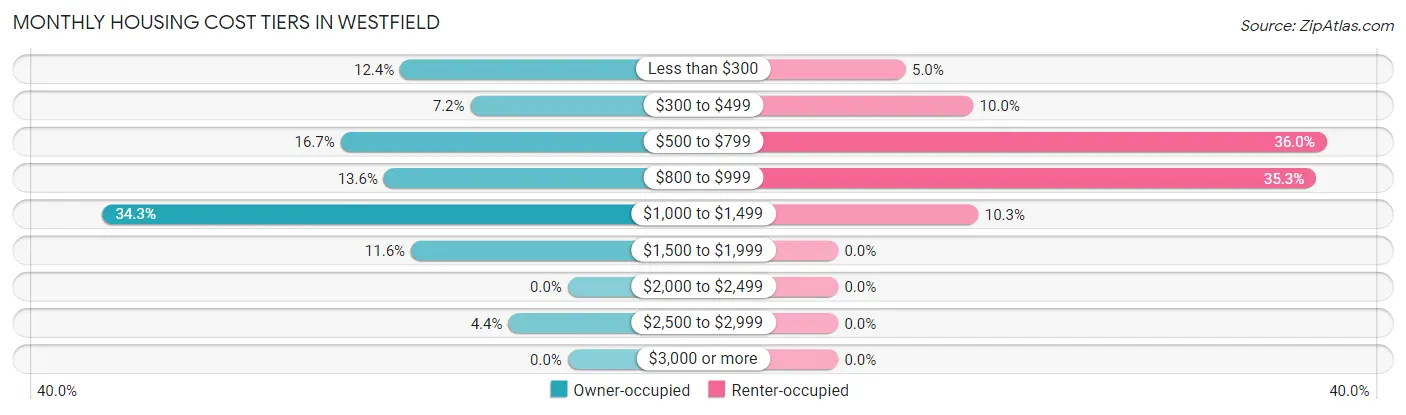
| Monthly Cost | Owner-occupied | Renter-occupied |
| Less than $300 | 31 (12.3%) | 13 (5.0%) |
| $300 to $499 | 18 (7.2%) | 26 (10.0%) |
| $500 to $799 | 42 (16.7%) | 94 (36.0%) |
| $800 to $999 | 34 (13.6%) | 92 (35.2%) |
| $1,000 to $1,499 | 86 (34.3%) | 27 (10.3%) |
| $1,500 to $1,999 | 29 (11.6%) | 0 (0.0%) |
| $2,000 to $2,499 | 0 (0.0%) | 0 (0.0%) |
| $2,500 to $2,999 | 11 (4.4%) | 0 (0.0%) |
| $3,000 or more | 0 (0.0%) | 0 (0.0%) |
| Total | 251 (100.0%) | 261 (100.0%) |
Physical Housing Characteristics in Westfield
Housing Structures in Westfield
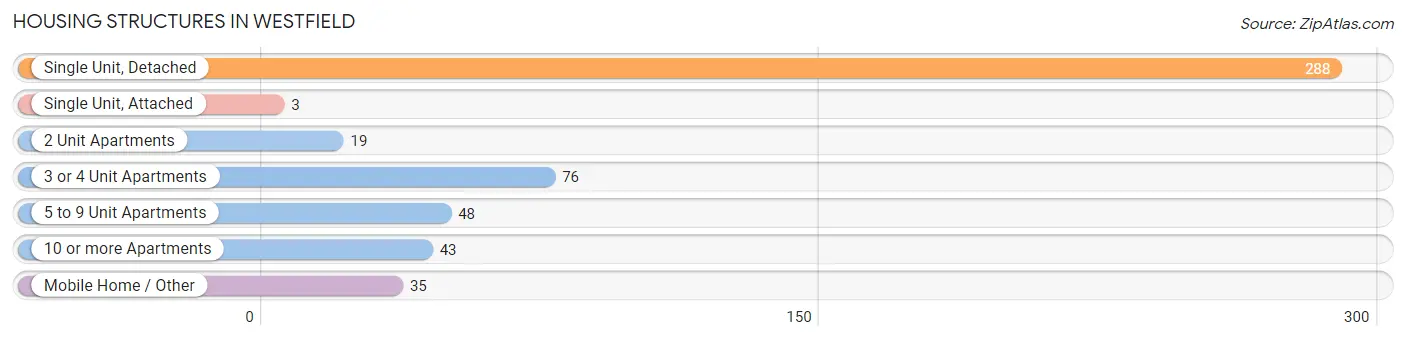
| Structure Type | # Housing Units | % Housing Units |
| Single Unit, Detached | 288 | 56.2% |
| Single Unit, Attached | 3 | 0.6% |
| 2 Unit Apartments | 19 | 3.7% |
| 3 or 4 Unit Apartments | 76 | 14.8% |
| 5 to 9 Unit Apartments | 48 | 9.4% |
| 10 or more Apartments | 43 | 8.4% |
| Mobile Home / Other | 35 | 6.8% |
| Total | 512 | 100.0% |
Housing Structures by Occupancy in Westfield
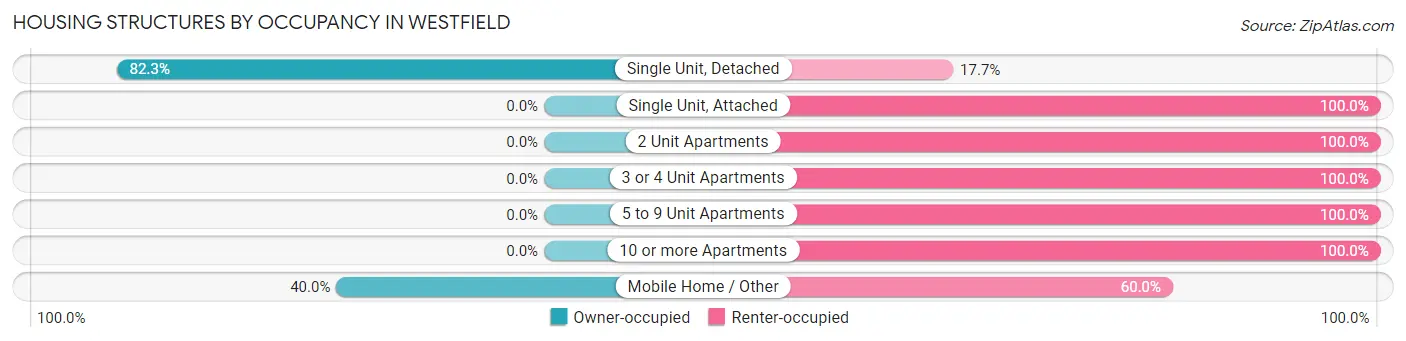
| Structure Type | Owner-occupied | Renter-occupied |
| Single Unit, Detached | 237 (82.3%) | 51 (17.7%) |
| Single Unit, Attached | 0 (0.0%) | 3 (100.0%) |
| 2 Unit Apartments | 0 (0.0%) | 19 (100.0%) |
| 3 or 4 Unit Apartments | 0 (0.0%) | 76 (100.0%) |
| 5 to 9 Unit Apartments | 0 (0.0%) | 48 (100.0%) |
| 10 or more Apartments | 0 (0.0%) | 43 (100.0%) |
| Mobile Home / Other | 14 (40.0%) | 21 (60.0%) |
| Total | 251 (49.0%) | 261 (51.0%) |
Housing Structures by Number of Rooms in Westfield
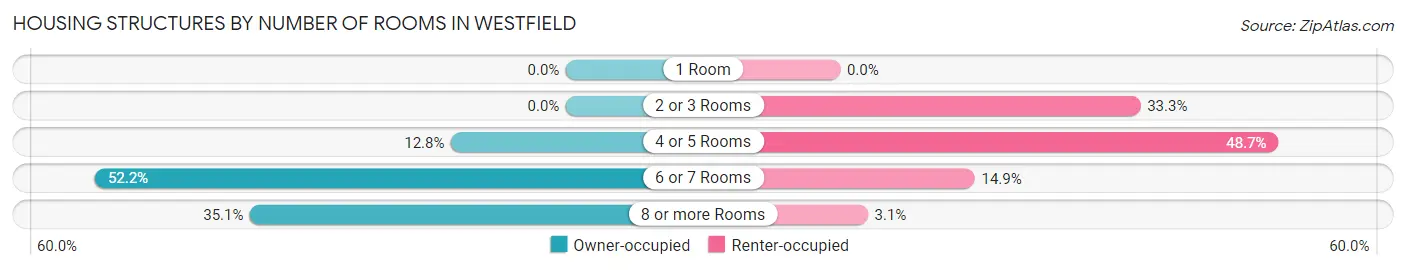
| Number of Rooms | Owner-occupied | Renter-occupied |
| 1 Room | 0 (0.0%) | 0 (0.0%) |
| 2 or 3 Rooms | 0 (0.0%) | 87 (33.3%) |
| 4 or 5 Rooms | 32 (12.8%) | 127 (48.7%) |
| 6 or 7 Rooms | 131 (52.2%) | 39 (14.9%) |
| 8 or more Rooms | 88 (35.1%) | 8 (3.1%) |
| Total | 251 (100.0%) | 261 (100.0%) |
Housing Structure by Heating Type in Westfield
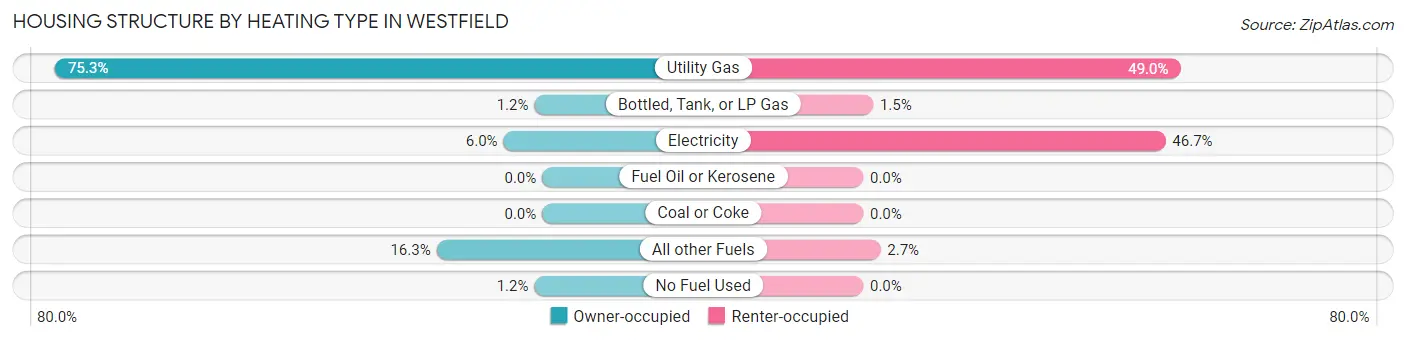
| Heating Type | Owner-occupied | Renter-occupied |
| Utility Gas | 189 (75.3%) | 128 (49.0%) |
| Bottled, Tank, or LP Gas | 3 (1.2%) | 4 (1.5%) |
| Electricity | 15 (6.0%) | 122 (46.7%) |
| Fuel Oil or Kerosene | 0 (0.0%) | 0 (0.0%) |
| Coal or Coke | 0 (0.0%) | 0 (0.0%) |
| All other Fuels | 41 (16.3%) | 7 (2.7%) |
| No Fuel Used | 3 (1.2%) | 0 (0.0%) |
| Total | 251 (100.0%) | 261 (100.0%) |
Household Vehicle Usage in Westfield
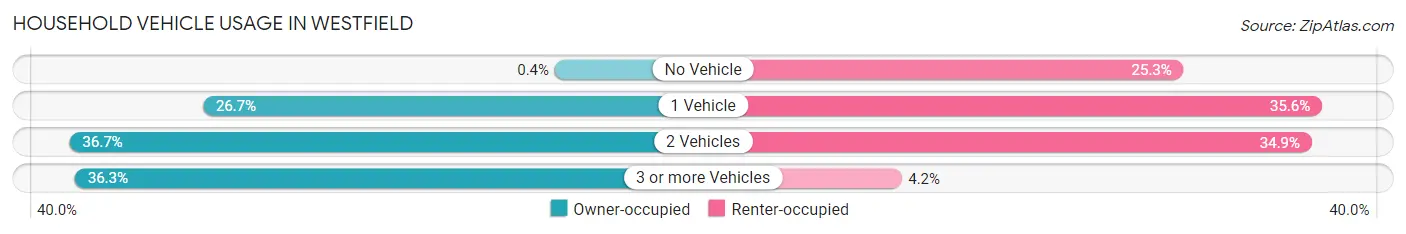
| Vehicles per Household | Owner-occupied | Renter-occupied |
| No Vehicle | 1 (0.4%) | 66 (25.3%) |
| 1 Vehicle | 67 (26.7%) | 93 (35.6%) |
| 2 Vehicles | 92 (36.6%) | 91 (34.9%) |
| 3 or more Vehicles | 91 (36.2%) | 11 (4.2%) |
| Total | 251 (100.0%) | 261 (100.0%) |
Real Estate & Mortgages in Westfield
Real Estate and Mortgage Overview in Westfield
| Characteristic | Without Mortgage | With Mortgage |
| Housing Units | 92 | 159 |
| Median Property Value | $79,400 | $145,400 |
| Median Household Income | $48,750 | $21 |
| Monthly Housing Costs | $463 | $0 |
| Real Estate Taxes | $1,778 | $0 |
Property Value by Mortgage Status in Westfield
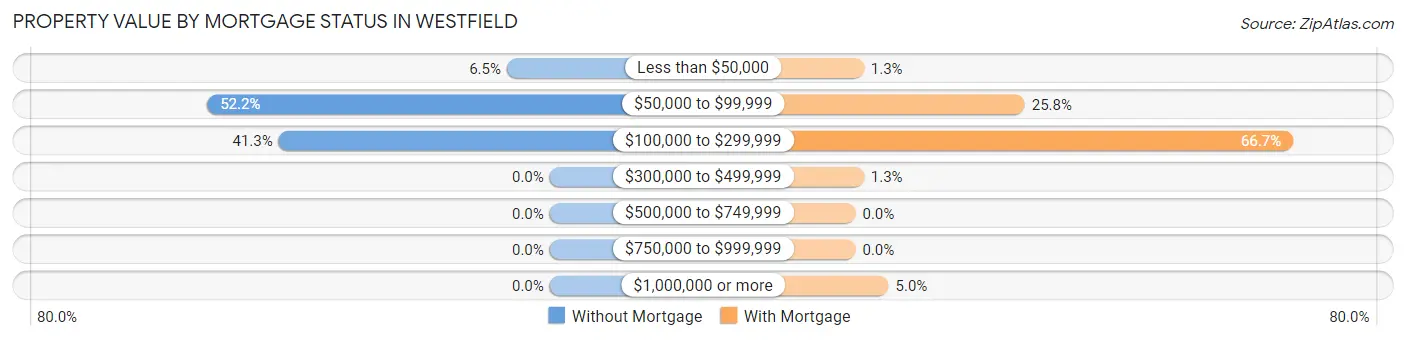
| Property Value | Without Mortgage | With Mortgage |
| Less than $50,000 | 6 (6.5%) | 2 (1.3%) |
| $50,000 to $99,999 | 48 (52.2%) | 41 (25.8%) |
| $100,000 to $299,999 | 38 (41.3%) | 106 (66.7%) |
| $300,000 to $499,999 | 0 (0.0%) | 2 (1.3%) |
| $500,000 to $749,999 | 0 (0.0%) | 0 (0.0%) |
| $750,000 to $999,999 | 0 (0.0%) | 0 (0.0%) |
| $1,000,000 or more | 0 (0.0%) | 8 (5.0%) |
| Total | 92 (100.0%) | 159 (100.0%) |
Household Income by Mortgage Status in Westfield
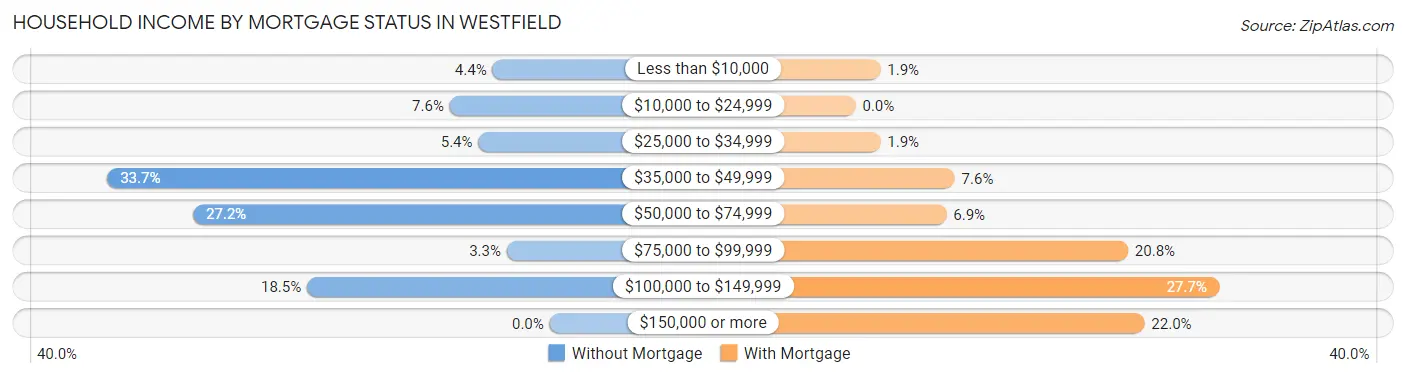
| Household Income | Without Mortgage | With Mortgage |
| Less than $10,000 | 4 (4.3%) | 3 (1.9%) |
| $10,000 to $24,999 | 7 (7.6%) | 0 (0.0%) |
| $25,000 to $34,999 | 5 (5.4%) | 3 (1.9%) |
| $35,000 to $49,999 | 31 (33.7%) | 12 (7.5%) |
| $50,000 to $74,999 | 25 (27.2%) | 11 (6.9%) |
| $75,000 to $99,999 | 3 (3.3%) | 33 (20.7%) |
| $100,000 to $149,999 | 17 (18.5%) | 44 (27.7%) |
| $150,000 or more | 0 (0.0%) | 35 (22.0%) |
| Total | 92 (100.0%) | 159 (100.0%) |
Property Value to Household Income Ratio in Westfield
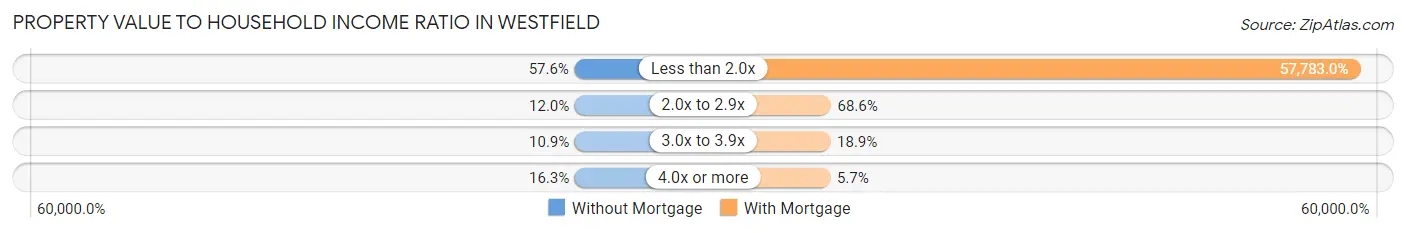
| Value-to-Income Ratio | Without Mortgage | With Mortgage |
| Less than 2.0x | 53 (57.6%) | 91,875 (57,783.0%) |
| 2.0x to 2.9x | 11 (12.0%) | 109 (68.5%) |
| 3.0x to 3.9x | 10 (10.9%) | 30 (18.9%) |
| 4.0x or more | 15 (16.3%) | 9 (5.7%) |
| Total | 92 (100.0%) | 159 (100.0%) |
Real Estate Taxes by Mortgage Status in Westfield
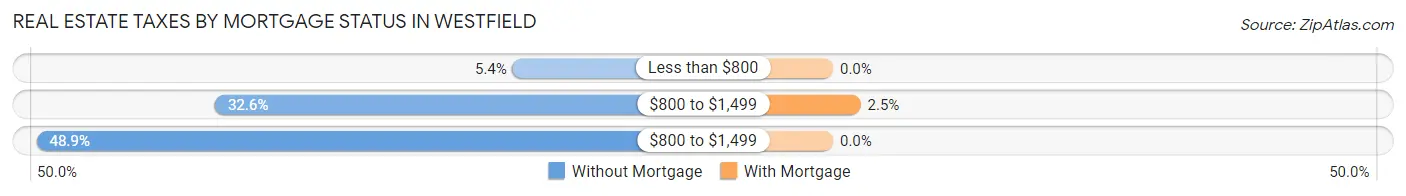
| Property Taxes | Without Mortgage | With Mortgage |
| Less than $800 | 5 (5.4%) | 0 (0.0%) |
| $800 to $1,499 | 30 (32.6%) | 4 (2.5%) |
| $800 to $1,499 | 45 (48.9%) | 0 (0.0%) |
| Total | 92 (100.0%) | 159 (100.0%) |
Health & Disability in Westfield
Health Insurance Coverage by Age in Westfield
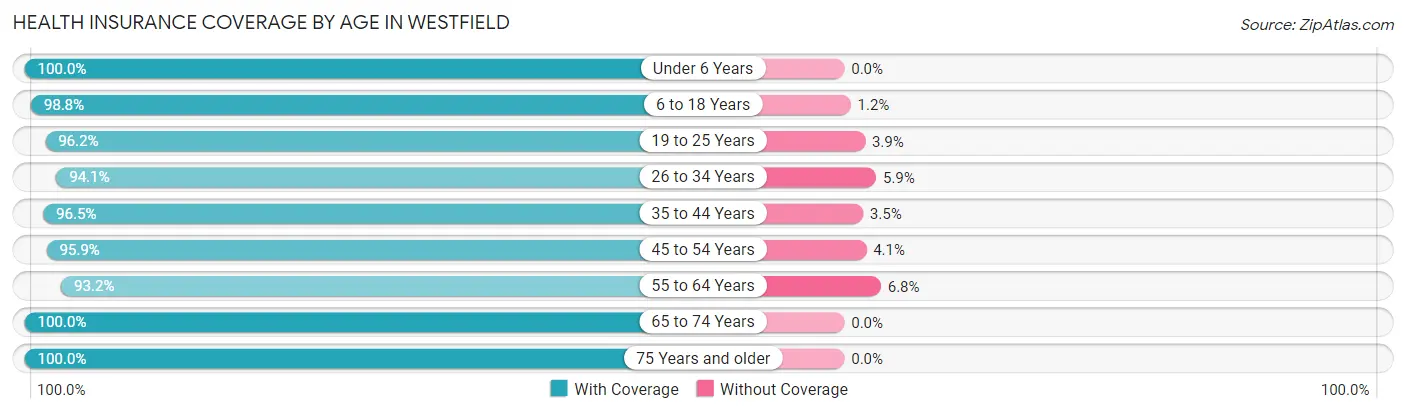
| Age Bracket | With Coverage | Without Coverage |
| Under 6 Years | 104 (100.0%) | 0 (0.0%) |
| 6 to 18 Years | 251 (98.8%) | 3 (1.2%) |
| 19 to 25 Years | 100 (96.2%) | 4 (3.8%) |
| 26 to 34 Years | 159 (94.1%) | 10 (5.9%) |
| 35 to 44 Years | 167 (96.5%) | 6 (3.5%) |
| 45 to 54 Years | 141 (95.9%) | 6 (4.1%) |
| 55 to 64 Years | 137 (93.2%) | 10 (6.8%) |
| 65 to 74 Years | 93 (100.0%) | 0 (0.0%) |
| 75 Years and older | 79 (100.0%) | 0 (0.0%) |
| Total | 1,231 (96.9%) | 39 (3.1%) |
Health Insurance Coverage by Citizenship Status in Westfield
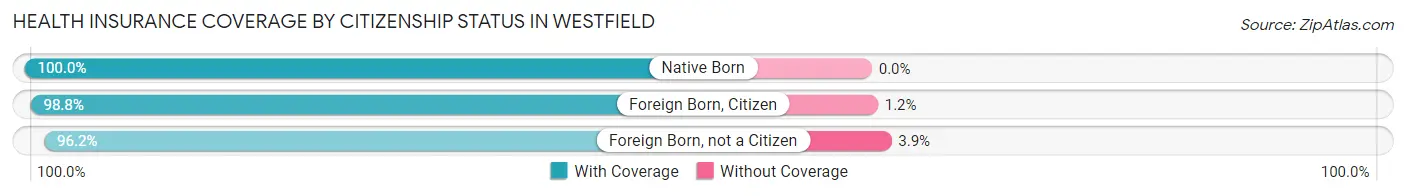
| Citizenship Status | With Coverage | Without Coverage |
| Native Born | 104 (100.0%) | 0 (0.0%) |
| Foreign Born, Citizen | 251 (98.8%) | 3 (1.2%) |
| Foreign Born, not a Citizen | 100 (96.2%) | 4 (3.8%) |
Health Insurance Coverage by Household Income in Westfield
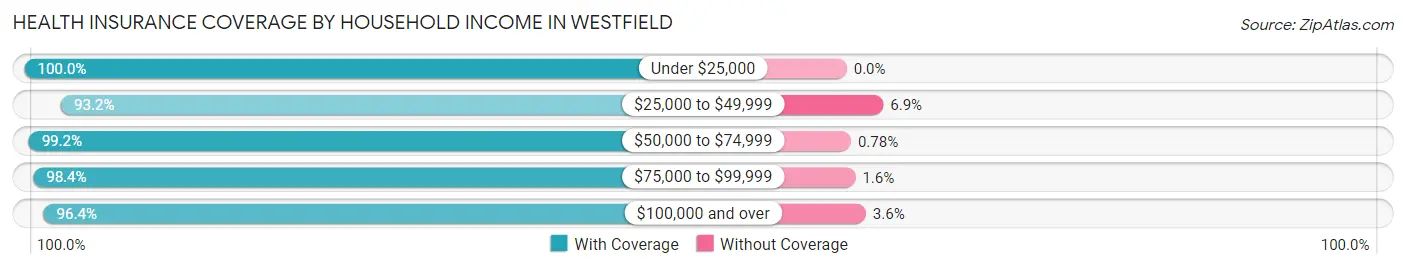
| Household Income | With Coverage | Without Coverage |
| Under $25,000 | 80 (100.0%) | 0 (0.0%) |
| $25,000 to $49,999 | 313 (93.1%) | 23 (6.9%) |
| $50,000 to $74,999 | 384 (99.2%) | 3 (0.8%) |
| $75,000 to $99,999 | 181 (98.4%) | 3 (1.6%) |
| $100,000 and over | 269 (96.4%) | 10 (3.6%) |
Public vs Private Health Insurance Coverage by Age in Westfield
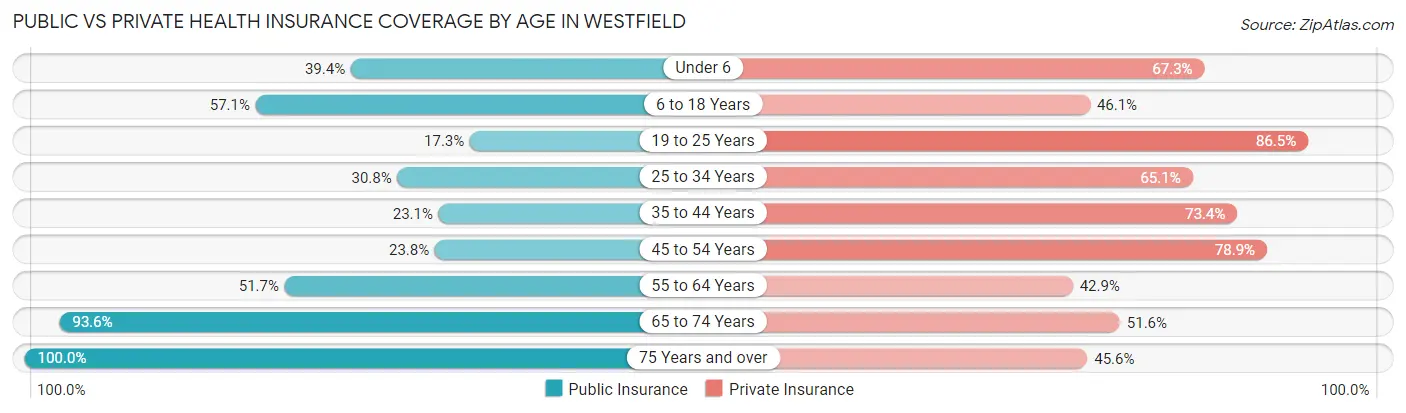
| Age Bracket | Public Insurance | Private Insurance |
| Under 6 | 41 (39.4%) | 70 (67.3%) |
| 6 to 18 Years | 145 (57.1%) | 117 (46.1%) |
| 19 to 25 Years | 18 (17.3%) | 90 (86.5%) |
| 25 to 34 Years | 52 (30.8%) | 110 (65.1%) |
| 35 to 44 Years | 40 (23.1%) | 127 (73.4%) |
| 45 to 54 Years | 35 (23.8%) | 116 (78.9%) |
| 55 to 64 Years | 76 (51.7%) | 63 (42.9%) |
| 65 to 74 Years | 87 (93.5%) | 48 (51.6%) |
| 75 Years and over | 79 (100.0%) | 36 (45.6%) |
| Total | 573 (45.1%) | 777 (61.2%) |
Disability Status by Sex by Age in Westfield
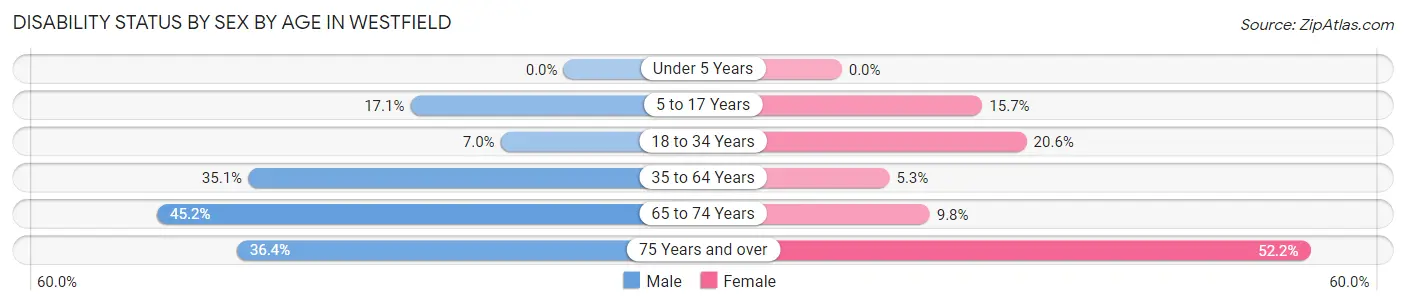
| Age Bracket | Male | Female |
| Under 5 Years | 0 (0.0%) | 0 (0.0%) |
| 5 to 17 Years | 30 (17.1%) | 13 (15.7%) |
| 18 to 34 Years | 11 (7.0%) | 28 (20.6%) |
| 35 to 64 Years | 98 (35.1%) | 10 (5.3%) |
| 65 to 74 Years | 19 (45.2%) | 5 (9.8%) |
| 75 Years and over | 12 (36.4%) | 24 (52.2%) |
Disability Class by Sex by Age in Westfield
Disability Class: Hearing Difficulty
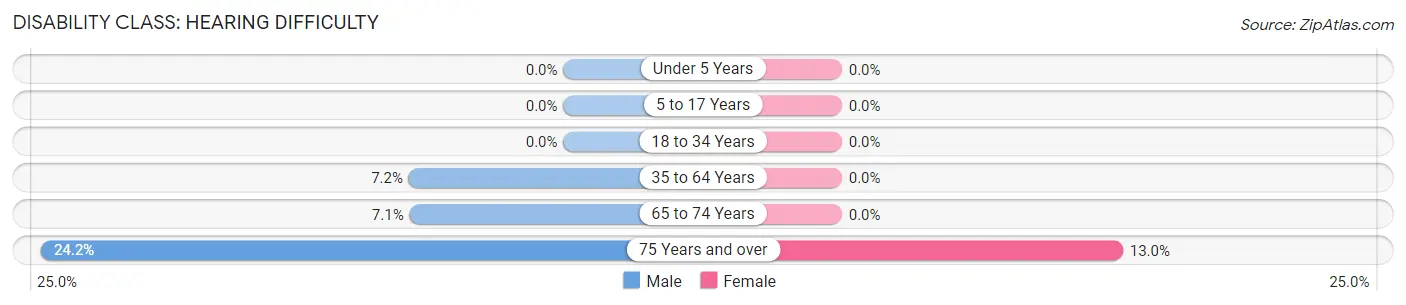
| Age Bracket | Male | Female |
| Under 5 Years | 0 (0.0%) | 0 (0.0%) |
| 5 to 17 Years | 0 (0.0%) | 0 (0.0%) |
| 18 to 34 Years | 0 (0.0%) | 0 (0.0%) |
| 35 to 64 Years | 20 (7.2%) | 0 (0.0%) |
| 65 to 74 Years | 3 (7.1%) | 0 (0.0%) |
| 75 Years and over | 8 (24.2%) | 6 (13.0%) |
Disability Class: Vision Difficulty
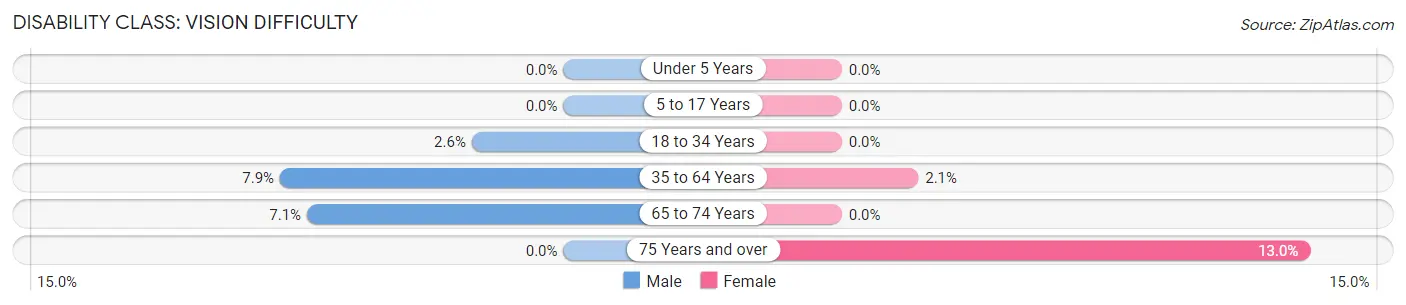
| Age Bracket | Male | Female |
| Under 5 Years | 0 (0.0%) | 0 (0.0%) |
| 5 to 17 Years | 0 (0.0%) | 0 (0.0%) |
| 18 to 34 Years | 4 (2.5%) | 0 (0.0%) |
| 35 to 64 Years | 22 (7.9%) | 4 (2.1%) |
| 65 to 74 Years | 3 (7.1%) | 0 (0.0%) |
| 75 Years and over | 0 (0.0%) | 6 (13.0%) |
Disability Class: Cognitive Difficulty
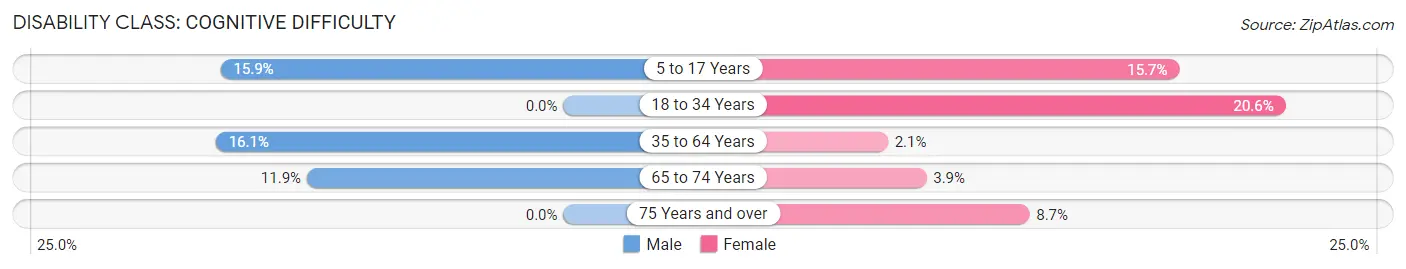
| Age Bracket | Male | Female |
| 5 to 17 Years | 28 (15.9%) | 13 (15.7%) |
| 18 to 34 Years | 0 (0.0%) | 28 (20.6%) |
| 35 to 64 Years | 45 (16.1%) | 4 (2.1%) |
| 65 to 74 Years | 5 (11.9%) | 2 (3.9%) |
| 75 Years and over | 0 (0.0%) | 4 (8.7%) |
Disability Class: Ambulatory Difficulty
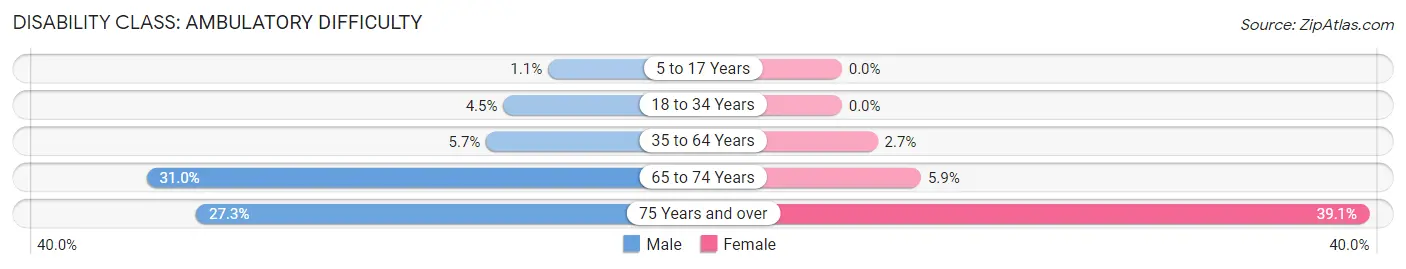
| Age Bracket | Male | Female |
| 5 to 17 Years | 2 (1.1%) | 0 (0.0%) |
| 18 to 34 Years | 7 (4.5%) | 0 (0.0%) |
| 35 to 64 Years | 16 (5.7%) | 5 (2.7%) |
| 65 to 74 Years | 13 (30.9%) | 3 (5.9%) |
| 75 Years and over | 9 (27.3%) | 18 (39.1%) |
Disability Class: Self-Care Difficulty
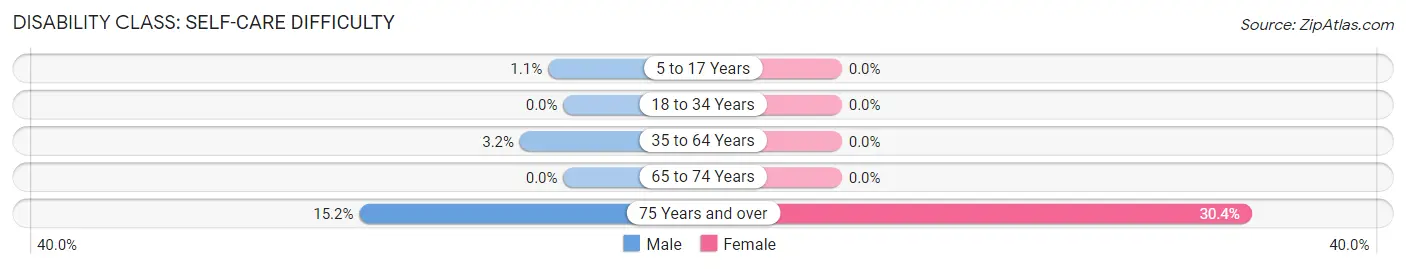
| Age Bracket | Male | Female |
| 5 to 17 Years | 2 (1.1%) | 0 (0.0%) |
| 18 to 34 Years | 0 (0.0%) | 0 (0.0%) |
| 35 to 64 Years | 9 (3.2%) | 0 (0.0%) |
| 65 to 74 Years | 0 (0.0%) | 0 (0.0%) |
| 75 Years and over | 5 (15.1%) | 14 (30.4%) |
Technology Access in Westfield
Computing Device Access in Westfield
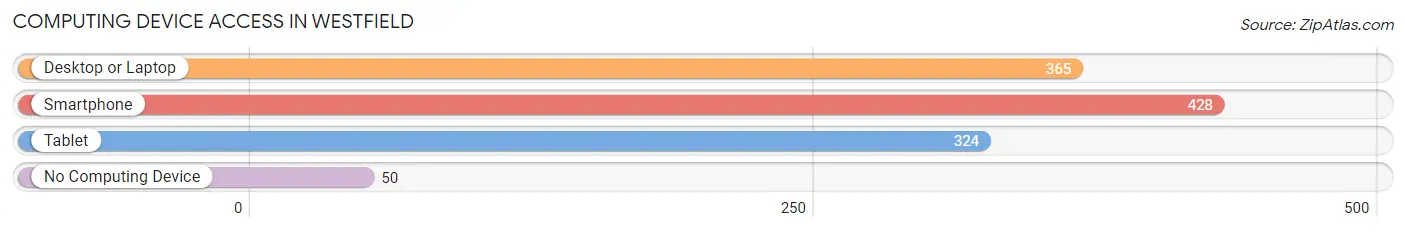
| Device Type | # Households | % Households |
| Desktop or Laptop | 365 | 71.3% |
| Smartphone | 428 | 83.6% |
| Tablet | 324 | 63.3% |
| No Computing Device | 50 | 9.8% |
| Total | 512 | 100.0% |
Internet Access in Westfield
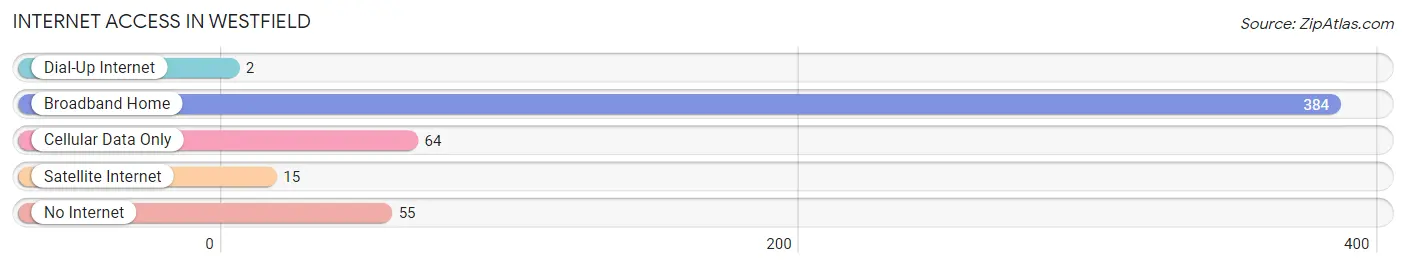
| Internet Type | # Households | % Households |
| Dial-Up Internet | 2 | 0.4% |
| Broadband Home | 384 | 75.0% |
| Cellular Data Only | 64 | 12.5% |
| Satellite Internet | 15 | 2.9% |
| No Internet | 55 | 10.7% |
| Total | 512 | 100.0% |
Westfield Summary
History
Westfield, Wisconsin is a small city located in Marquette County, Wisconsin. It is situated on the banks of the Lemonweir River, and is the county seat of Marquette County. The city was founded in 1856 by a group of settlers from New York, and was originally known as Westfield Center. The city was named after Westfield, New York, the hometown of the settlers.
The city of Westfield was incorporated in 1872, and the first mayor was elected in 1873. The city quickly grew and prospered, and by the early 1900s, it had become a major center for the lumber industry. The city was also home to several other industries, including a brickyard, a flour mill, and a sawmill.
In the early 1900s, Westfield was a bustling city with a population of over 3,000 people. The city was home to several churches, schools, and businesses. The city also had a thriving downtown area, with several stores, restaurants, and other businesses.
In the 1950s, the city began to decline as the lumber industry began to decline. The city's population began to decline as well, and by the 1970s, the population had dropped to just over 1,000 people.
In the late 1970s, the city began to experience a resurgence as the lumber industry began to recover. The city's population began to increase, and by the 2000s, the population had grown to over 2,000 people.
Geography
Westfield is located in the central part of Marquette County, Wisconsin. The city is situated on the banks of the Lemonweir River, and is surrounded by rolling hills and forests. The city is located approximately 30 miles northwest of Madison, Wisconsin, and is about an hour and a half drive from Milwaukee, Wisconsin.
The city of Westfield covers an area of approximately 4.5 square miles, and has a population of 2,072 people, as of the 2010 census. The city is located at an elevation of 845 feet above sea level.
Economy
The economy of Westfield is largely based on the lumber industry. The city is home to several lumber mills, and the lumber industry is the main source of employment for the city's residents. The city is also home to several other businesses, including a brickyard, a flour mill, and a sawmill.
The city is also home to several small businesses, including restaurants, retail stores, and other services. The city is also home to several small manufacturing companies, including a furniture manufacturer and a metal fabrication company.
Demographics
As of the 2010 census, the population of Westfield was 2,072 people. The racial makeup of the city was 97.3% White, 0.7% African American, 0.3% Native American, 0.2% Asian, 0.1% Pacific Islander, 0.4% from other races, and 1.0% from two or more races. Hispanic or Latino of any race were 1.2% of the population.
The median income for a household in the city was $37,917, and the median income for a family was $45,000. The per capita income for the city was $19,845. About 11.2% of families and 14.2% of the population were below the poverty line, including 18.2% of those under age 18 and 8.3% of those age 65 or over.
Common Questions
What is the Total Population of Westfield?
Total Population of Westfield is 1,270.
What is the Total Male Population of Westfield?
Total Male Population of Westfield is 737.
What is the Total Female Population of Westfield?
Total Female Population of Westfield is 533.
What is the Ratio of Males per 100 Females in Westfield?
There are 138.27 Males per 100 Females in Westfield.
What is the Ratio of Females per 100 Males in Westfield?
There are 72.32 Females per 100 Males in Westfield.
What is the Median Population Age in Westfield?
Median Population Age in Westfield is 35.1 Years.
What is the Average Family Size in Westfield
Average Family Size in Westfield is 3.3 People.
What is the Average Household Size in Westfield
Average Household Size in Westfield is 2.5 People.
What is Per Capita Income in Westfield?
Per Capita income in Westfield is $26,595.
What is the Median Family Income in Westfield?
Median Family Income in Westfield is $65,865.
What is the Median Household income in Westfield?
Median Household Income in Westfield is $54,000.
What is Income or Wage Gap in Westfield?
Income or Wage Gap in Westfield is 1.8%.
Women in Westfield earn 98.2 cents for every dollar earned by a man.
What is Inequality or Gini Index in Westfield?
Inequality or Gini Index in Westfield is 0.36.
How Large is the Labor Force in Westfield?
There are 677 People in the Labor Forcein in Westfield.
What is the Percentage of People in the Labor Force in Westfield?
70.2% of People are in the Labor Force in Westfield.
What is the Unemployment Rate in Westfield?
Unemployment Rate in Westfield is 1.9%.