Beaver Dam, WI Map & Demographics
Beaver Dam Map
Beaver Dam Overview
$37,106
PER CAPITA INCOME
$85,336
AVG FAMILY INCOME
$65,802
AVG HOUSEHOLD INCOME
21.7%
WAGE / INCOME GAP [ % ]
78.3¢/ $1
WAGE / INCOME GAP [ $ ]
0.36
INEQUALITY / GINI INDEX
16,652
TOTAL POPULATION
8,874
MALE POPULATION
7,778
FEMALE POPULATION
114.09
MALES / 100 FEMALES
87.65
FEMALES / 100 MALES
40.4
MEDIAN AGE
3.0
AVG FAMILY SIZE
2.1
AVG HOUSEHOLD SIZE
9,895
LABOR FORCE [ PEOPLE ]
72.2%
PERCENT IN LABOR FORCE
4.3%
UNEMPLOYMENT RATE
Beaver Dam Zip Codes
Beaver Dam Area Codes
Income in Beaver Dam
Income Overview in Beaver Dam
Per Capita Income in Beaver Dam is $37,106, while median incomes of families and households are $85,336 and $65,802 respectively.
| Characteristic | Number | Measure |
| Per Capita Income | 16,652 | $37,106 |
| Median Family Income | 3,872 | $85,336 |
| Mean Family Income | 3,872 | $93,855 |
| Median Household Income | 7,750 | $65,802 |
| Mean Household Income | 7,750 | $77,619 |
| Income Deficit | 3,872 | $0 |
| Wage / Income Gap (%) | 16,652 | 21.71% |
| Wage / Income Gap ($) | 16,652 | 78.29¢ per $1 |
| Gini / Inequality Index | 16,652 | 0.36 |
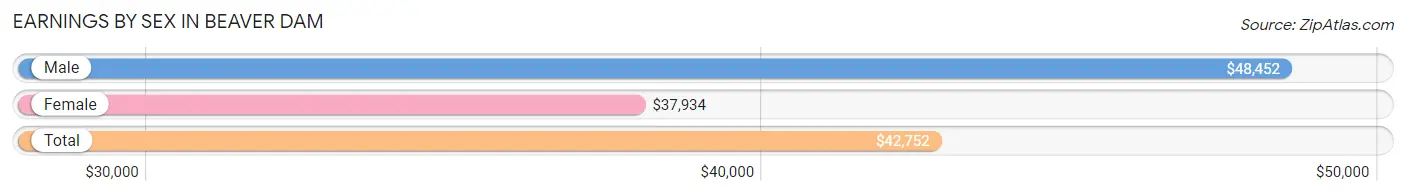
Earnings by Sex in Beaver Dam
Average Earnings in Beaver Dam are $42,752, $48,452 for men and $37,934 for women, a difference of 21.7%.
| Sex | Number | Average Earnings |
| Male | 5,514 (54.8%) | $48,452 |
| Female | 4,545 (45.2%) | $37,934 |
| Total | 10,059 (100.0%) | $42,752 |
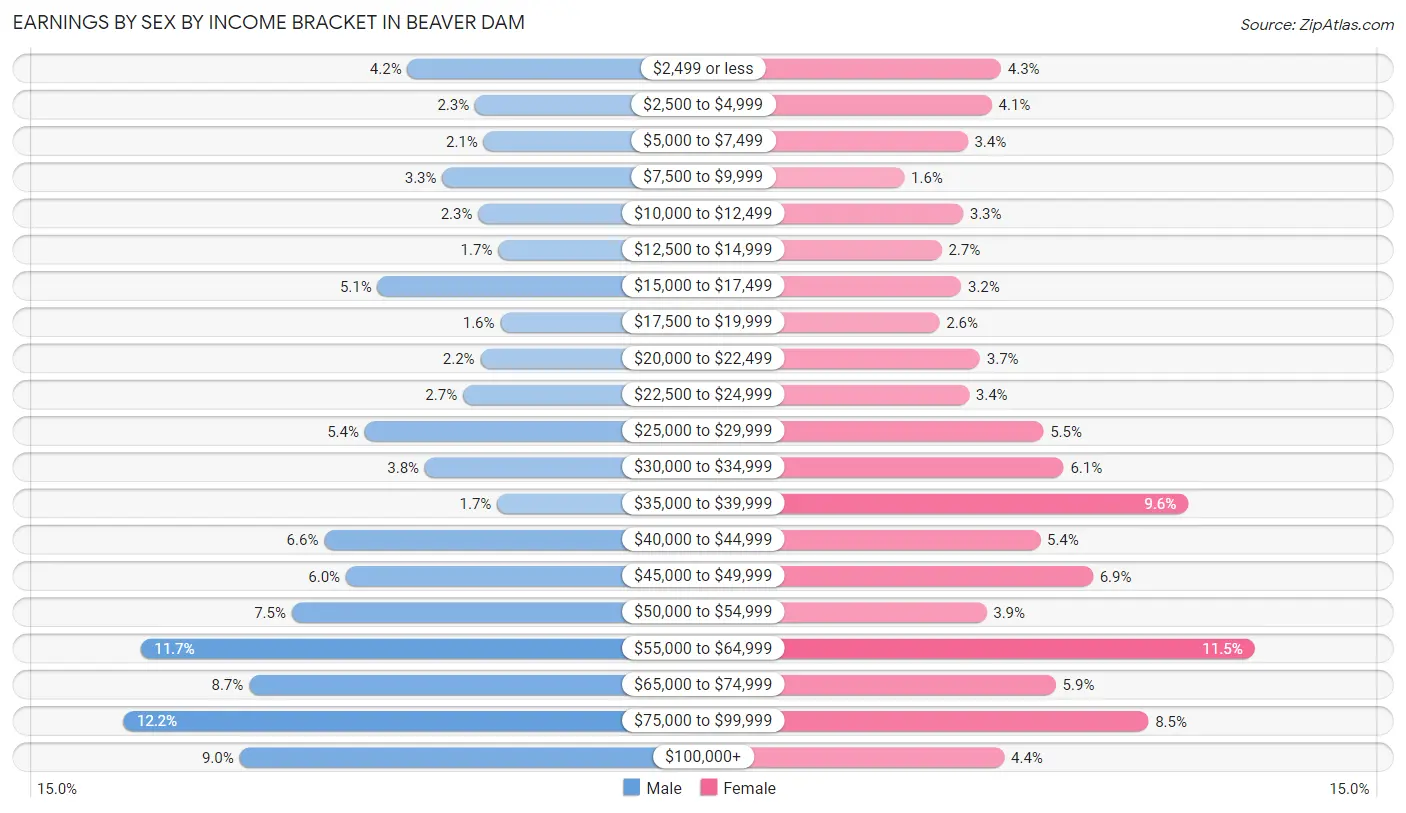
Earnings by Sex by Income Bracket in Beaver Dam
The most common earnings brackets in Beaver Dam are $75,000 to $99,999 for men (673 | 12.2%) and $55,000 to $64,999 for women (521 | 11.5%).
| Income | Male | Female |
| $2,499 or less | 234 (4.2%) | 197 (4.3%) |
| $2,500 to $4,999 | 129 (2.3%) | 185 (4.1%) |
| $5,000 to $7,499 | 116 (2.1%) | 154 (3.4%) |
| $7,500 to $9,999 | 180 (3.3%) | 73 (1.6%) |
| $10,000 to $12,499 | 124 (2.2%) | 148 (3.3%) |
| $12,500 to $14,999 | 93 (1.7%) | 121 (2.7%) |
| $15,000 to $17,499 | 280 (5.1%) | 146 (3.2%) |
| $17,500 to $19,999 | 90 (1.6%) | 118 (2.6%) |
| $20,000 to $22,499 | 121 (2.2%) | 170 (3.7%) |
| $22,500 to $24,999 | 148 (2.7%) | 156 (3.4%) |
| $25,000 to $29,999 | 300 (5.4%) | 251 (5.5%) |
| $30,000 to $34,999 | 207 (3.7%) | 277 (6.1%) |
| $35,000 to $39,999 | 95 (1.7%) | 436 (9.6%) |
| $40,000 to $44,999 | 363 (6.6%) | 247 (5.4%) |
| $45,000 to $49,999 | 329 (6.0%) | 314 (6.9%) |
| $50,000 to $54,999 | 413 (7.5%) | 178 (3.9%) |
| $55,000 to $64,999 | 646 (11.7%) | 521 (11.5%) |
| $65,000 to $74,999 | 479 (8.7%) | 267 (5.9%) |
| $75,000 to $99,999 | 673 (12.2%) | 385 (8.5%) |
| $100,000+ | 494 (9.0%) | 201 (4.4%) |
| Total | 5,514 (100.0%) | 4,545 (100.0%) |
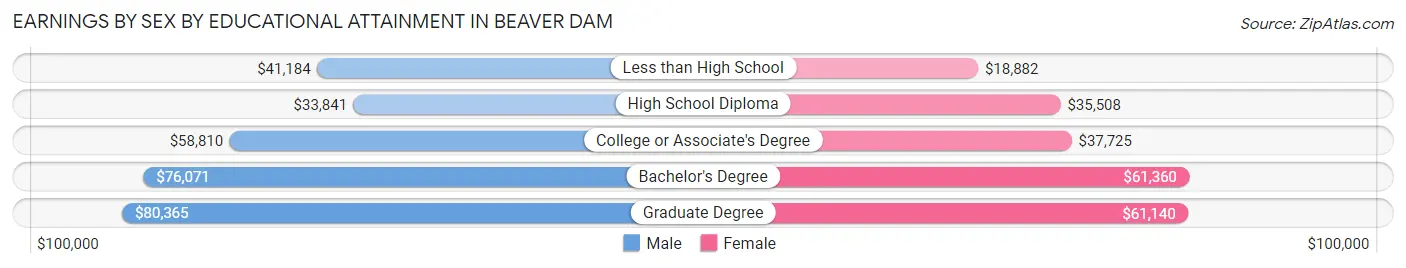
Earnings by Sex by Educational Attainment in Beaver Dam
Average earnings in Beaver Dam are $52,864 for men and $40,737 for women, a difference of 22.9%. Men with an educational attainment of graduate degree enjoy the highest average annual earnings of $80,365, while those with high school diploma education earn the least with $33,841. Women with an educational attainment of bachelor's degree earn the most with the average annual earnings of $61,360, while those with less than high school education have the smallest earnings of $18,882.
| Educational Attainment | Male Income | Female Income |
| Less than High School | $41,184 | $18,882 |
| High School Diploma | $33,841 | $35,508 |
| College or Associate's Degree | $58,810 | $37,725 |
| Bachelor's Degree | $76,071 | $61,360 |
| Graduate Degree | $80,365 | $61,140 |
| Total | $52,864 | $40,737 |
Family Income in Beaver Dam
Family Income Brackets in Beaver Dam
According to the Beaver Dam family income data, there are 1,011 families falling into the $100,000 to $149,999 income range, which is the most common income bracket and makes up 26.1% of all families. Conversely, the less than $10,000 income bracket is the least frequent group with only 12 families (0.3%) belonging to this category.
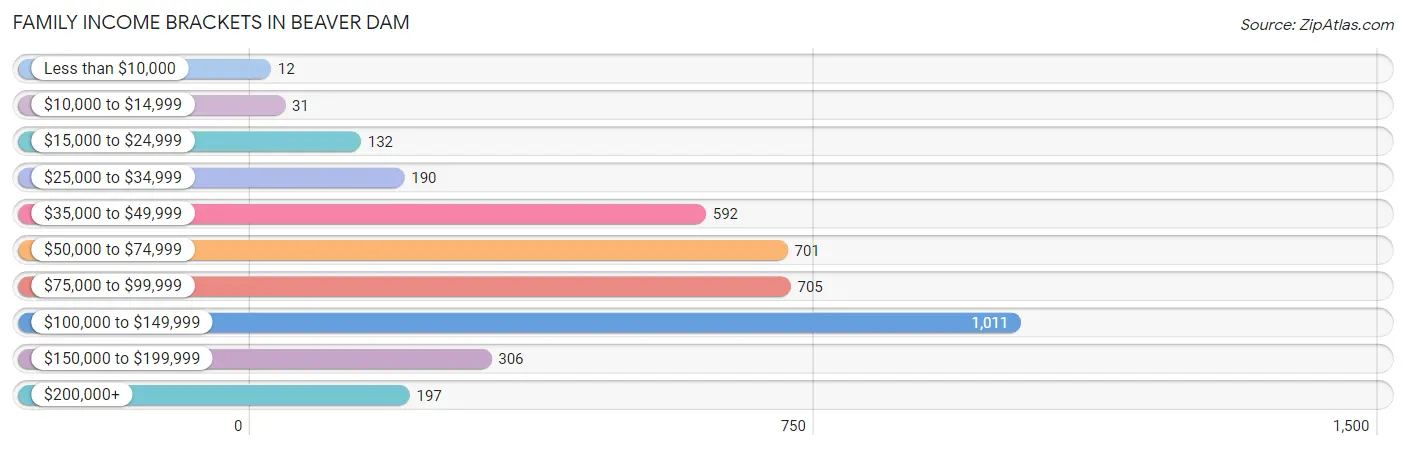
| Income Bracket | # Families | % Families |
| Less than $10,000 | 12 | 0.3% |
| $10,000 to $14,999 | 31 | 0.8% |
| $15,000 to $24,999 | 132 | 3.4% |
| $25,000 to $34,999 | 190 | 4.9% |
| $35,000 to $49,999 | 592 | 15.3% |
| $50,000 to $74,999 | 701 | 18.1% |
| $75,000 to $99,999 | 705 | 18.2% |
| $100,000 to $149,999 | 1,011 | 26.1% |
| $150,000 to $199,999 | 306 | 7.9% |
| $200,000+ | 197 | 5.1% |
Family Income by Famaliy Size in Beaver Dam
6-person families (89 | 2.3%) account for the highest median family income in Beaver Dam with $205,160 per family, while 2-person families (1,889 | 48.8%) have the highest median income of $39,590 per family member.
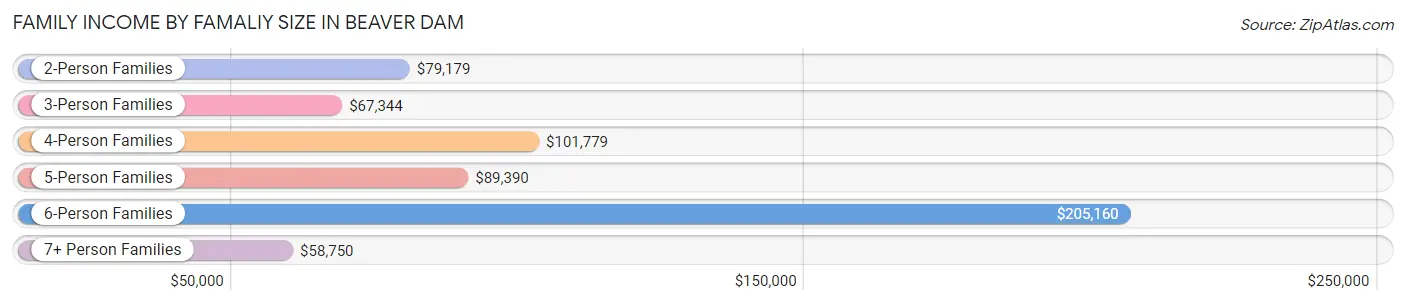
| Income Bracket | # Families | Median Income |
| 2-Person Families | 1,889 (48.8%) | $79,179 |
| 3-Person Families | 813 (21.0%) | $67,344 |
| 4-Person Families | 766 (19.8%) | $101,779 |
| 5-Person Families | 281 (7.3%) | $89,390 |
| 6-Person Families | 89 (2.3%) | $205,160 |
| 7+ Person Families | 34 (0.9%) | $58,750 |
| Total | 3,872 (100.0%) | $85,336 |
Family Income by Number of Earners in Beaver Dam
The median family income in Beaver Dam is $85,336, with families comprising 3+ earners (492) having the highest median family income of $146,250, while families with 1 earner (1,163) have the lowest median family income of $55,536, accounting for 12.7% and 30.0% of families, respectively.
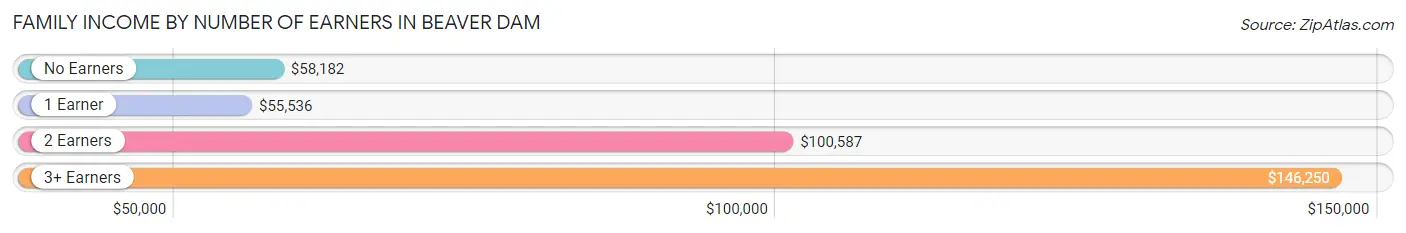
| Number of Earners | # Families | Median Income |
| No Earners | 420 (10.8%) | $58,182 |
| 1 Earner | 1,163 (30.0%) | $55,536 |
| 2 Earners | 1,797 (46.4%) | $100,587 |
| 3+ Earners | 492 (12.7%) | $146,250 |
| Total | 3,872 (100.0%) | $85,336 |
Household Income in Beaver Dam
Household Income Brackets in Beaver Dam
With 1,852 households falling in the category, the $50,000 to $74,999 income range is the most frequent in Beaver Dam, accounting for 23.9% of all households. In contrast, only 132 households (1.7%) fall into the $10,000 to $14,999 income bracket, making it the least populous group.
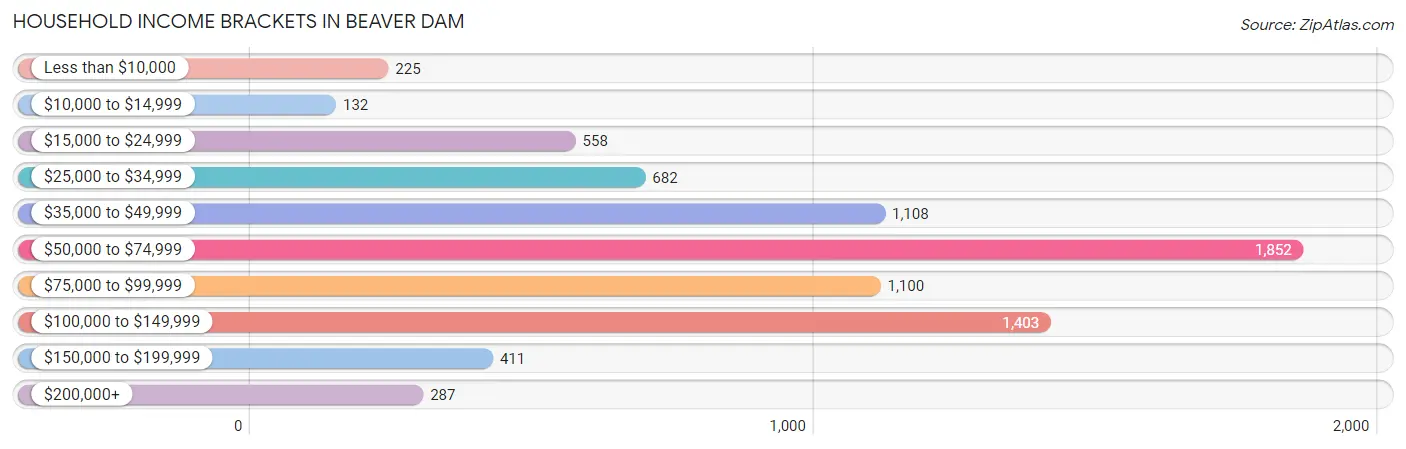
| Income Bracket | # Households | % Households |
| Less than $10,000 | 225 | 2.9% |
| $10,000 to $14,999 | 132 | 1.7% |
| $15,000 to $24,999 | 558 | 7.2% |
| $25,000 to $34,999 | 682 | 8.8% |
| $35,000 to $49,999 | 1,108 | 14.3% |
| $50,000 to $74,999 | 1,852 | 23.9% |
| $75,000 to $99,999 | 1,100 | 14.2% |
| $100,000 to $149,999 | 1,403 | 18.1% |
| $150,000 to $199,999 | 411 | 5.3% |
| $200,000+ | 287 | 3.7% |
Household Income by Householder Age in Beaver Dam
The median household income in Beaver Dam is $65,802, with the highest median household income of $79,362 found in the 45 to 64 years age bracket for the primary householder. A total of 2,940 households (37.9%) fall into this category. Meanwhile, the 65+ years age bracket for the primary householder has the lowest median household income of $43,229, with 1,891 households (24.4%) in this group.
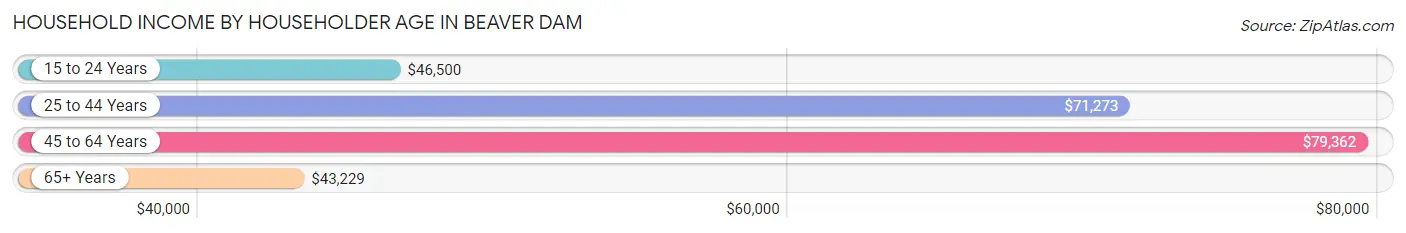
| Income Bracket | # Households | Median Income |
| 15 to 24 Years | 290 (3.7%) | $46,500 |
| 25 to 44 Years | 2,629 (33.9%) | $71,273 |
| 45 to 64 Years | 2,940 (37.9%) | $79,362 |
| 65+ Years | 1,891 (24.4%) | $43,229 |
| Total | 7,750 (100.0%) | $65,802 |
Poverty in Beaver Dam
Income Below Poverty by Sex and Age in Beaver Dam
With 5.7% poverty level for males and 5.6% for females among the residents of Beaver Dam, 6 to 11 year old males and 75 year old and over females are the most vulnerable to poverty, with 94 males (17.2%) and 111 females (15.0%) in their respective age groups living below the poverty level.
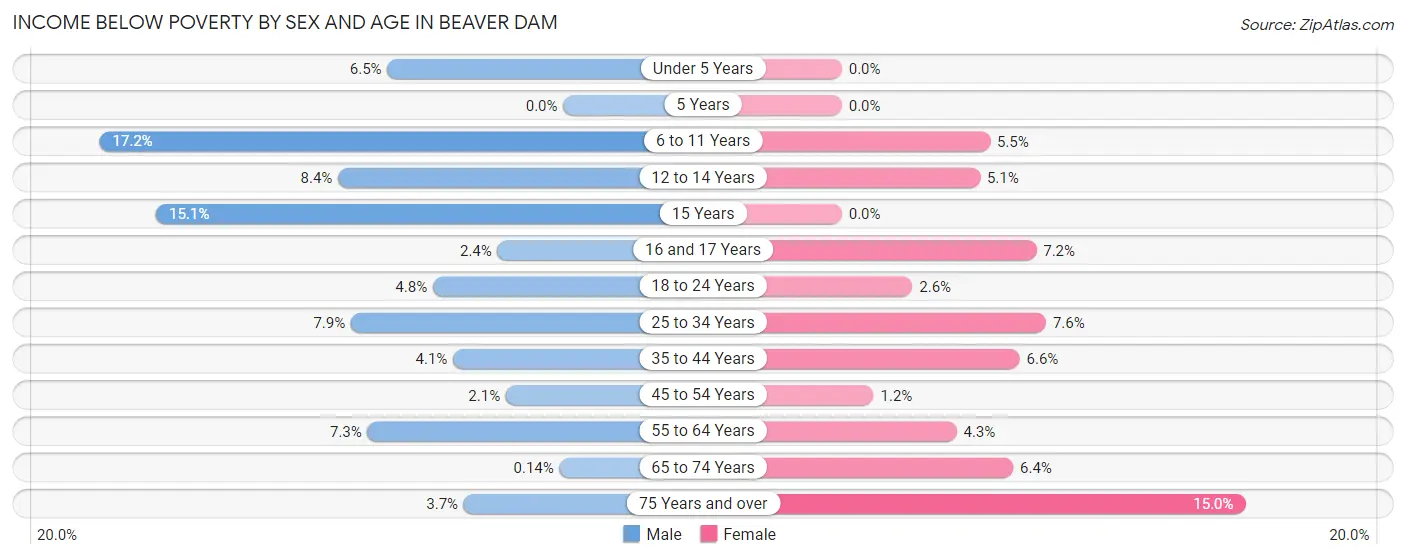
| Age Bracket | Male | Female |
| Under 5 Years | 22 (6.5%) | 0 (0.0%) |
| 5 Years | 0 (0.0%) | 0 (0.0%) |
| 6 to 11 Years | 94 (17.2%) | 24 (5.5%) |
| 12 to 14 Years | 29 (8.4%) | 16 (5.1%) |
| 15 Years | 26 (15.1%) | 0 (0.0%) |
| 16 and 17 Years | 6 (2.4%) | 13 (7.2%) |
| 18 to 24 Years | 45 (4.8%) | 9 (2.6%) |
| 25 to 34 Years | 101 (7.9%) | 81 (7.6%) |
| 35 to 44 Years | 56 (4.1%) | 60 (6.6%) |
| 45 to 54 Years | 25 (2.1%) | 12 (1.2%) |
| 55 to 64 Years | 84 (7.3%) | 50 (4.3%) |
| 65 to 74 Years | 1 (0.1%) | 53 (6.4%) |
| 75 Years and over | 13 (3.7%) | 111 (15.0%) |
| Total | 502 (5.7%) | 429 (5.6%) |
Income Above Poverty by Sex and Age in Beaver Dam
According to the poverty statistics in Beaver Dam, males aged 5 years and females aged under 5 years are the age groups that are most secure financially, with 100.0% of males and 100.0% of females in these age groups living above the poverty line.
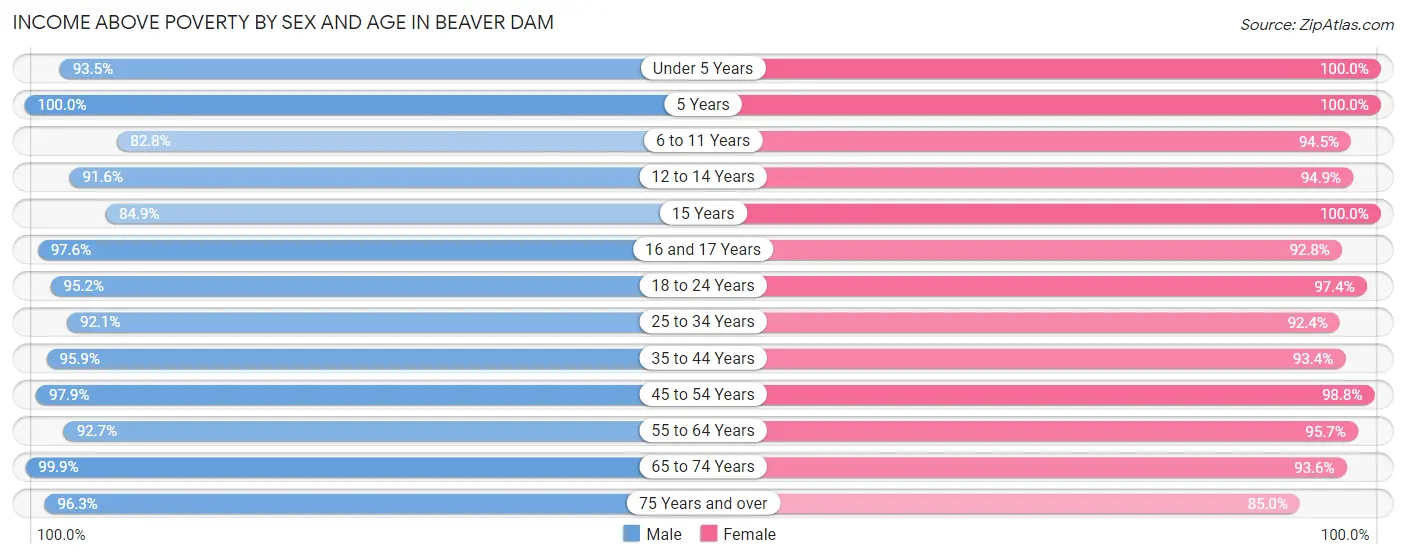
| Age Bracket | Male | Female |
| Under 5 Years | 315 (93.5%) | 425 (100.0%) |
| 5 Years | 158 (100.0%) | 100 (100.0%) |
| 6 to 11 Years | 452 (82.8%) | 412 (94.5%) |
| 12 to 14 Years | 318 (91.6%) | 296 (94.9%) |
| 15 Years | 146 (84.9%) | 70 (100.0%) |
| 16 and 17 Years | 240 (97.6%) | 167 (92.8%) |
| 18 to 24 Years | 885 (95.2%) | 335 (97.4%) |
| 25 to 34 Years | 1,181 (92.1%) | 988 (92.4%) |
| 35 to 44 Years | 1,312 (95.9%) | 849 (93.4%) |
| 45 to 54 Years | 1,148 (97.9%) | 1,002 (98.8%) |
| 55 to 64 Years | 1,071 (92.7%) | 1,123 (95.7%) |
| 65 to 74 Years | 722 (99.9%) | 780 (93.6%) |
| 75 Years and over | 339 (96.3%) | 630 (85.0%) |
| Total | 8,287 (94.3%) | 7,177 (94.4%) |
Income Below Poverty Among Married-Couple Families in Beaver Dam
The poverty statistics for married-couple families in Beaver Dam show that 1.9% or 54 of the total 2,822 families live below the poverty line. Families with 1 or 2 children have the highest poverty rate of 3.6%, comprising of 40 families. On the other hand, families with 3 or 4 children have the lowest poverty rate of 0.0%, which includes 0 families.
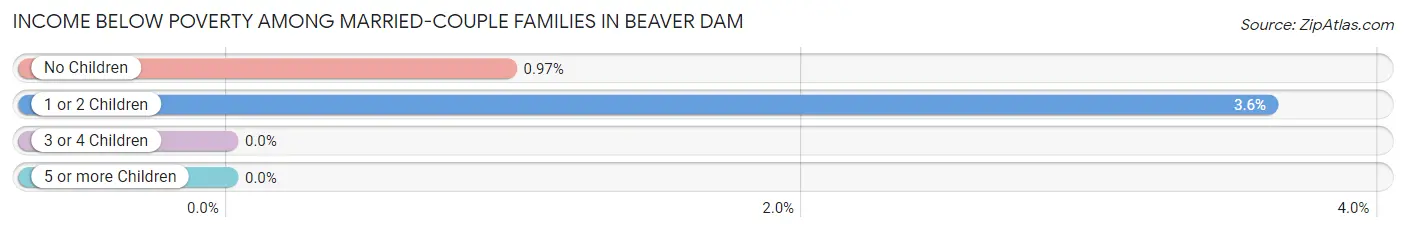
| Children | Above Poverty | Below Poverty |
| No Children | 1,428 (99.0%) | 14 (1.0%) |
| 1 or 2 Children | 1,066 (96.4%) | 40 (3.6%) |
| 3 or 4 Children | 240 (100.0%) | 0 (0.0%) |
| 5 or more Children | 34 (100.0%) | 0 (0.0%) |
| Total | 2,768 (98.1%) | 54 (1.9%) |
Income Below Poverty Among Single-Parent Households in Beaver Dam
According to the poverty data in Beaver Dam, 16.6% or 38 single-father households and 5.6% or 46 single-mother households are living below the poverty line. Among single-father households, those with 1 or 2 children have the highest poverty rate, with 38 households (24.2%) experiencing poverty. Likewise, among single-mother households, those with 3 or 4 children have the highest poverty rate, with 8 households (9.3%) falling below the poverty line.
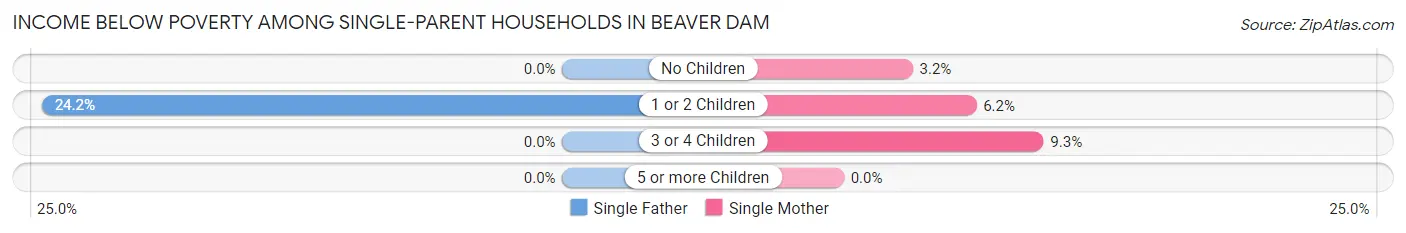
| Children | Single Father | Single Mother |
| No Children | 0 (0.0%) | 8 (3.2%) |
| 1 or 2 Children | 38 (24.2%) | 30 (6.2%) |
| 3 or 4 Children | 0 (0.0%) | 8 (9.3%) |
| 5 or more Children | 0 (0.0%) | 0 (0.0%) |
| Total | 38 (16.6%) | 46 (5.6%) |
Income Below Poverty Among Married-Couple vs Single-Parent Households in Beaver Dam
The poverty data for Beaver Dam shows that 54 of the married-couple family households (1.9%) and 84 of the single-parent households (8.0%) are living below the poverty level. Within the married-couple family households, those with 1 or 2 children have the highest poverty rate, with 40 households (3.6%) falling below the poverty line. Among the single-parent households, those with 1 or 2 children have the highest poverty rate, with 68 household (10.6%) living below poverty.
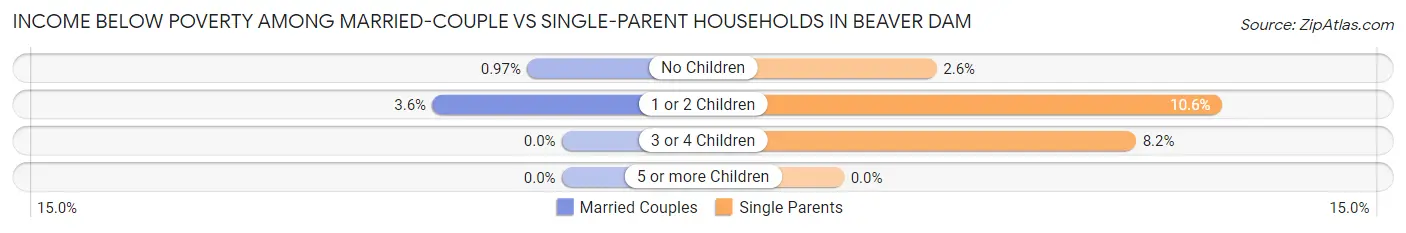
| Children | Married-Couple Families | Single-Parent Households |
| No Children | 14 (1.0%) | 8 (2.6%) |
| 1 or 2 Children | 40 (3.6%) | 68 (10.6%) |
| 3 or 4 Children | 0 (0.0%) | 8 (8.2%) |
| 5 or more Children | 0 (0.0%) | 0 (0.0%) |
| Total | 54 (1.9%) | 84 (8.0%) |
Race in Beaver Dam
The most populous races in Beaver Dam are White / Caucasian (14,410 | 86.5%), Hispanic or Latino (1,382 | 8.3%), and Two or more Races (1,007 | 6.0%).
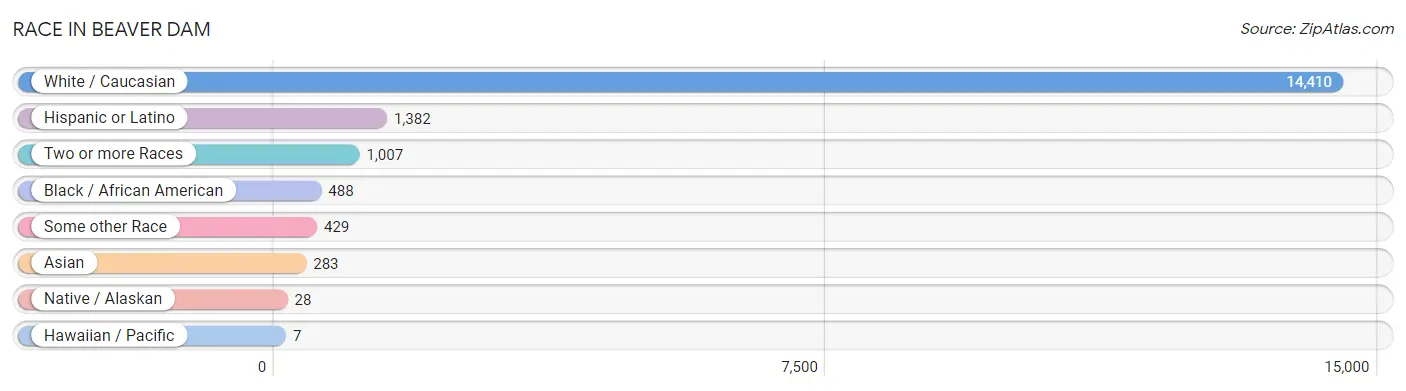
| Race | # Population | % Population |
| Asian | 283 | 1.7% |
| Black / African American | 488 | 2.9% |
| Hawaiian / Pacific | 7 | 0.0% |
| Hispanic or Latino | 1,382 | 8.3% |
| Native / Alaskan | 28 | 0.2% |
| White / Caucasian | 14,410 | 86.5% |
| Two or more Races | 1,007 | 6.0% |
| Some other Race | 429 | 2.6% |
| Total | 16,652 | 100.0% |
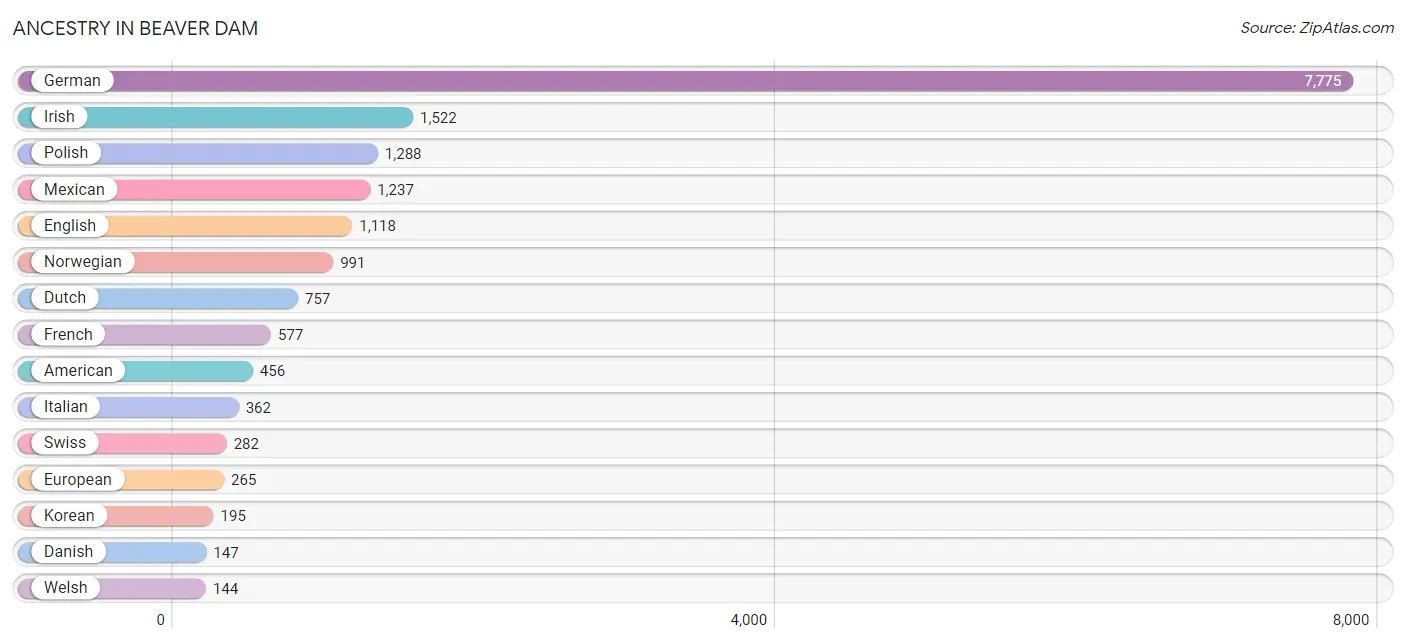
Ancestry in Beaver Dam
The most populous ancestries reported in Beaver Dam are German (7,775 | 46.7%), Irish (1,522 | 9.1%), Polish (1,288 | 7.7%), Mexican (1,237 | 7.4%), and English (1,118 | 6.7%), together accounting for 77.7% of all Beaver Dam residents.
| Ancestry | # Population | % Population |
| African | 20 | 0.1% |
| American | 456 | 2.7% |
| Austrian | 15 | 0.1% |
| Belgian | 35 | 0.2% |
| Bhutanese | 35 | 0.2% |
| British | 22 | 0.1% |
| Burmese | 67 | 0.4% |
| Cambodian | 28 | 0.2% |
| Central American | 24 | 0.1% |
| Cherokee | 75 | 0.4% |
| Chippewa | 11 | 0.1% |
| Choctaw | 17 | 0.1% |
| Colombian | 53 | 0.3% |
| Croatian | 71 | 0.4% |
| Cuban | 11 | 0.1% |
| Czech | 136 | 0.8% |
| Czechoslovakian | 18 | 0.1% |
| Danish | 147 | 0.9% |
| Dutch | 757 | 4.5% |
| Eastern European | 105 | 0.6% |
| Ecuadorian | 4 | 0.0% |
| English | 1,118 | 6.7% |
| Ethiopian | 1 | 0.0% |
| European | 265 | 1.6% |
| Finnish | 96 | 0.6% |
| French | 577 | 3.5% |
| French Canadian | 73 | 0.4% |
| German | 7,775 | 46.7% |
| German Russian | 17 | 0.1% |
| Ghanaian | 20 | 0.1% |
| Hungarian | 78 | 0.5% |
| Indian (Asian) | 18 | 0.1% |
| Irish | 1,522 | 9.1% |
| Italian | 362 | 2.2% |
| Korean | 195 | 1.2% |
| Laotian | 15 | 0.1% |
| Lithuanian | 12 | 0.1% |
| Luxembourger | 28 | 0.2% |
| Mexican | 1,237 | 7.4% |
| Native Hawaiian | 7 | 0.0% |
| Nicaraguan | 24 | 0.1% |
| Northern European | 40 | 0.2% |
| Norwegian | 991 | 5.9% |
| Polish | 1,288 | 7.7% |
| Portuguese | 11 | 0.1% |
| Puerto Rican | 53 | 0.3% |
| Russian | 57 | 0.3% |
| Scandinavian | 74 | 0.4% |
| Scotch-Irish | 44 | 0.3% |
| Scottish | 106 | 0.6% |
| Sioux | 6 | 0.0% |
| Slovak | 20 | 0.1% |
| Slovene | 10 | 0.1% |
| South American | 57 | 0.3% |
| Subsaharan African | 41 | 0.3% |
| Swedish | 68 | 0.4% |
| Swiss | 282 | 1.7% |
| Thai | 57 | 0.3% |
| Welsh | 144 | 0.9% | View All 59 Rows |
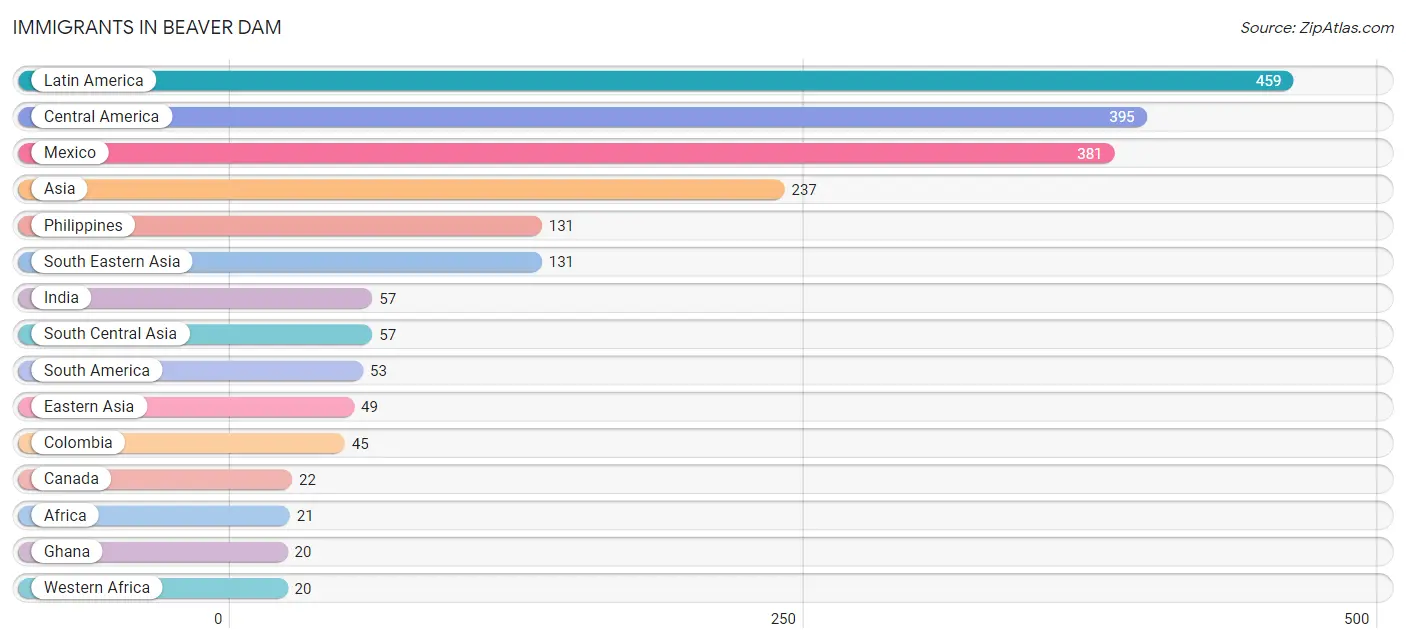
Immigrants in Beaver Dam
The most numerous immigrant groups reported in Beaver Dam came from Latin America (459 | 2.8%), Central America (395 | 2.4%), Mexico (381 | 2.3%), Asia (237 | 1.4%), and Philippines (131 | 0.8%), together accounting for 9.6% of all Beaver Dam residents.
| Immigration Origin | # Population | % Population |
| Africa | 21 | 0.1% |
| Asia | 237 | 1.4% |
| Canada | 22 | 0.1% |
| Caribbean | 11 | 0.1% |
| Central America | 395 | 2.4% |
| China | 18 | 0.1% |
| Colombia | 45 | 0.3% |
| Cuba | 11 | 0.1% |
| Eastern Africa | 1 | 0.0% |
| Eastern Asia | 49 | 0.3% |
| Ecuador | 8 | 0.1% |
| England | 7 | 0.0% |
| Ethiopia | 1 | 0.0% |
| Europe | 16 | 0.1% |
| Ghana | 20 | 0.1% |
| India | 57 | 0.3% |
| Korea | 3 | 0.0% |
| Latin America | 459 | 2.8% |
| Mexico | 381 | 2.3% |
| Nicaragua | 14 | 0.1% |
| Northern Europe | 16 | 0.1% |
| Philippines | 131 | 0.8% |
| South America | 53 | 0.3% |
| South Central Asia | 57 | 0.3% |
| South Eastern Asia | 131 | 0.8% |
| Western Africa | 20 | 0.1% | View All 26 Rows |
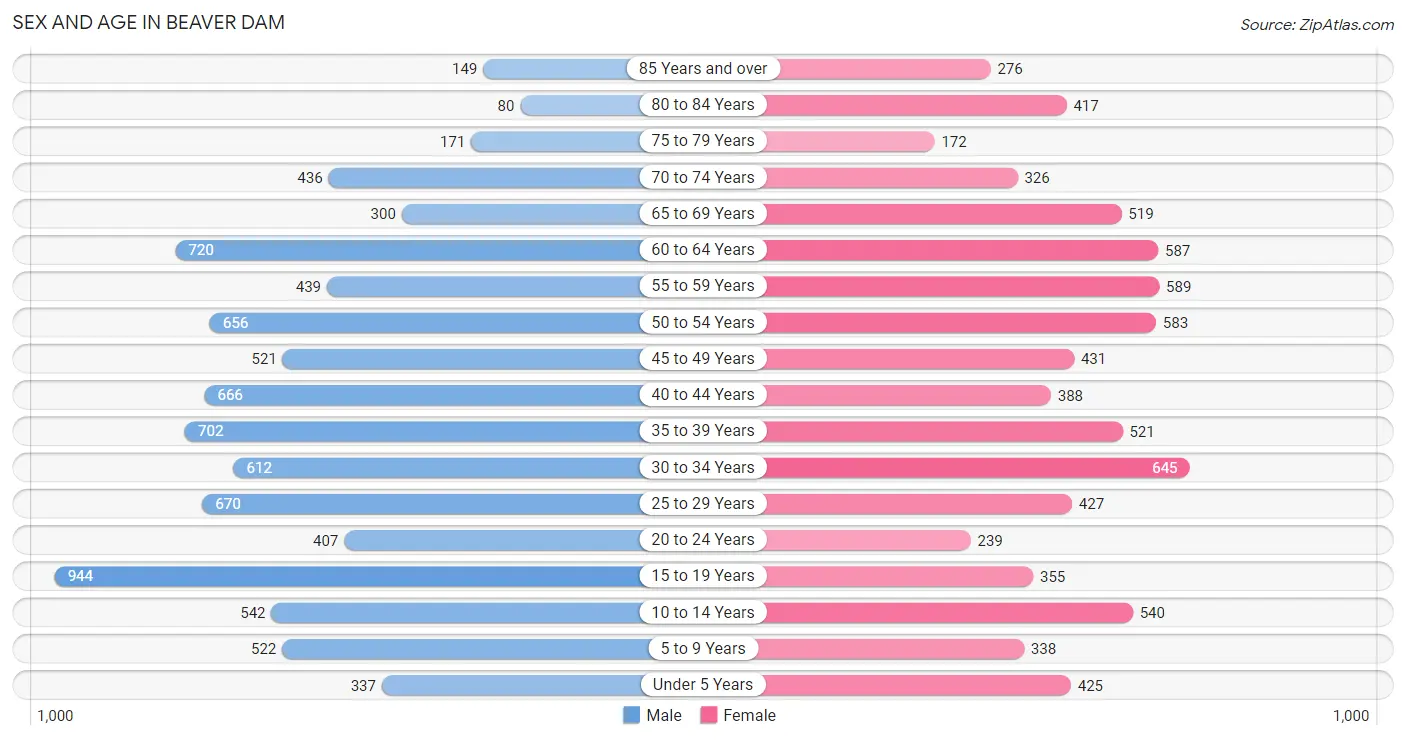
Sex and Age in Beaver Dam
Sex and Age in Beaver Dam
The most populous age groups in Beaver Dam are 15 to 19 Years (944 | 10.6%) for men and 30 to 34 Years (645 | 8.3%) for women.
| Age Bracket | Male | Female |
| Under 5 Years | 337 (3.8%) | 425 (5.5%) |
| 5 to 9 Years | 522 (5.9%) | 338 (4.3%) |
| 10 to 14 Years | 542 (6.1%) | 540 (6.9%) |
| 15 to 19 Years | 944 (10.6%) | 355 (4.6%) |
| 20 to 24 Years | 407 (4.6%) | 239 (3.1%) |
| 25 to 29 Years | 670 (7.5%) | 427 (5.5%) |
| 30 to 34 Years | 612 (6.9%) | 645 (8.3%) |
| 35 to 39 Years | 702 (7.9%) | 521 (6.7%) |
| 40 to 44 Years | 666 (7.5%) | 388 (5.0%) |
| 45 to 49 Years | 521 (5.9%) | 431 (5.5%) |
| 50 to 54 Years | 656 (7.4%) | 583 (7.5%) |
| 55 to 59 Years | 439 (5.0%) | 589 (7.6%) |
| 60 to 64 Years | 720 (8.1%) | 587 (7.5%) |
| 65 to 69 Years | 300 (3.4%) | 519 (6.7%) |
| 70 to 74 Years | 436 (4.9%) | 326 (4.2%) |
| 75 to 79 Years | 171 (1.9%) | 172 (2.2%) |
| 80 to 84 Years | 80 (0.9%) | 417 (5.4%) |
| 85 Years and over | 149 (1.7%) | 276 (3.5%) |
| Total | 8,874 (100.0%) | 7,778 (100.0%) |
Families and Households in Beaver Dam
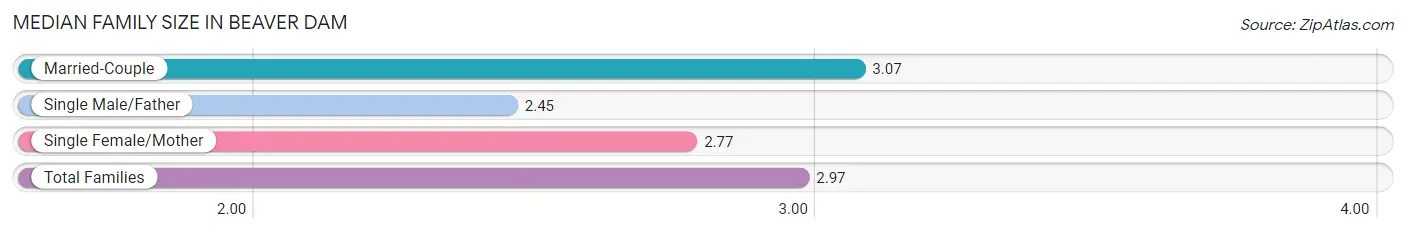
Median Family Size in Beaver Dam
The median family size in Beaver Dam is 2.97 persons per family, with married-couple families (2,822 | 72.9%) accounting for the largest median family size of 3.07 persons per family. On the other hand, single male/father families (229 | 5.9%) represent the smallest median family size with 2.45 persons per family.
| Family Type | # Families | Family Size |
| Married-Couple | 2,822 (72.9%) | 3.07 |
| Single Male/Father | 229 (5.9%) | 2.45 |
| Single Female/Mother | 821 (21.2%) | 2.77 |
| Total Families | 3,872 (100.0%) | 2.97 |
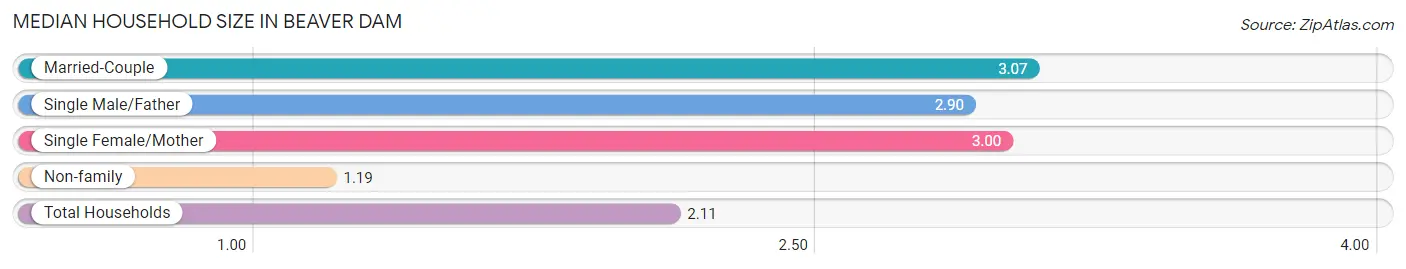
Median Household Size in Beaver Dam
The median household size in Beaver Dam is 2.11 persons per household, with married-couple households (2,822 | 36.4%) accounting for the largest median household size of 3.07 persons per household. non-family households (3,878 | 50.0%) represent the smallest median household size with 1.19 persons per household.
| Household Type | # Households | Household Size |
| Married-Couple | 2,822 (36.4%) | 3.07 |
| Single Male/Father | 229 (2.9%) | 2.90 |
| Single Female/Mother | 821 (10.6%) | 3.00 |
| Non-family | 3,878 (50.0%) | 1.19 |
| Total Households | 7,750 (100.0%) | 2.11 |
Household Size by Marriage Status in Beaver Dam
Out of a total of 7,750 households in Beaver Dam, 3,872 (50.0%) are family households, while 3,878 (50.0%) are nonfamily households. The most numerous type of family households are 2-person households, comprising 1,728, and the most common type of nonfamily households are 1-person households, comprising 3,293.
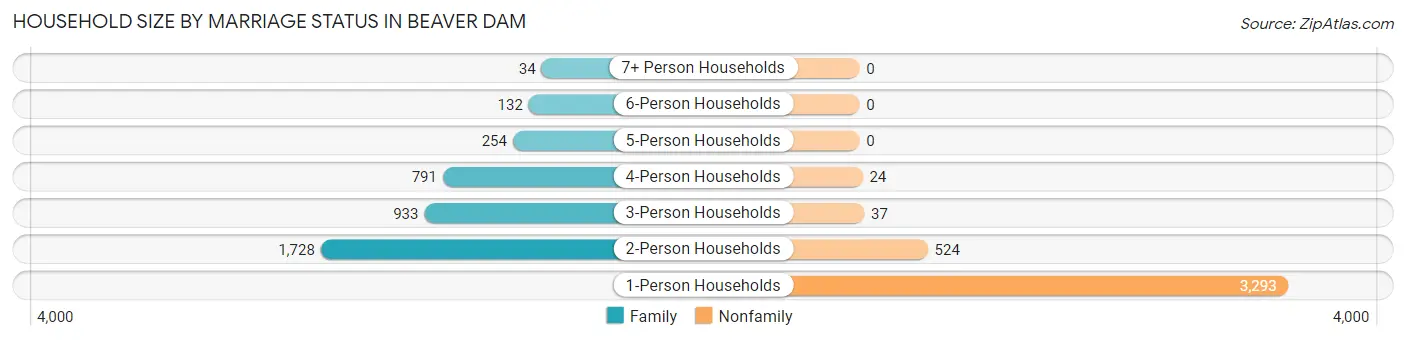
| Household Size | Family Households | Nonfamily Households |
| 1-Person Households | - | 3,293 (42.5%) |
| 2-Person Households | 1,728 (22.3%) | 524 (6.8%) |
| 3-Person Households | 933 (12.0%) | 37 (0.5%) |
| 4-Person Households | 791 (10.2%) | 24 (0.3%) |
| 5-Person Households | 254 (3.3%) | 0 (0.0%) |
| 6-Person Households | 132 (1.7%) | 0 (0.0%) |
| 7+ Person Households | 34 (0.4%) | 0 (0.0%) |
| Total | 3,872 (50.0%) | 3,878 (50.0%) |
Female Fertility in Beaver Dam
Fertility by Age in Beaver Dam
Average fertility rate in Beaver Dam is 44.0 births per 1,000 women. Women in the age bracket of 20 to 34 years have the highest fertility rate with 68.0 births per 1,000 women. Women in the age bracket of 20 to 34 years acount for 64.0% of all women with births.
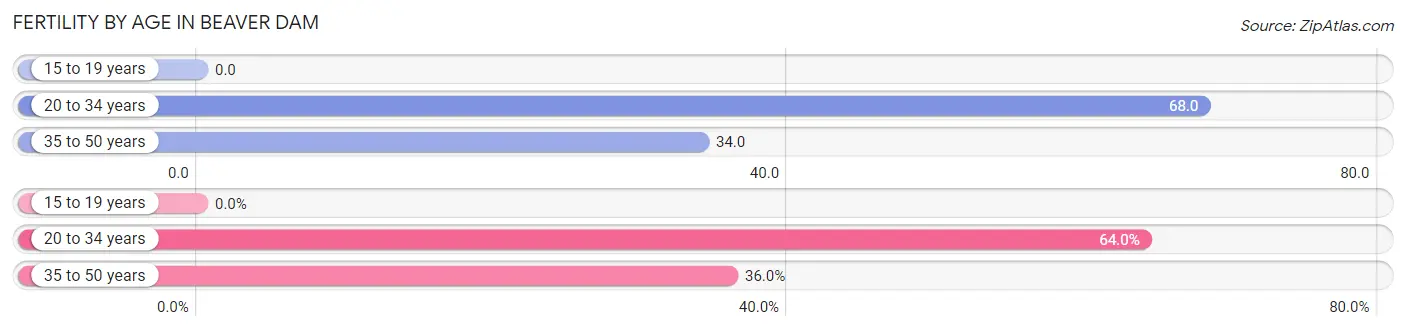
| Age Bracket | Women with Births | Births / 1,000 Women |
| 15 to 19 years | 0 (0.0%) | 0.0 |
| 20 to 34 years | 89 (64.0%) | 68.0 |
| 35 to 50 years | 50 (36.0%) | 34.0 |
| Total | 139 (100.0%) | 44.0 |
Fertility by Age by Marriage Status in Beaver Dam
62.6% of women with births (139) in Beaver Dam are married. The highest percentage of unmarried women with births falls into 20 to 34 years age bracket with 58.4% of them unmarried at the time of birth, while the lowest percentage of unmarried women with births belong to 35 to 50 years age bracket with 0.0% of them unmarried.
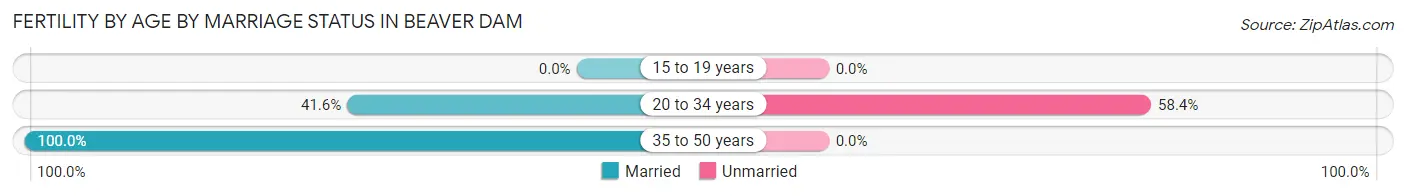
| Age Bracket | Married | Unmarried |
| 15 to 19 years | 0 (0.0%) | 0 (0.0%) |
| 20 to 34 years | 37 (41.6%) | 52 (58.4%) |
| 35 to 50 years | 50 (100.0%) | 0 (0.0%) |
| Total | 87 (62.6%) | 52 (37.4%) |
Fertility by Education in Beaver Dam
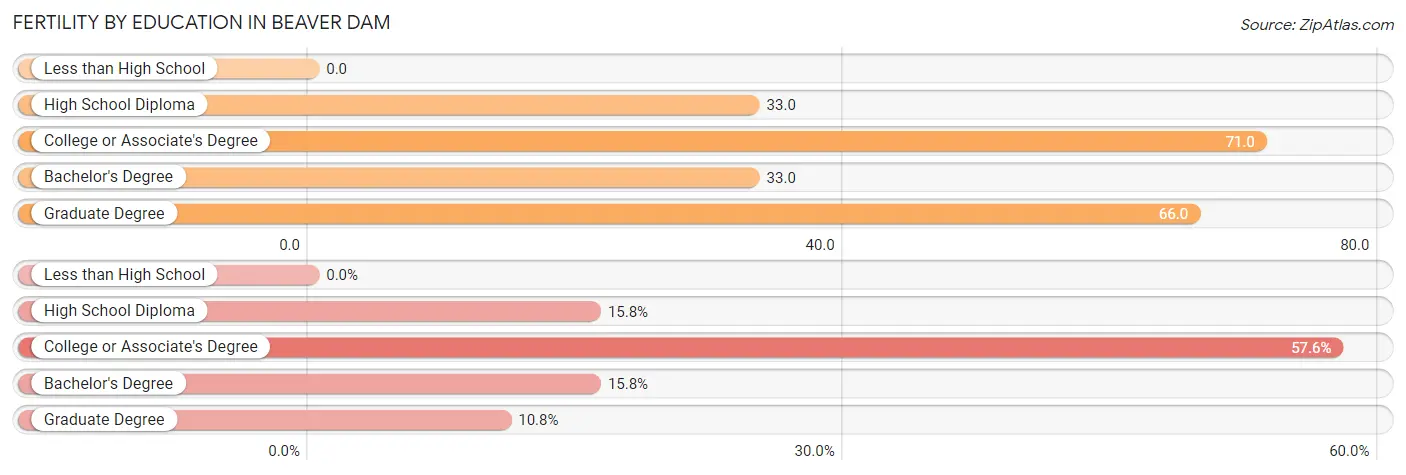
| Educational Attainment | Women with Births | Births / 1,000 Women |
| Less than High School | 0 (0.0%) | 0.0 |
| High School Diploma | 22 (15.8%) | 33.0 |
| College or Associate's Degree | 80 (57.6%) | 71.0 |
| Bachelor's Degree | 22 (15.8%) | 33.0 |
| Graduate Degree | 15 (10.8%) | 66.0 |
| Total | 139 (100.0%) | 44.0 |
Fertility by Education by Marriage Status in Beaver Dam
37.4% of women with births in Beaver Dam are unmarried. Women with the educational attainment of high school diploma are most likely to be married with 100.0% of them married at childbirth, while women with the educational attainment of college or associate's degree are least likely to be married with 65.0% of them unmarried at childbirth.
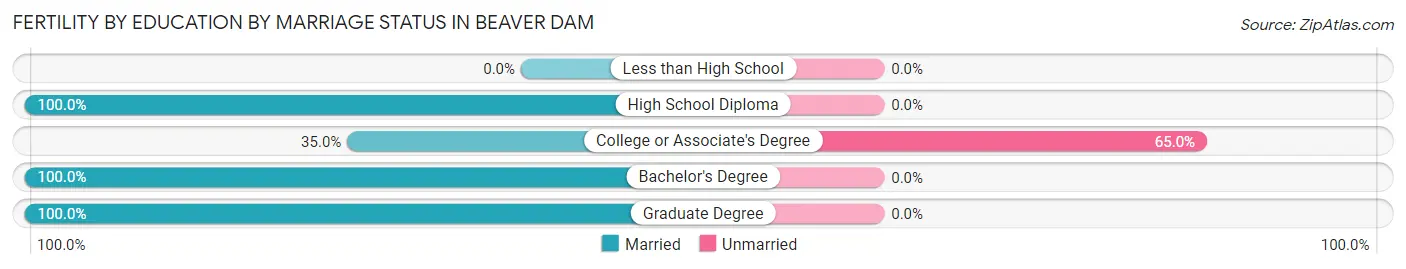
| Educational Attainment | Married | Unmarried |
| Less than High School | 0 (0.0%) | 0 (0.0%) |
| High School Diploma | 22 (100.0%) | 0 (0.0%) |
| College or Associate's Degree | 28 (35.0%) | 52 (65.0%) |
| Bachelor's Degree | 22 (100.0%) | 0 (0.0%) |
| Graduate Degree | 15 (100.0%) | 0 (0.0%) |
| Total | 87 (62.6%) | 52 (37.4%) |
Employment Characteristics in Beaver Dam
Employment by Class of Employer in Beaver Dam
Among the 9,319 employed individuals in Beaver Dam, private company employees (6,619 | 71.0%), not-for-profit organizations (1,102 | 11.8%), and local government employees (777 | 8.3%) make up the most common classes of employment.
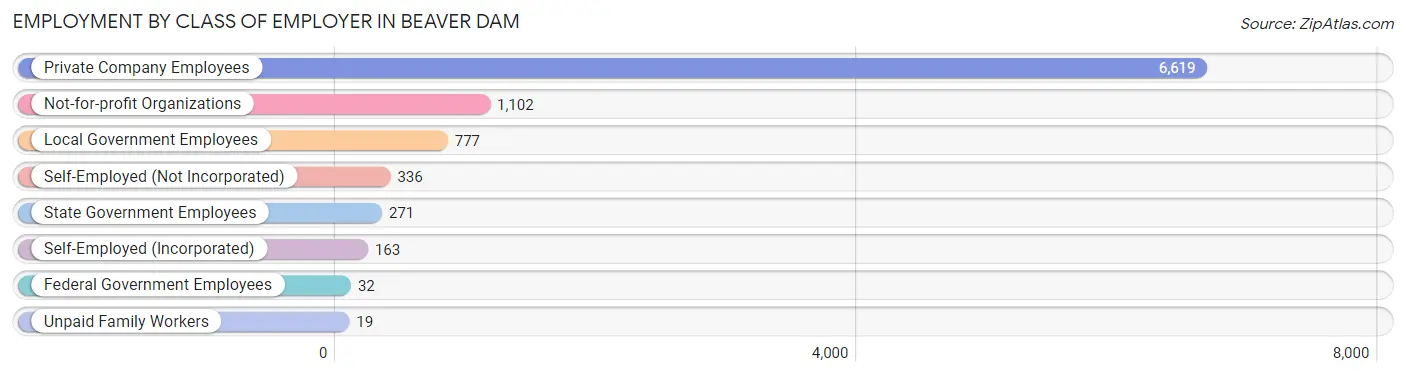
| Employer Class | # Employees | % Employees |
| Private Company Employees | 6,619 | 71.0% |
| Self-Employed (Incorporated) | 163 | 1.8% |
| Self-Employed (Not Incorporated) | 336 | 3.6% |
| Not-for-profit Organizations | 1,102 | 11.8% |
| Local Government Employees | 777 | 8.3% |
| State Government Employees | 271 | 2.9% |
| Federal Government Employees | 32 | 0.3% |
| Unpaid Family Workers | 19 | 0.2% |
| Total | 9,319 | 100.0% |
Employment Status by Age in Beaver Dam
According to the labor force statistics for Beaver Dam, out of the total population over 16 years of age (13,705), 72.2% or 9,895 individuals are in the labor force, with 4.3% or 425 of them unemployed. The age group with the highest labor force participation rate is 45 to 54 years, with 94.8% or 2,077 individuals in the labor force. Within the labor force, the 16 to 19 years age range has the highest percentage of unemployed individuals, with 32.6% or 270 of them being unemployed.
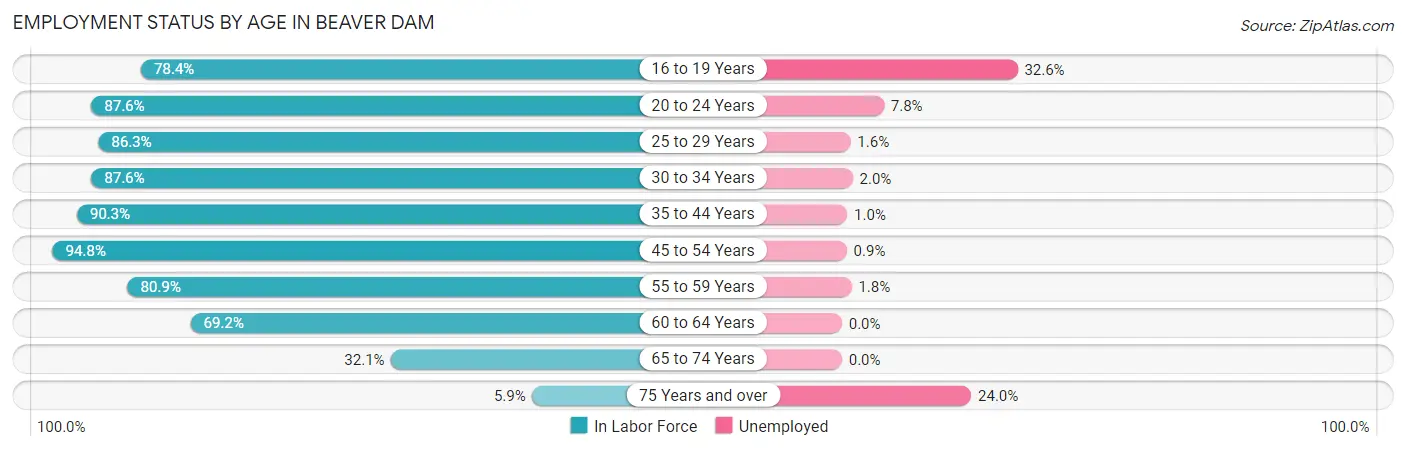
| Age Bracket | In Labor Force | Unemployed |
| 16 to 19 Years | 828 (78.4%) | 270 (32.6%) |
| 20 to 24 Years | 566 (87.6%) | 44 (7.8%) |
| 25 to 29 Years | 947 (86.3%) | 15 (1.6%) |
| 30 to 34 Years | 1,101 (87.6%) | 22 (2.0%) |
| 35 to 44 Years | 2,056 (90.3%) | 21 (1.0%) |
| 45 to 54 Years | 2,077 (94.8%) | 19 (0.9%) |
| 55 to 59 Years | 832 (80.9%) | 15 (1.8%) |
| 60 to 64 Years | 904 (69.2%) | 0 (0.0%) |
| 65 to 74 Years | 508 (32.1%) | 0 (0.0%) |
| 75 Years and over | 75 (5.9%) | 18 (24.0%) |
| Total | 9,895 (72.2%) | 425 (4.3%) |
Employment Status by Educational Attainment in Beaver Dam
According to labor force statistics for Beaver Dam, 86.5% of individuals (7,921) out of the total population between 25 and 64 years of age (9,157) are in the labor force, with 1.1% or 87 of them being unemployed. The group with the highest labor force participation rate are those with the educational attainment of college / associate degree, with 87.6% or 2,666 individuals in the labor force. Within the labor force, individuals with less than high school education have the highest percentage of unemployment, with 3.6% or 15 of them being unemployed.
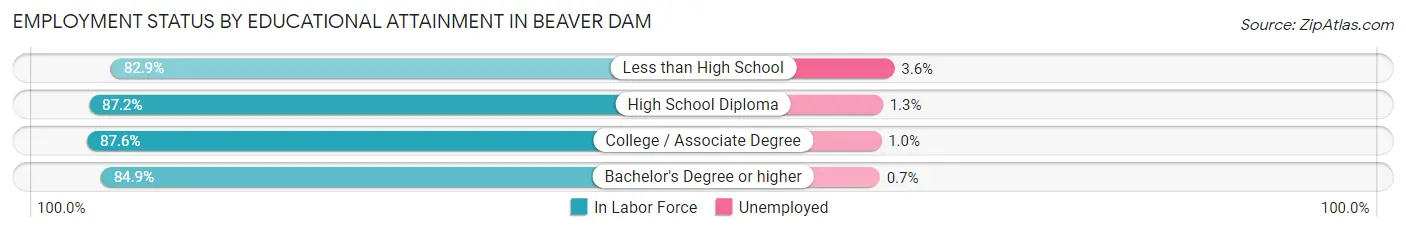
| Educational Attainment | In Labor Force | Unemployed |
| Less than High School | 416 (82.9%) | 18 (3.6%) |
| High School Diploma | 2,678 (87.2%) | 40 (1.3%) |
| College / Associate Degree | 2,666 (87.6%) | 30 (1.0%) |
| Bachelor's Degree or higher | 2,157 (84.9%) | 18 (0.7%) |
| Total | 7,921 (86.5%) | 101 (1.1%) |
Employment Occupations by Sex in Beaver Dam
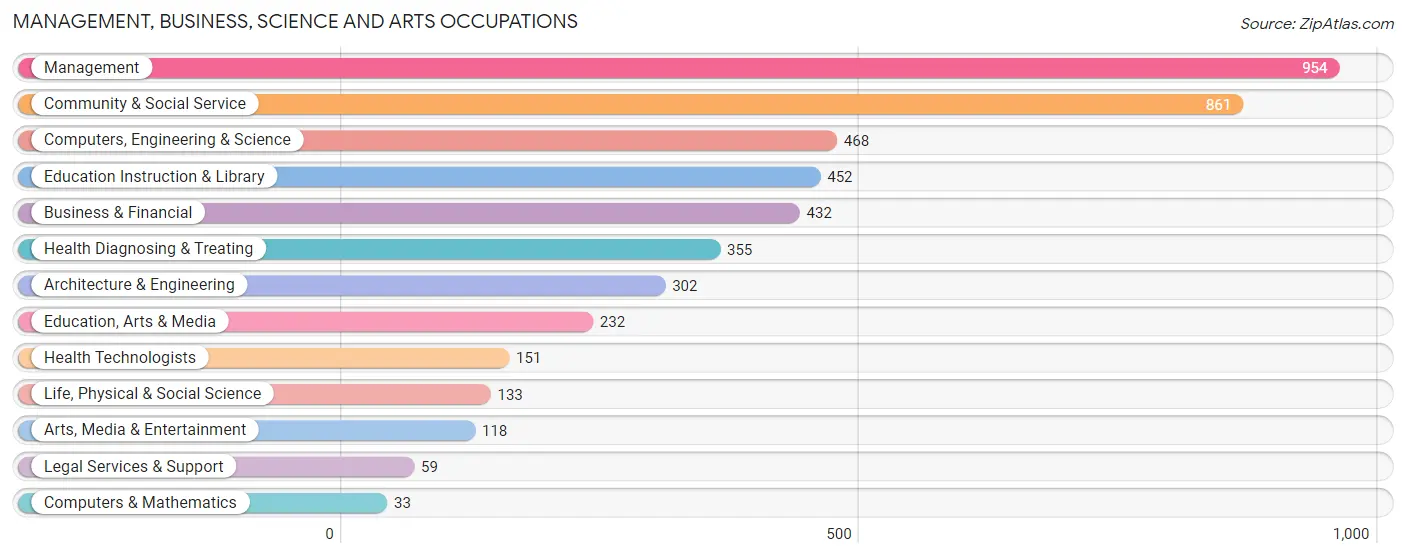
Management, Business, Science and Arts Occupations
The most common Management, Business, Science and Arts occupations in Beaver Dam are Management (954 | 10.1%), Community & Social Service (861 | 9.1%), Computers, Engineering & Science (468 | 4.9%), Education Instruction & Library (452 | 4.8%), and Business & Financial (432 | 4.6%).
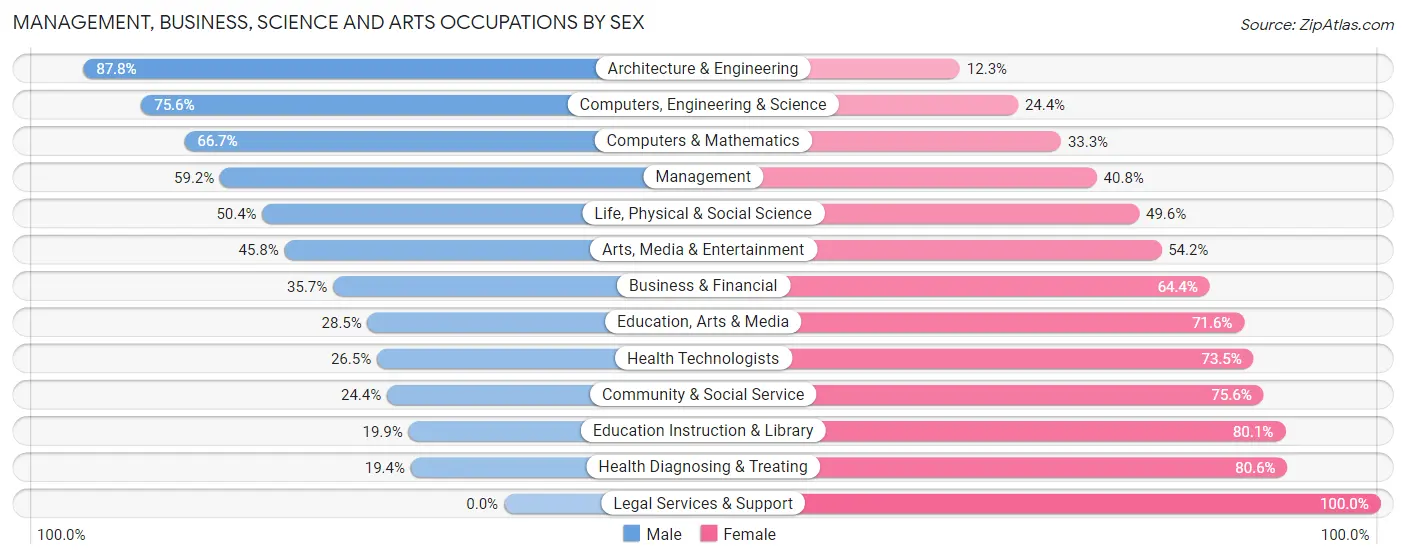
Management, Business, Science and Arts Occupations by Sex
Within the Management, Business, Science and Arts occupations in Beaver Dam, the most male-oriented occupations are Architecture & Engineering (87.7%), Computers, Engineering & Science (75.6%), and Computers & Mathematics (66.7%), while the most female-oriented occupations are Legal Services & Support (100.0%), Health Diagnosing & Treating (80.6%), and Education Instruction & Library (80.1%).
| Occupation | Male | Female |
| Management | 565 (59.2%) | 389 (40.8%) |
| Business & Financial | 154 (35.6%) | 278 (64.3%) |
| Computers, Engineering & Science | 354 (75.6%) | 114 (24.4%) |
| Computers & Mathematics | 22 (66.7%) | 11 (33.3%) |
| Architecture & Engineering | 265 (87.7%) | 37 (12.2%) |
| Life, Physical & Social Science | 67 (50.4%) | 66 (49.6%) |
| Community & Social Service | 210 (24.4%) | 651 (75.6%) |
| Education, Arts & Media | 66 (28.4%) | 166 (71.6%) |
| Legal Services & Support | 0 (0.0%) | 59 (100.0%) |
| Education Instruction & Library | 90 (19.9%) | 362 (80.1%) |
| Arts, Media & Entertainment | 54 (45.8%) | 64 (54.2%) |
| Health Diagnosing & Treating | 69 (19.4%) | 286 (80.6%) |
| Health Technologists | 40 (26.5%) | 111 (73.5%) |
| Total (Category) | 1,352 (44.0%) | 1,718 (56.0%) |
| Total (Overall) | 5,316 (56.1%) | 4,155 (43.9%) |
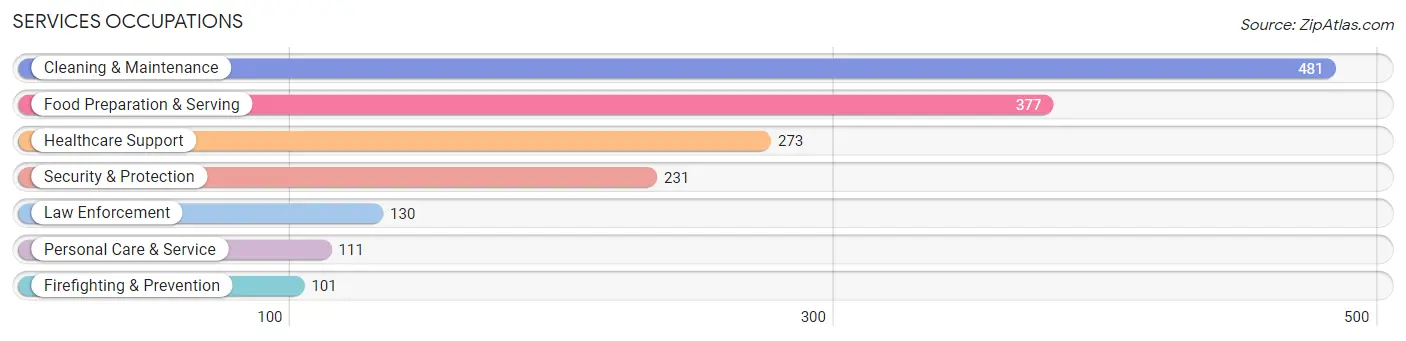
Services Occupations
The most common Services occupations in Beaver Dam are Cleaning & Maintenance (481 | 5.1%), Food Preparation & Serving (377 | 4.0%), Healthcare Support (273 | 2.9%), Security & Protection (231 | 2.4%), and Law Enforcement (130 | 1.4%).
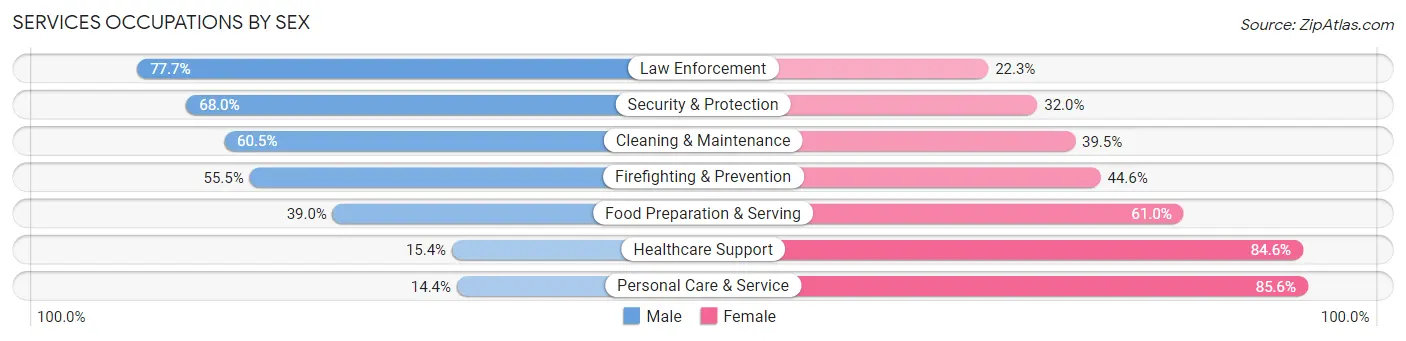
Services Occupations by Sex
Within the Services occupations in Beaver Dam, the most male-oriented occupations are Law Enforcement (77.7%), Security & Protection (68.0%), and Cleaning & Maintenance (60.5%), while the most female-oriented occupations are Personal Care & Service (85.6%), Healthcare Support (84.6%), and Food Preparation & Serving (61.0%).
| Occupation | Male | Female |
| Healthcare Support | 42 (15.4%) | 231 (84.6%) |
| Security & Protection | 157 (68.0%) | 74 (32.0%) |
| Firefighting & Prevention | 56 (55.4%) | 45 (44.6%) |
| Law Enforcement | 101 (77.7%) | 29 (22.3%) |
| Food Preparation & Serving | 147 (39.0%) | 230 (61.0%) |
| Cleaning & Maintenance | 291 (60.5%) | 190 (39.5%) |
| Personal Care & Service | 16 (14.4%) | 95 (85.6%) |
| Total (Category) | 653 (44.3%) | 820 (55.7%) |
| Total (Overall) | 5,316 (56.1%) | 4,155 (43.9%) |
Sales and Office Occupations
The most common Sales and Office occupations in Beaver Dam are Sales & Related (959 | 10.1%), and Office & Administration (756 | 8.0%).
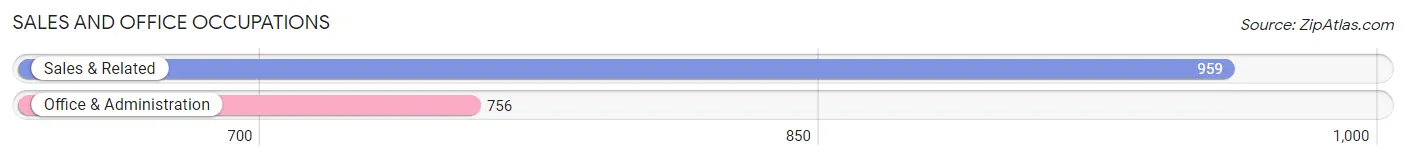
Sales and Office Occupations by Sex
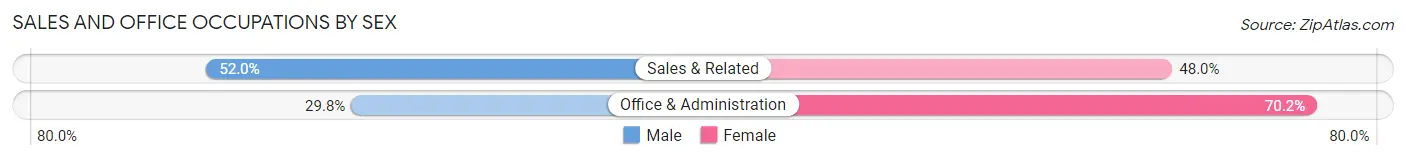
| Occupation | Male | Female |
| Sales & Related | 499 (52.0%) | 460 (48.0%) |
| Office & Administration | 225 (29.8%) | 531 (70.2%) |
| Total (Category) | 724 (42.2%) | 991 (57.8%) |
| Total (Overall) | 5,316 (56.1%) | 4,155 (43.9%) |
Natural Resources, Construction and Maintenance Occupations
The most common Natural Resources, Construction and Maintenance occupations in Beaver Dam are Construction & Extraction (471 | 5.0%), Installation, Maintenance & Repair (120 | 1.3%), and Farming, Fishing & Forestry (22 | 0.2%).
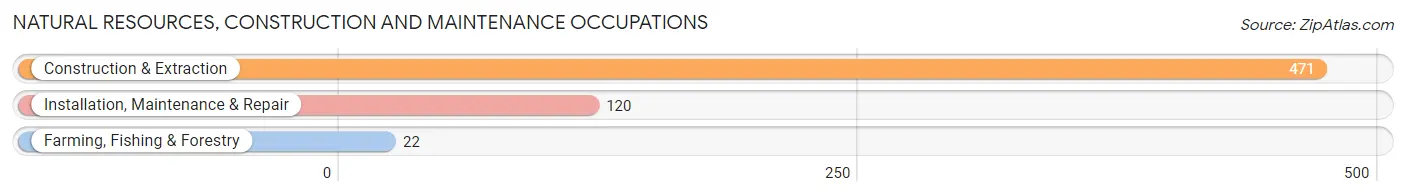
Natural Resources, Construction and Maintenance Occupations by Sex
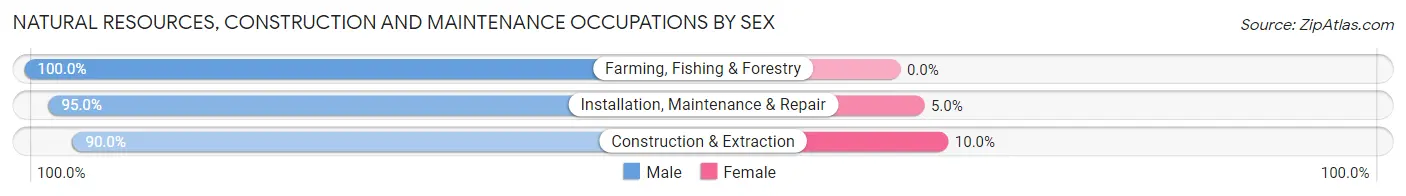
| Occupation | Male | Female |
| Farming, Fishing & Forestry | 22 (100.0%) | 0 (0.0%) |
| Construction & Extraction | 424 (90.0%) | 47 (10.0%) |
| Installation, Maintenance & Repair | 114 (95.0%) | 6 (5.0%) |
| Total (Category) | 560 (91.3%) | 53 (8.6%) |
| Total (Overall) | 5,316 (56.1%) | 4,155 (43.9%) |
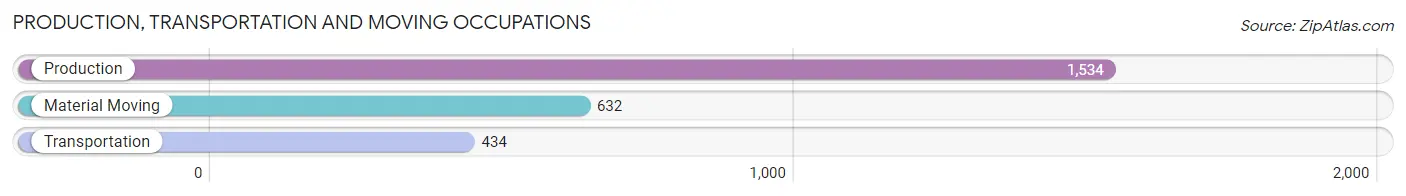
Production, Transportation and Moving Occupations
The most common Production, Transportation and Moving occupations in Beaver Dam are Production (1,534 | 16.2%), Material Moving (632 | 6.7%), and Transportation (434 | 4.6%).
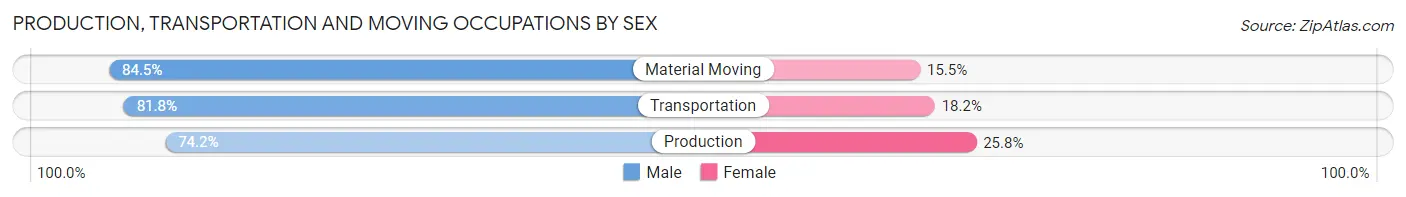
Production, Transportation and Moving Occupations by Sex
| Occupation | Male | Female |
| Production | 1,138 (74.2%) | 396 (25.8%) |
| Transportation | 355 (81.8%) | 79 (18.2%) |
| Material Moving | 534 (84.5%) | 98 (15.5%) |
| Total (Category) | 2,027 (78.0%) | 573 (22.0%) |
| Total (Overall) | 5,316 (56.1%) | 4,155 (43.9%) |
Employment Industries by Sex in Beaver Dam
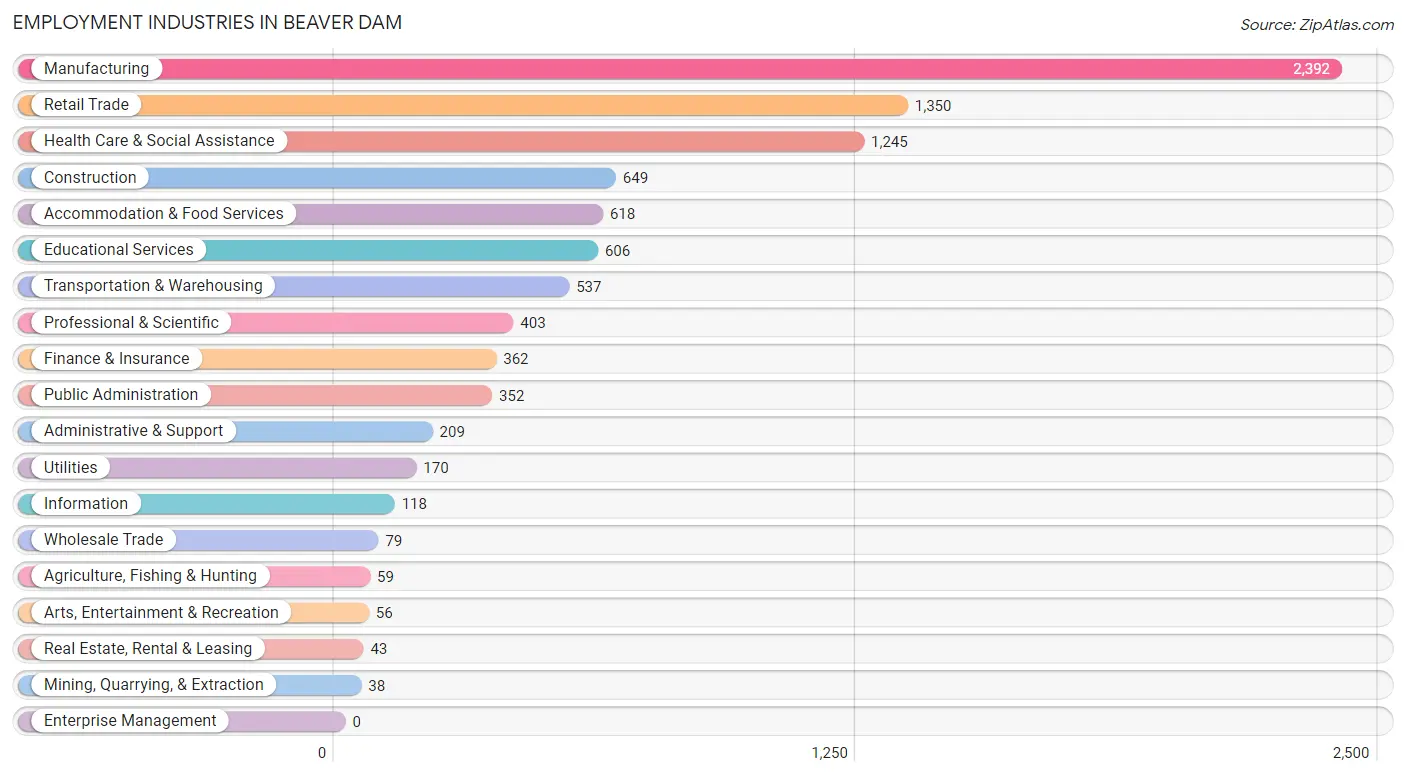
Employment Industries in Beaver Dam
The major employment industries in Beaver Dam include Manufacturing (2,392 | 25.3%), Retail Trade (1,350 | 14.2%), Health Care & Social Assistance (1,245 | 13.2%), Construction (649 | 6.9%), and Accommodation & Food Services (618 | 6.5%).
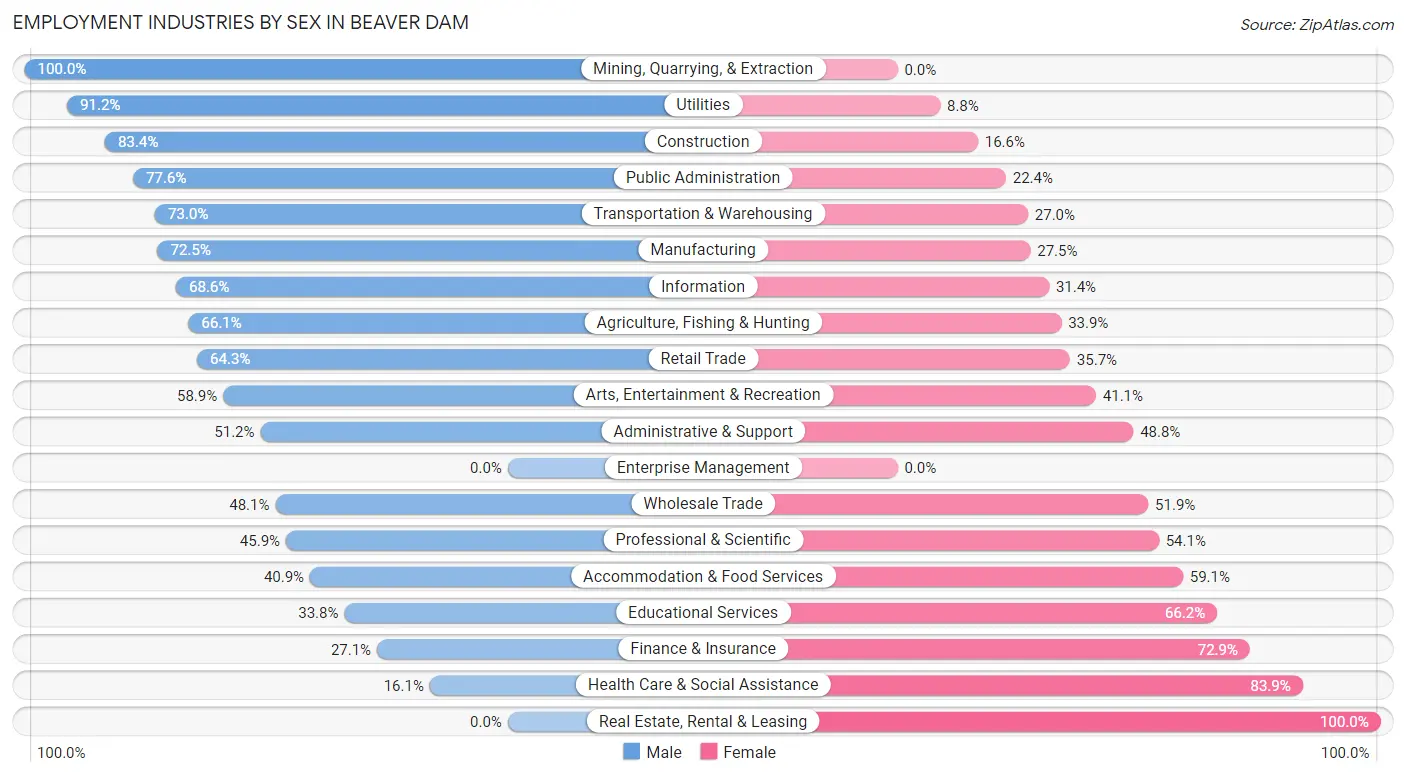
Employment Industries by Sex in Beaver Dam
The Beaver Dam industries that see more men than women are Mining, Quarrying, & Extraction (100.0%), Utilities (91.2%), and Construction (83.4%), whereas the industries that tend to have a higher number of women are Real Estate, Rental & Leasing (100.0%), Health Care & Social Assistance (83.9%), and Finance & Insurance (72.9%).
| Industry | Male | Female |
| Agriculture, Fishing & Hunting | 39 (66.1%) | 20 (33.9%) |
| Mining, Quarrying, & Extraction | 38 (100.0%) | 0 (0.0%) |
| Construction | 541 (83.4%) | 108 (16.6%) |
| Manufacturing | 1,734 (72.5%) | 658 (27.5%) |
| Wholesale Trade | 38 (48.1%) | 41 (51.9%) |
| Retail Trade | 868 (64.3%) | 482 (35.7%) |
| Transportation & Warehousing | 392 (73.0%) | 145 (27.0%) |
| Utilities | 155 (91.2%) | 15 (8.8%) |
| Information | 81 (68.6%) | 37 (31.4%) |
| Finance & Insurance | 98 (27.1%) | 264 (72.9%) |
| Real Estate, Rental & Leasing | 0 (0.0%) | 43 (100.0%) |
| Professional & Scientific | 185 (45.9%) | 218 (54.1%) |
| Enterprise Management | 0 (0.0%) | 0 (0.0%) |
| Administrative & Support | 107 (51.2%) | 102 (48.8%) |
| Educational Services | 205 (33.8%) | 401 (66.2%) |
| Health Care & Social Assistance | 201 (16.1%) | 1,044 (83.9%) |
| Arts, Entertainment & Recreation | 33 (58.9%) | 23 (41.1%) |
| Accommodation & Food Services | 253 (40.9%) | 365 (59.1%) |
| Public Administration | 273 (77.6%) | 79 (22.4%) |
| Total | 5,316 (56.1%) | 4,155 (43.9%) |
Education in Beaver Dam
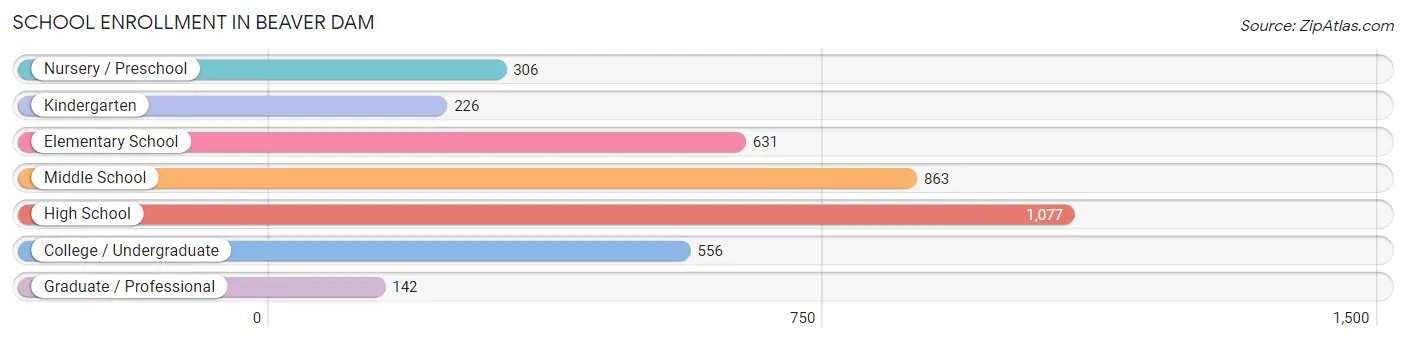
School Enrollment in Beaver Dam
The most common levels of schooling among the 3,801 students in Beaver Dam are high school (1,077 | 28.3%), middle school (863 | 22.7%), and elementary school (631 | 16.6%).
| School Level | # Students | % Students |
| Nursery / Preschool | 306 | 8.1% |
| Kindergarten | 226 | 5.9% |
| Elementary School | 631 | 16.6% |
| Middle School | 863 | 22.7% |
| High School | 1,077 | 28.3% |
| College / Undergraduate | 556 | 14.6% |
| Graduate / Professional | 142 | 3.7% |
| Total | 3,801 | 100.0% |
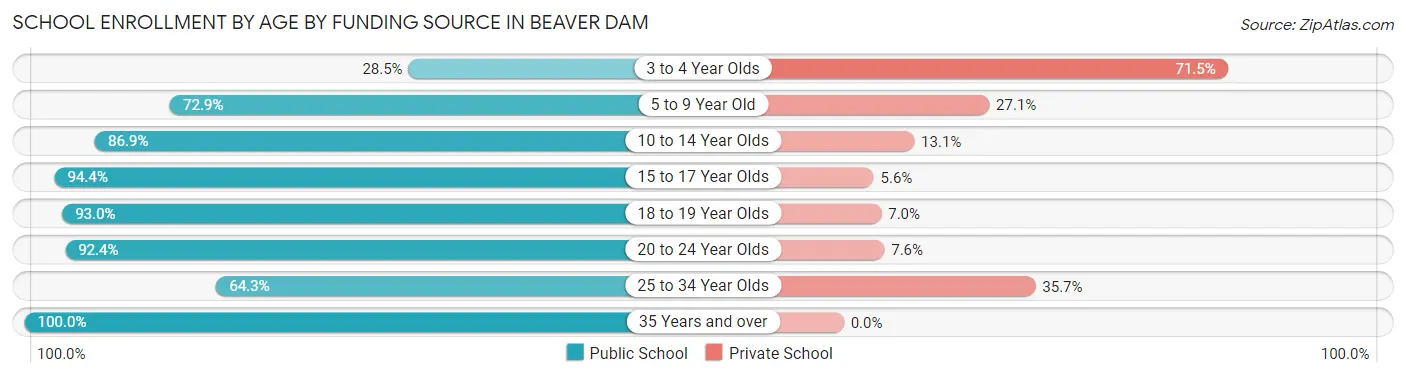
School Enrollment by Age by Funding Source in Beaver Dam
Out of a total of 3,801 students who are enrolled in schools in Beaver Dam, 677 (17.8%) attend a private institution, while the remaining 3,124 (82.2%) are enrolled in public schools. The age group of 3 to 4 year olds has the highest likelihood of being enrolled in private schools, with 153 (71.5% in the age bracket) enrolled. Conversely, the age group of 35 years and over has the lowest likelihood of being enrolled in a private school, with 152 (100.0% in the age bracket) attending a public institution.
| Age Bracket | Public School | Private School |
| 3 to 4 Year Olds | 61 (28.5%) | 153 (71.5%) |
| 5 to 9 Year Old | 624 (72.9%) | 232 (27.1%) |
| 10 to 14 Year Olds | 920 (86.9%) | 139 (13.1%) |
| 15 to 17 Year Olds | 609 (94.4%) | 36 (5.6%) |
| 18 to 19 Year Olds | 411 (93.0%) | 31 (7.0%) |
| 20 to 24 Year Olds | 232 (92.4%) | 19 (7.6%) |
| 25 to 34 Year Olds | 117 (64.3%) | 65 (35.7%) |
| 35 Years and over | 152 (100.0%) | 0 (0.0%) |
| Total | 3,124 (82.2%) | 677 (17.8%) |
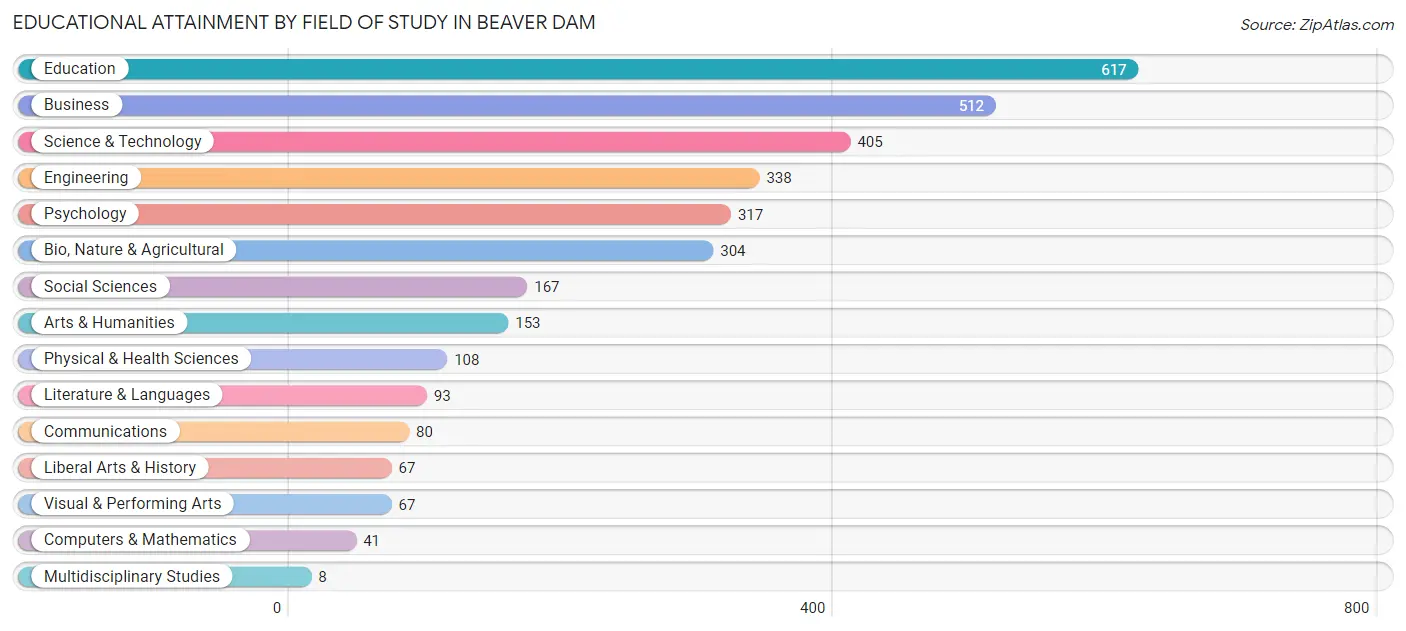
Educational Attainment by Field of Study in Beaver Dam
Education (617 | 18.8%), business (512 | 15.6%), science & technology (405 | 12.4%), engineering (338 | 10.3%), and psychology (317 | 9.7%) are the most common fields of study among 3,277 individuals in Beaver Dam who have obtained a bachelor's degree or higher.
| Field of Study | # Graduates | % Graduates |
| Computers & Mathematics | 41 | 1.3% |
| Bio, Nature & Agricultural | 304 | 9.3% |
| Physical & Health Sciences | 108 | 3.3% |
| Psychology | 317 | 9.7% |
| Social Sciences | 167 | 5.1% |
| Engineering | 338 | 10.3% |
| Multidisciplinary Studies | 8 | 0.2% |
| Science & Technology | 405 | 12.4% |
| Business | 512 | 15.6% |
| Education | 617 | 18.8% |
| Literature & Languages | 93 | 2.8% |
| Liberal Arts & History | 67 | 2.0% |
| Visual & Performing Arts | 67 | 2.0% |
| Communications | 80 | 2.4% |
| Arts & Humanities | 153 | 4.7% |
| Total | 3,277 | 100.0% |
Transportation & Commute in Beaver Dam
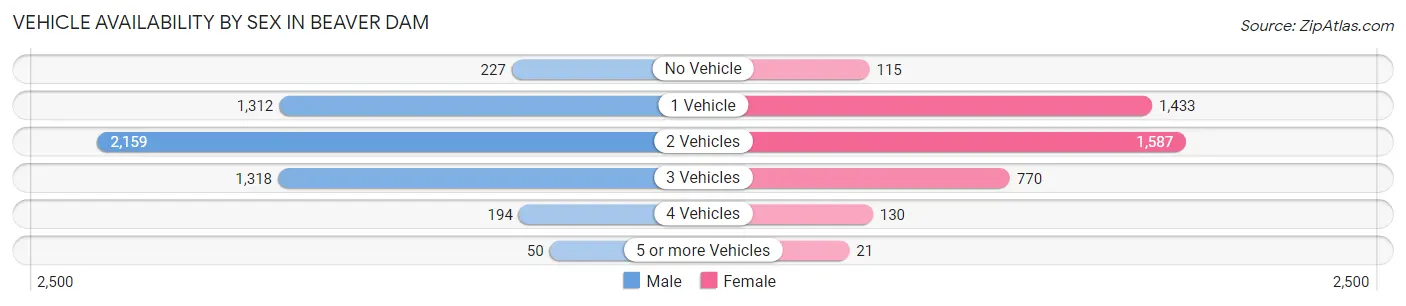
Vehicle Availability by Sex in Beaver Dam
The most prevalent vehicle ownership categories in Beaver Dam are males with 2 vehicles (2,159, accounting for 41.0%) and females with 2 vehicles (1,587, making up 53.2%).
| Vehicles Available | Male | Female |
| No Vehicle | 227 (4.3%) | 115 (2.8%) |
| 1 Vehicle | 1,312 (24.9%) | 1,433 (35.3%) |
| 2 Vehicles | 2,159 (41.0%) | 1,587 (39.1%) |
| 3 Vehicles | 1,318 (25.1%) | 770 (19.0%) |
| 4 Vehicles | 194 (3.7%) | 130 (3.2%) |
| 5 or more Vehicles | 50 (0.9%) | 21 (0.5%) |
| Total | 5,260 (100.0%) | 4,056 (100.0%) |
Commute Time in Beaver Dam
The most frequently occuring commute durations in Beaver Dam are 5 to 9 minutes (1,951 commuters, 21.9%), 10 to 14 minutes (1,523 commuters, 17.1%), and 15 to 19 minutes (1,210 commuters, 13.6%).
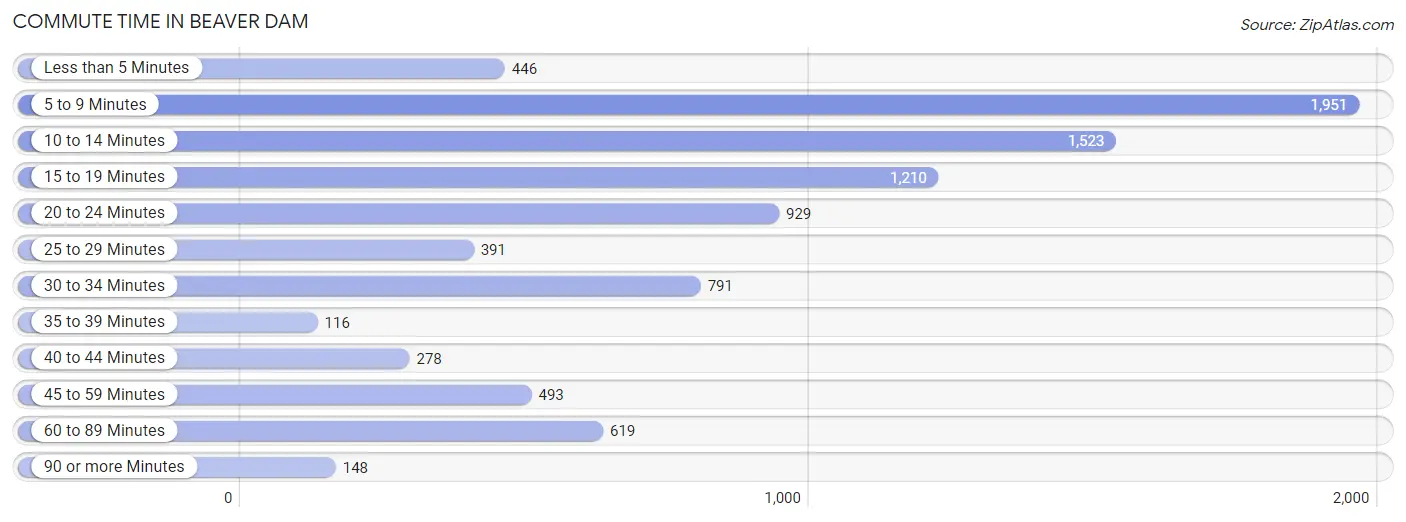
| Commute Time | # Commuters | % Commuters |
| Less than 5 Minutes | 446 | 5.0% |
| 5 to 9 Minutes | 1,951 | 21.9% |
| 10 to 14 Minutes | 1,523 | 17.1% |
| 15 to 19 Minutes | 1,210 | 13.6% |
| 20 to 24 Minutes | 929 | 10.4% |
| 25 to 29 Minutes | 391 | 4.4% |
| 30 to 34 Minutes | 791 | 8.9% |
| 35 to 39 Minutes | 116 | 1.3% |
| 40 to 44 Minutes | 278 | 3.1% |
| 45 to 59 Minutes | 493 | 5.5% |
| 60 to 89 Minutes | 619 | 7.0% |
| 90 or more Minutes | 148 | 1.7% |
Commute Time by Sex in Beaver Dam
The most common commute times in Beaver Dam are 5 to 9 minutes (870 commuters, 17.2%) for males and 5 to 9 minutes (1,081 commuters, 28.3%) for females.
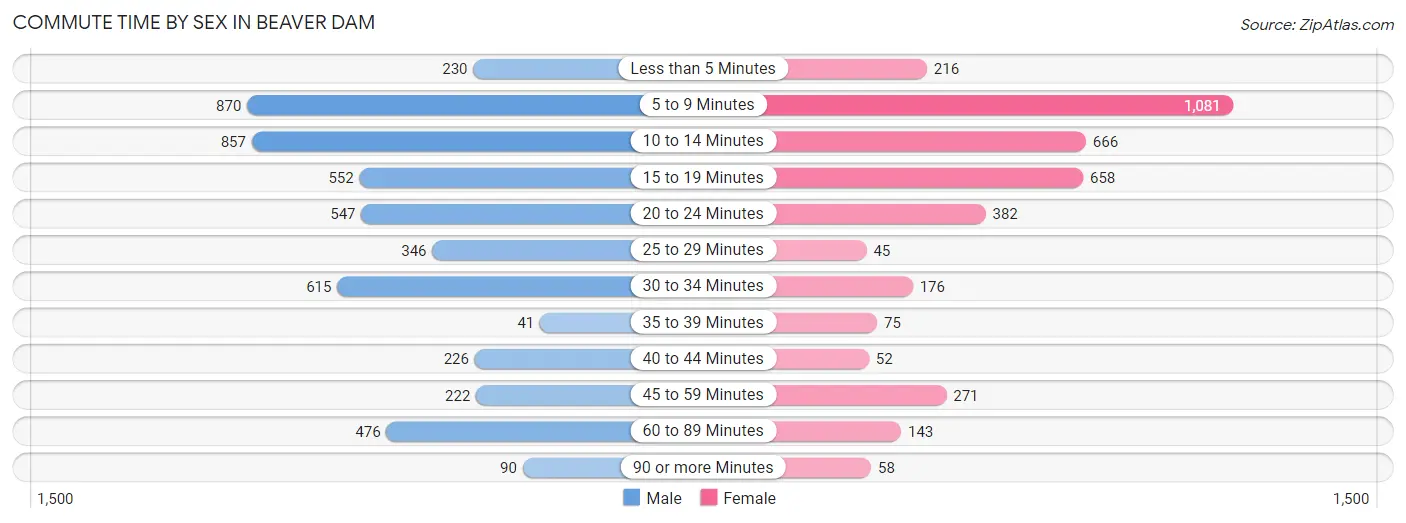
| Commute Time | Male | Female |
| Less than 5 Minutes | 230 (4.5%) | 216 (5.7%) |
| 5 to 9 Minutes | 870 (17.2%) | 1,081 (28.3%) |
| 10 to 14 Minutes | 857 (16.9%) | 666 (17.4%) |
| 15 to 19 Minutes | 552 (10.9%) | 658 (17.2%) |
| 20 to 24 Minutes | 547 (10.8%) | 382 (10.0%) |
| 25 to 29 Minutes | 346 (6.8%) | 45 (1.2%) |
| 30 to 34 Minutes | 615 (12.1%) | 176 (4.6%) |
| 35 to 39 Minutes | 41 (0.8%) | 75 (2.0%) |
| 40 to 44 Minutes | 226 (4.5%) | 52 (1.4%) |
| 45 to 59 Minutes | 222 (4.4%) | 271 (7.1%) |
| 60 to 89 Minutes | 476 (9.4%) | 143 (3.7%) |
| 90 or more Minutes | 90 (1.8%) | 58 (1.5%) |
Time of Departure to Work by Sex in Beaver Dam
The most frequent times of departure to work in Beaver Dam are 12:00 AM to 4:59 AM (826, 16.3%) for males and 7:30 AM to 7:59 AM (594, 15.5%) for females.
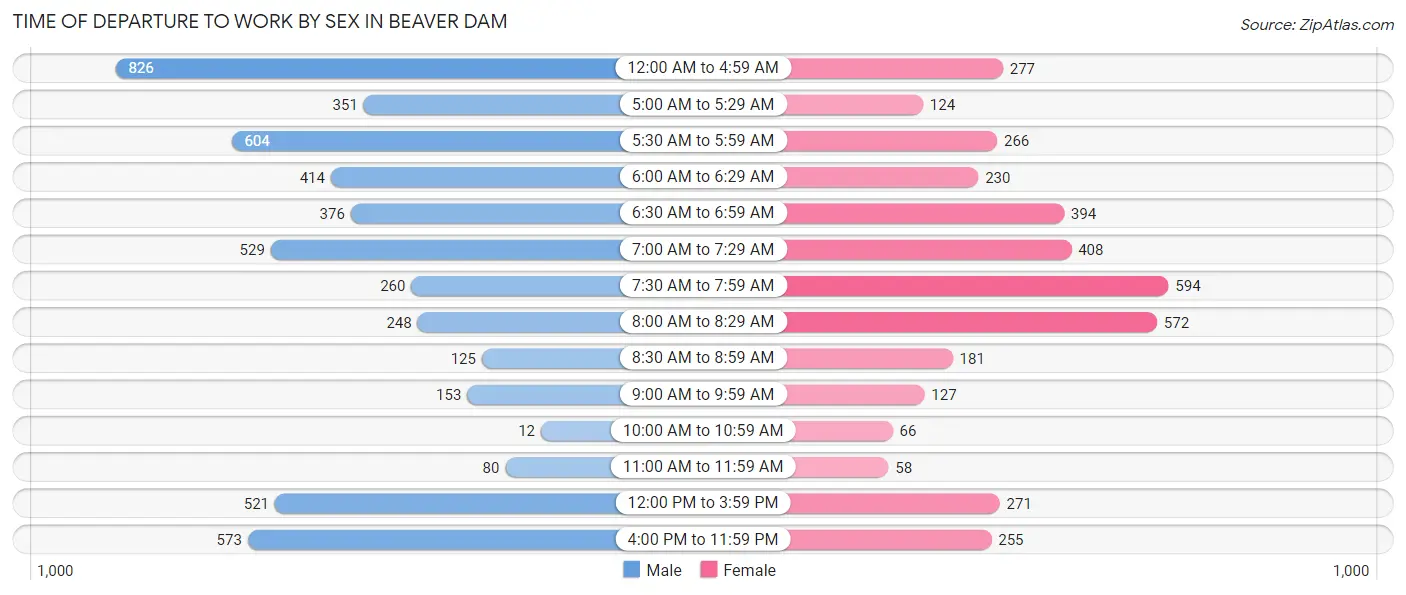
| Time of Departure | Male | Female |
| 12:00 AM to 4:59 AM | 826 (16.3%) | 277 (7.2%) |
| 5:00 AM to 5:29 AM | 351 (6.9%) | 124 (3.2%) |
| 5:30 AM to 5:59 AM | 604 (11.9%) | 266 (7.0%) |
| 6:00 AM to 6:29 AM | 414 (8.2%) | 230 (6.0%) |
| 6:30 AM to 6:59 AM | 376 (7.4%) | 394 (10.3%) |
| 7:00 AM to 7:29 AM | 529 (10.4%) | 408 (10.7%) |
| 7:30 AM to 7:59 AM | 260 (5.1%) | 594 (15.5%) |
| 8:00 AM to 8:29 AM | 248 (4.9%) | 572 (15.0%) |
| 8:30 AM to 8:59 AM | 125 (2.5%) | 181 (4.7%) |
| 9:00 AM to 9:59 AM | 153 (3.0%) | 127 (3.3%) |
| 10:00 AM to 10:59 AM | 12 (0.2%) | 66 (1.7%) |
| 11:00 AM to 11:59 AM | 80 (1.6%) | 58 (1.5%) |
| 12:00 PM to 3:59 PM | 521 (10.3%) | 271 (7.1%) |
| 4:00 PM to 11:59 PM | 573 (11.3%) | 255 (6.7%) |
| Total | 5,072 (100.0%) | 3,823 (100.0%) |
Housing Occupancy in Beaver Dam
Occupancy by Ownership in Beaver Dam
Of the total 7,750 dwellings in Beaver Dam, owner-occupied units account for 4,178 (53.9%), while renter-occupied units make up 3,572 (46.1%).
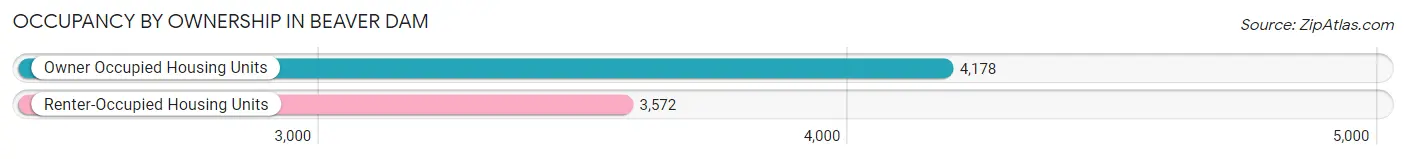
| Occupancy | # Housing Units | % Housing Units |
| Owner Occupied Housing Units | 4,178 | 53.9% |
| Renter-Occupied Housing Units | 3,572 | 46.1% |
| Total Occupied Housing Units | 7,750 | 100.0% |
Occupancy by Household Size in Beaver Dam
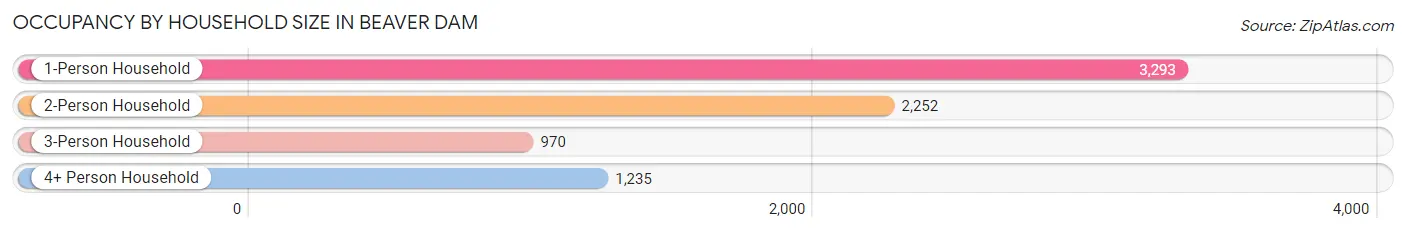
| Household Size | # Housing Units | % Housing Units |
| 1-Person Household | 3,293 | 42.5% |
| 2-Person Household | 2,252 | 29.1% |
| 3-Person Household | 970 | 12.5% |
| 4+ Person Household | 1,235 | 15.9% |
| Total Housing Units | 7,750 | 100.0% |
Occupancy by Ownership by Household Size in Beaver Dam
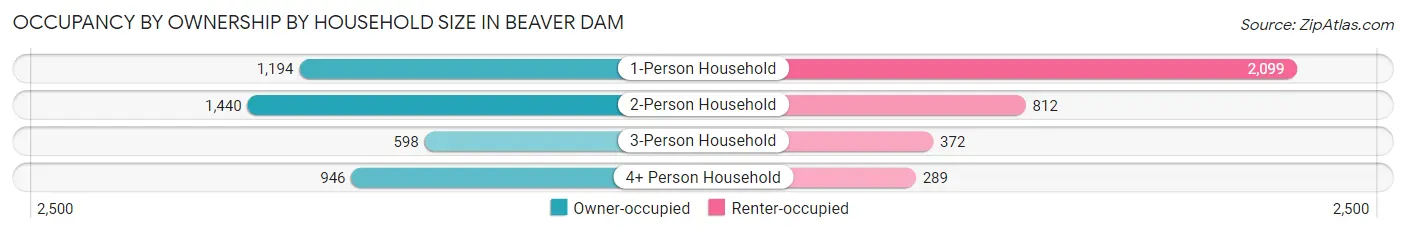
| Household Size | Owner-occupied | Renter-occupied |
| 1-Person Household | 1,194 (36.3%) | 2,099 (63.7%) |
| 2-Person Household | 1,440 (63.9%) | 812 (36.1%) |
| 3-Person Household | 598 (61.7%) | 372 (38.4%) |
| 4+ Person Household | 946 (76.6%) | 289 (23.4%) |
| Total Housing Units | 4,178 (53.9%) | 3,572 (46.1%) |
Occupancy by Educational Attainment in Beaver Dam
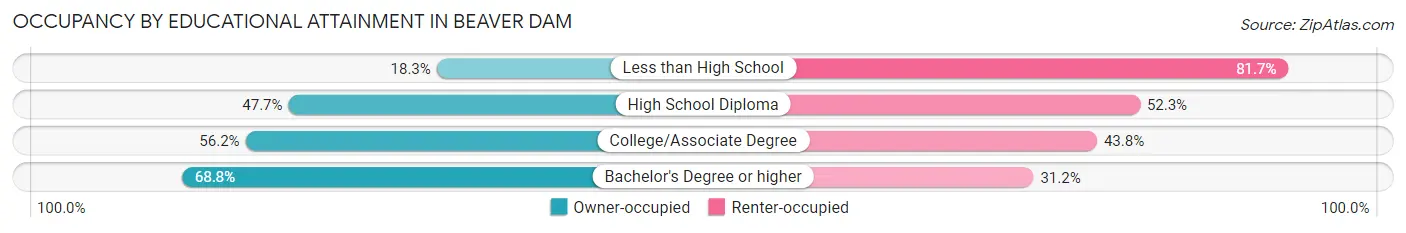
| Household Size | Owner-occupied | Renter-occupied |
| Less than High School | 93 (18.3%) | 415 (81.7%) |
| High School Diploma | 1,275 (47.7%) | 1,398 (52.3%) |
| College/Associate Degree | 1,491 (56.2%) | 1,161 (43.8%) |
| Bachelor's Degree or higher | 1,319 (68.8%) | 598 (31.2%) |
Occupancy by Age of Householder in Beaver Dam
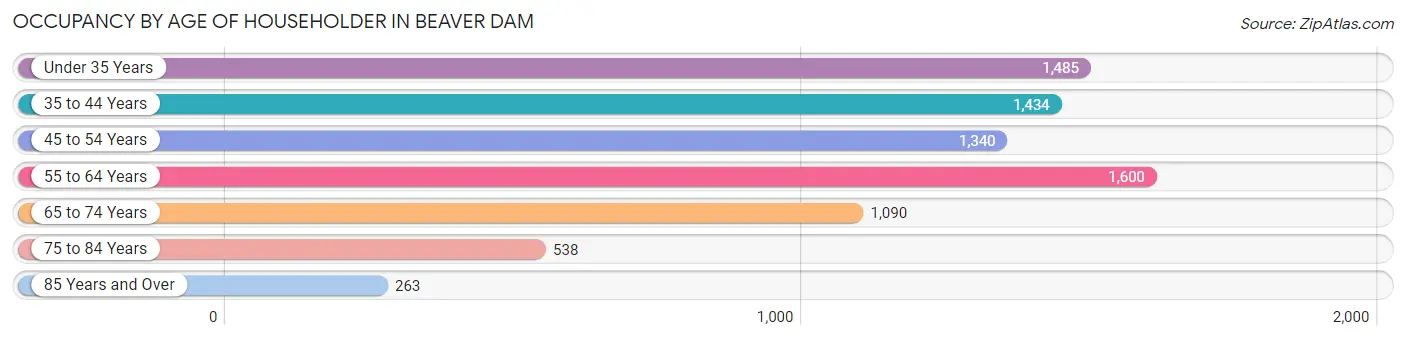
| Age Bracket | # Households | % Households |
| Under 35 Years | 1,485 | 19.2% |
| 35 to 44 Years | 1,434 | 18.5% |
| 45 to 54 Years | 1,340 | 17.3% |
| 55 to 64 Years | 1,600 | 20.6% |
| 65 to 74 Years | 1,090 | 14.1% |
| 75 to 84 Years | 538 | 6.9% |
| 85 Years and Over | 263 | 3.4% |
| Total | 7,750 | 100.0% |
Housing Finances in Beaver Dam
Median Income by Occupancy in Beaver Dam
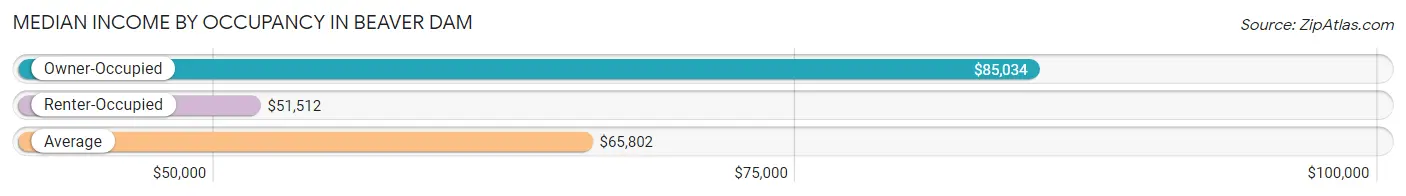
| Occupancy Type | # Households | Median Income |
| Owner-Occupied | 4,178 (53.9%) | $85,034 |
| Renter-Occupied | 3,572 (46.1%) | $51,512 |
| Average | 7,750 (100.0%) | $65,802 |
Occupancy by Householder Income Bracket in Beaver Dam
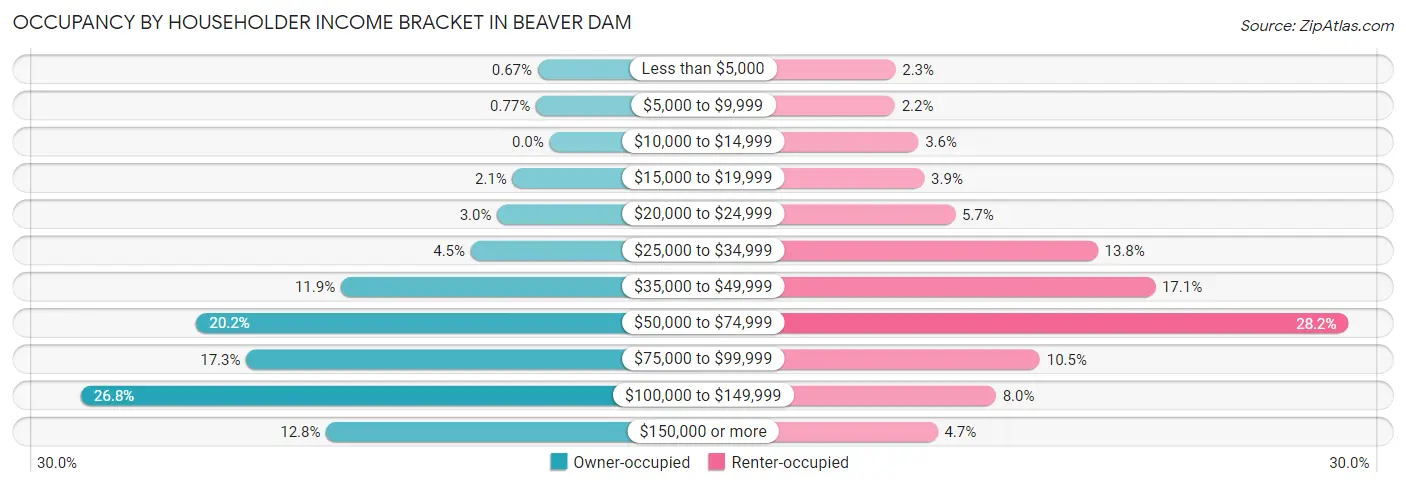
| Income Bracket | Owner-occupied | Renter-occupied |
| Less than $5,000 | 28 (0.7%) | 81 (2.3%) |
| $5,000 to $9,999 | 32 (0.8%) | 80 (2.2%) |
| $10,000 to $14,999 | 0 (0.0%) | 128 (3.6%) |
| $15,000 to $19,999 | 88 (2.1%) | 140 (3.9%) |
| $20,000 to $24,999 | 125 (3.0%) | 203 (5.7%) |
| $25,000 to $34,999 | 188 (4.5%) | 494 (13.8%) |
| $35,000 to $49,999 | 498 (11.9%) | 611 (17.1%) |
| $50,000 to $74,999 | 843 (20.2%) | 1,006 (28.2%) |
| $75,000 to $99,999 | 724 (17.3%) | 376 (10.5%) |
| $100,000 to $149,999 | 1,119 (26.8%) | 286 (8.0%) |
| $150,000 or more | 533 (12.8%) | 167 (4.7%) |
| Total | 4,178 (100.0%) | 3,572 (100.0%) |
Monthly Housing Cost Tiers in Beaver Dam
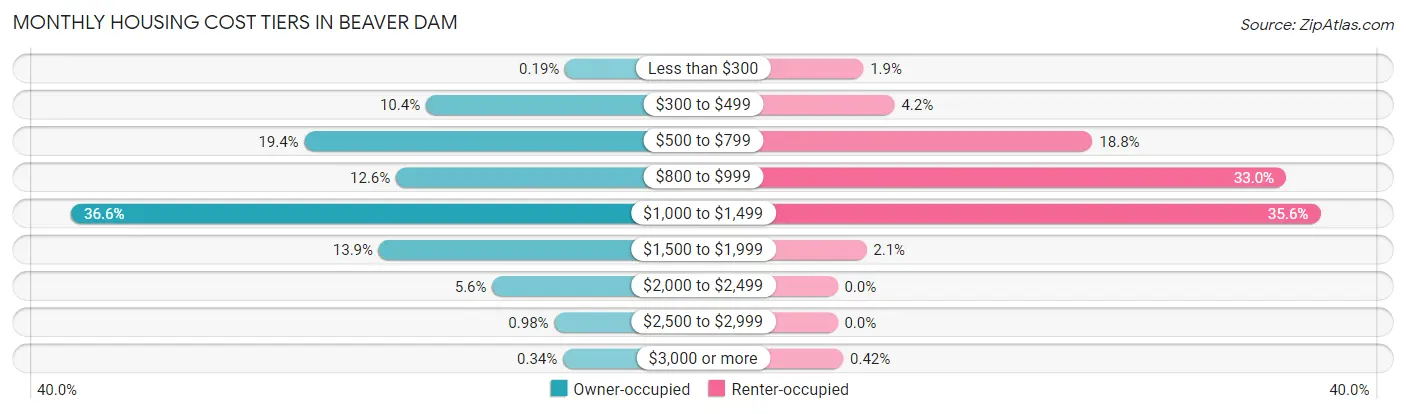
| Monthly Cost | Owner-occupied | Renter-occupied |
| Less than $300 | 8 (0.2%) | 68 (1.9%) |
| $300 to $499 | 436 (10.4%) | 150 (4.2%) |
| $500 to $799 | 810 (19.4%) | 671 (18.8%) |
| $800 to $999 | 528 (12.6%) | 1,180 (33.0%) |
| $1,000 to $1,499 | 1,528 (36.6%) | 1,270 (35.5%) |
| $1,500 to $1,999 | 581 (13.9%) | 76 (2.1%) |
| $2,000 to $2,499 | 232 (5.6%) | 0 (0.0%) |
| $2,500 to $2,999 | 41 (1.0%) | 0 (0.0%) |
| $3,000 or more | 14 (0.3%) | 15 (0.4%) |
| Total | 4,178 (100.0%) | 3,572 (100.0%) |
Physical Housing Characteristics in Beaver Dam
Housing Structures in Beaver Dam
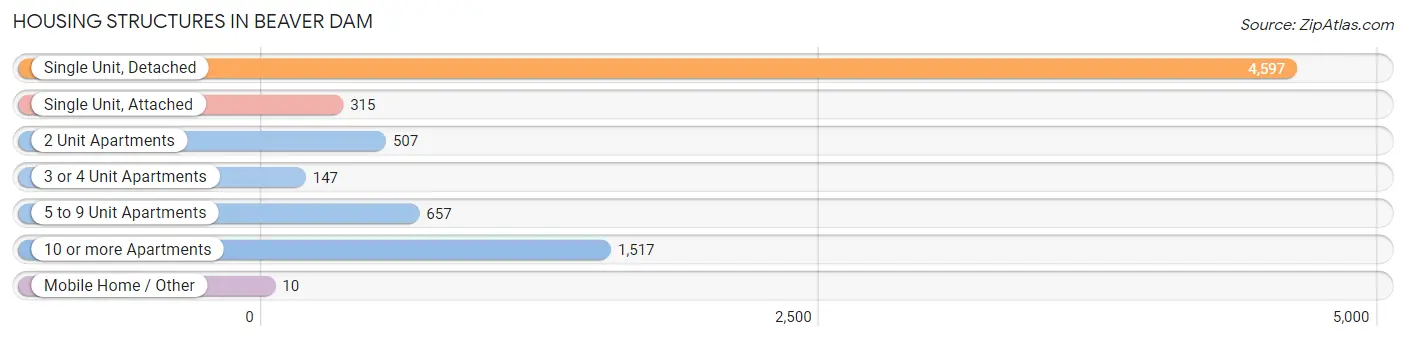
| Structure Type | # Housing Units | % Housing Units |
| Single Unit, Detached | 4,597 | 59.3% |
| Single Unit, Attached | 315 | 4.1% |
| 2 Unit Apartments | 507 | 6.5% |
| 3 or 4 Unit Apartments | 147 | 1.9% |
| 5 to 9 Unit Apartments | 657 | 8.5% |
| 10 or more Apartments | 1,517 | 19.6% |
| Mobile Home / Other | 10 | 0.1% |
| Total | 7,750 | 100.0% |
Housing Structures by Occupancy in Beaver Dam
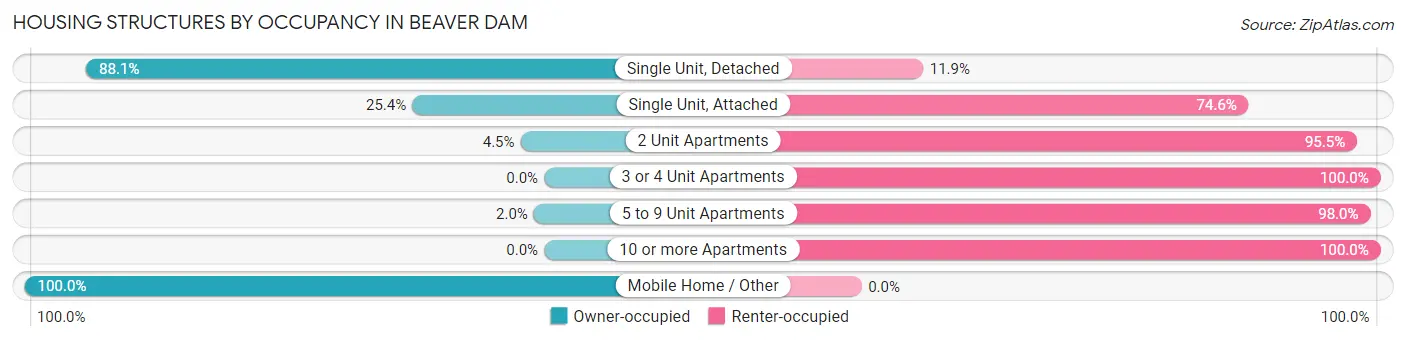
| Structure Type | Owner-occupied | Renter-occupied |
| Single Unit, Detached | 4,052 (88.1%) | 545 (11.9%) |
| Single Unit, Attached | 80 (25.4%) | 235 (74.6%) |
| 2 Unit Apartments | 23 (4.5%) | 484 (95.5%) |
| 3 or 4 Unit Apartments | 0 (0.0%) | 147 (100.0%) |
| 5 to 9 Unit Apartments | 13 (2.0%) | 644 (98.0%) |
| 10 or more Apartments | 0 (0.0%) | 1,517 (100.0%) |
| Mobile Home / Other | 10 (100.0%) | 0 (0.0%) |
| Total | 4,178 (53.9%) | 3,572 (46.1%) |
Housing Structures by Number of Rooms in Beaver Dam
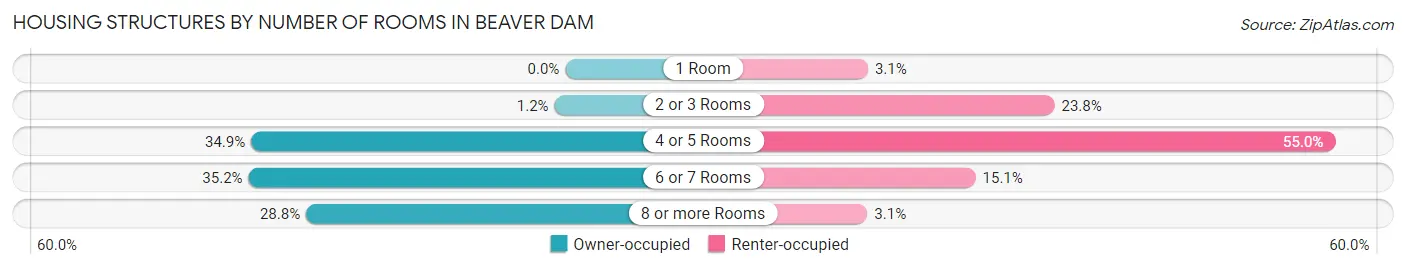
| Number of Rooms | Owner-occupied | Renter-occupied |
| 1 Room | 0 (0.0%) | 111 (3.1%) |
| 2 or 3 Rooms | 50 (1.2%) | 851 (23.8%) |
| 4 or 5 Rooms | 1,457 (34.9%) | 1,963 (55.0%) |
| 6 or 7 Rooms | 1,469 (35.2%) | 538 (15.1%) |
| 8 or more Rooms | 1,202 (28.8%) | 109 (3.0%) |
| Total | 4,178 (100.0%) | 3,572 (100.0%) |
Housing Structure by Heating Type in Beaver Dam
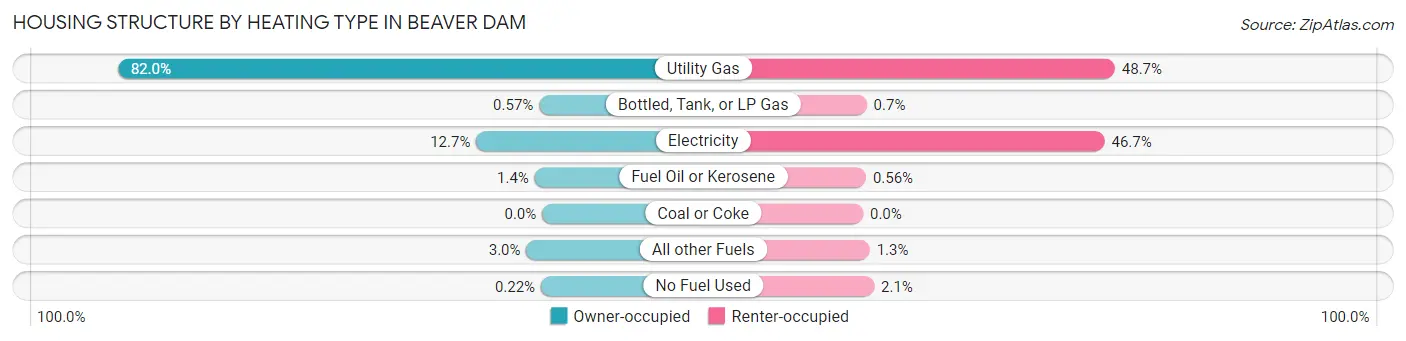
| Heating Type | Owner-occupied | Renter-occupied |
| Utility Gas | 3,426 (82.0%) | 1,738 (48.7%) |
| Bottled, Tank, or LP Gas | 24 (0.6%) | 25 (0.7%) |
| Electricity | 532 (12.7%) | 1,667 (46.7%) |
| Fuel Oil or Kerosene | 60 (1.4%) | 20 (0.6%) |
| Coal or Coke | 0 (0.0%) | 0 (0.0%) |
| All other Fuels | 127 (3.0%) | 46 (1.3%) |
| No Fuel Used | 9 (0.2%) | 76 (2.1%) |
| Total | 4,178 (100.0%) | 3,572 (100.0%) |
Household Vehicle Usage in Beaver Dam
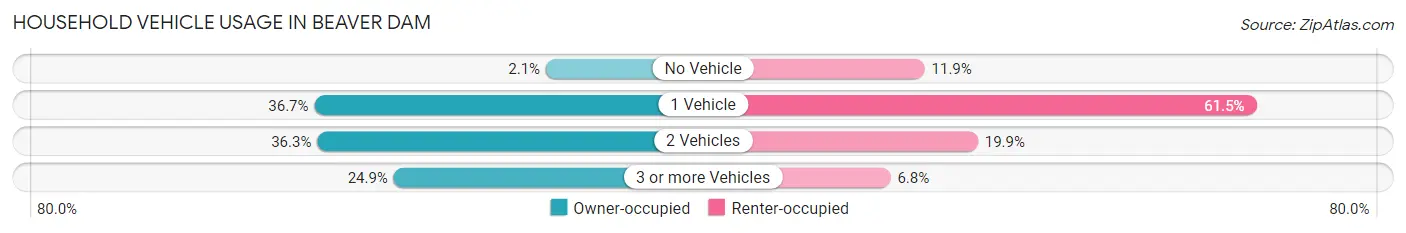
| Vehicles per Household | Owner-occupied | Renter-occupied |
| No Vehicle | 89 (2.1%) | 425 (11.9%) |
| 1 Vehicle | 1,534 (36.7%) | 2,195 (61.5%) |
| 2 Vehicles | 1,516 (36.3%) | 709 (19.9%) |
| 3 or more Vehicles | 1,039 (24.9%) | 243 (6.8%) |
| Total | 4,178 (100.0%) | 3,572 (100.0%) |
Real Estate & Mortgages in Beaver Dam
Real Estate and Mortgage Overview in Beaver Dam
| Characteristic | Without Mortgage | With Mortgage |
| Housing Units | 1,368 | 2,810 |
| Median Property Value | $171,700 | $166,000 |
| Median Household Income | $78,900 | $393 |
| Monthly Housing Costs | $636 | $14 |
| Real Estate Taxes | $3,492 | $25 |
Property Value by Mortgage Status in Beaver Dam
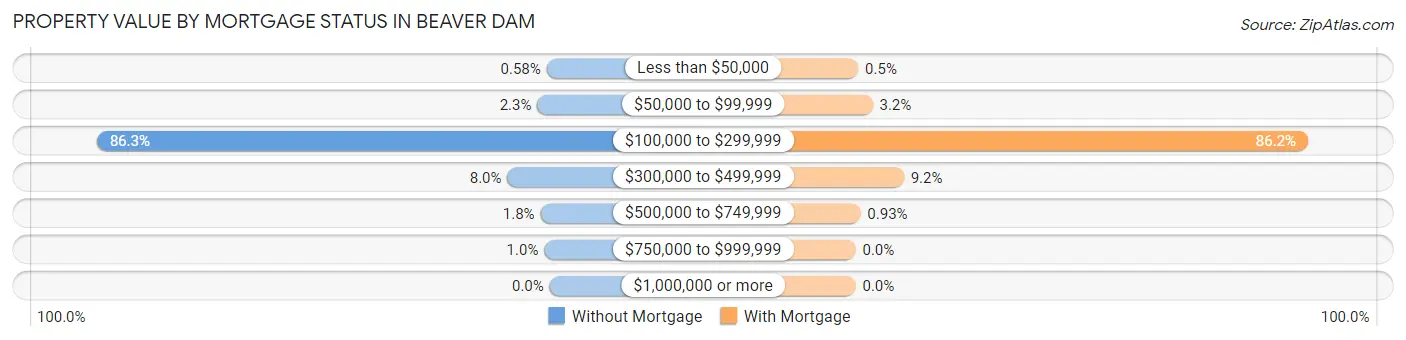
| Property Value | Without Mortgage | With Mortgage |
| Less than $50,000 | 8 (0.6%) | 14 (0.5%) |
| $50,000 to $99,999 | 32 (2.3%) | 91 (3.2%) |
| $100,000 to $299,999 | 1,180 (86.3%) | 2,421 (86.2%) |
| $300,000 to $499,999 | 110 (8.0%) | 258 (9.2%) |
| $500,000 to $749,999 | 24 (1.8%) | 26 (0.9%) |
| $750,000 to $999,999 | 14 (1.0%) | 0 (0.0%) |
| $1,000,000 or more | 0 (0.0%) | 0 (0.0%) |
| Total | 1,368 (100.0%) | 2,810 (100.0%) |
Household Income by Mortgage Status in Beaver Dam
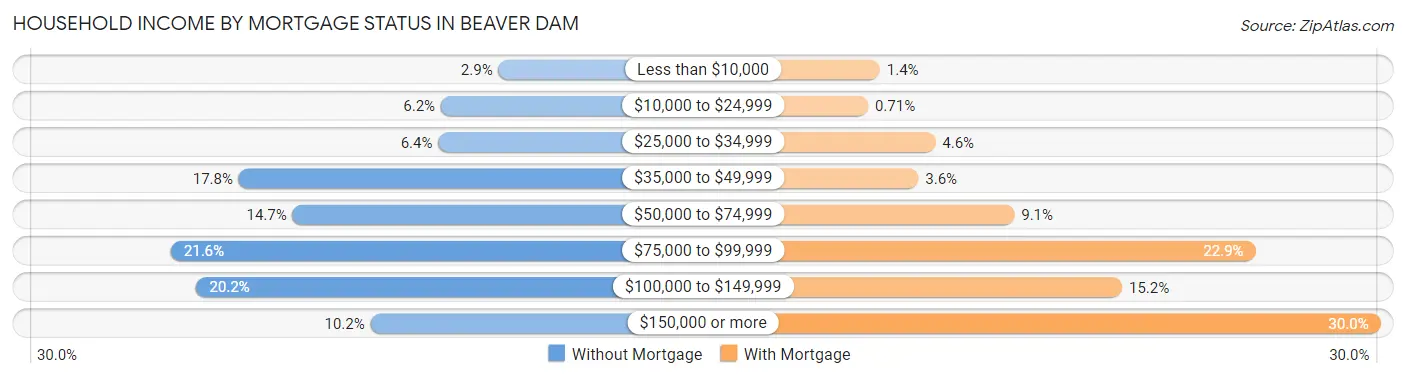
| Household Income | Without Mortgage | With Mortgage |
| Less than $10,000 | 40 (2.9%) | 39 (1.4%) |
| $10,000 to $24,999 | 85 (6.2%) | 20 (0.7%) |
| $25,000 to $34,999 | 87 (6.4%) | 128 (4.6%) |
| $35,000 to $49,999 | 243 (17.8%) | 101 (3.6%) |
| $50,000 to $74,999 | 201 (14.7%) | 255 (9.1%) |
| $75,000 to $99,999 | 296 (21.6%) | 642 (22.9%) |
| $100,000 to $149,999 | 276 (20.2%) | 428 (15.2%) |
| $150,000 or more | 140 (10.2%) | 843 (30.0%) |
| Total | 1,368 (100.0%) | 2,810 (100.0%) |
Property Value to Household Income Ratio in Beaver Dam
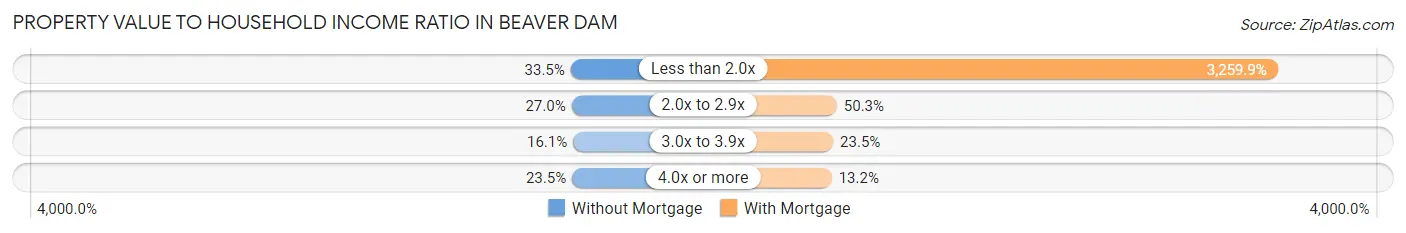
| Value-to-Income Ratio | Without Mortgage | With Mortgage |
| Less than 2.0x | 458 (33.5%) | 91,603 (3,259.9%) |
| 2.0x to 2.9x | 369 (27.0%) | 1,412 (50.2%) |
| 3.0x to 3.9x | 220 (16.1%) | 661 (23.5%) |
| 4.0x or more | 321 (23.5%) | 372 (13.2%) |
| Total | 1,368 (100.0%) | 2,810 (100.0%) |
Real Estate Taxes by Mortgage Status in Beaver Dam
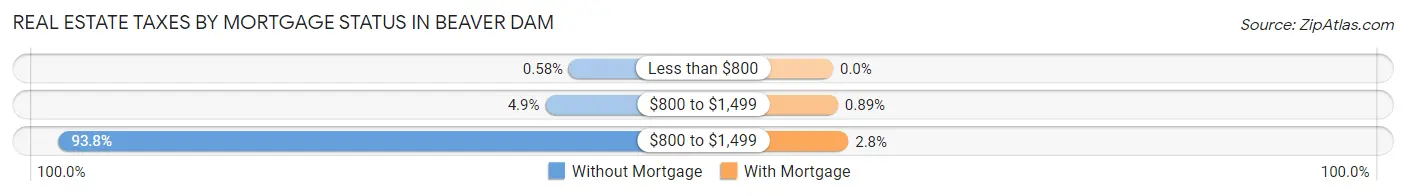
| Property Taxes | Without Mortgage | With Mortgage |
| Less than $800 | 8 (0.6%) | 0 (0.0%) |
| $800 to $1,499 | 67 (4.9%) | 25 (0.9%) |
| $800 to $1,499 | 1,283 (93.8%) | 78 (2.8%) |
| Total | 1,368 (100.0%) | 2,810 (100.0%) |
Health & Disability in Beaver Dam
Health Insurance Coverage by Age in Beaver Dam
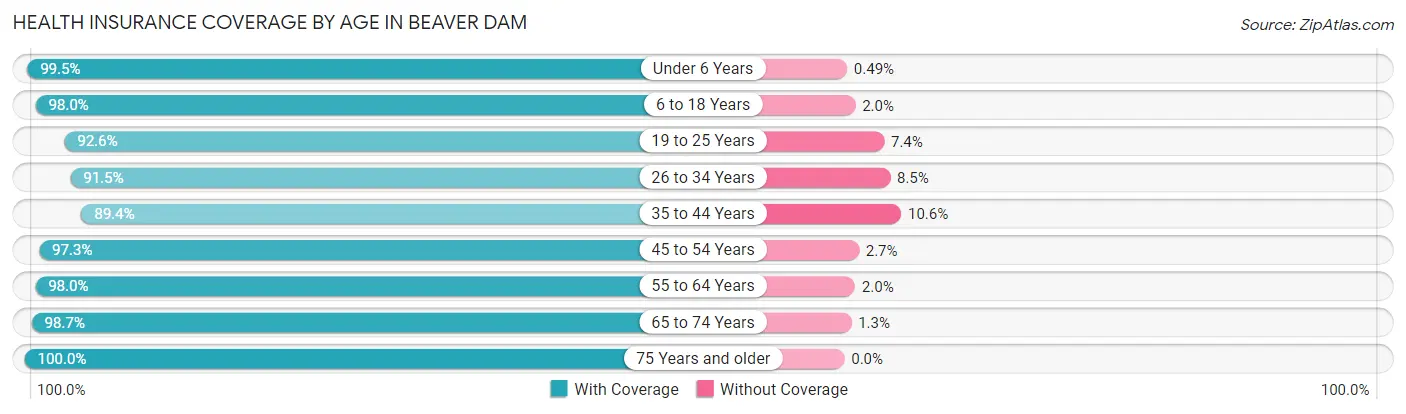
| Age Bracket | With Coverage | Without Coverage |
| Under 6 Years | 1,015 (99.5%) | 5 (0.5%) |
| 6 to 18 Years | 2,746 (98.0%) | 57 (2.0%) |
| 19 to 25 Years | 949 (92.6%) | 76 (7.4%) |
| 26 to 34 Years | 1,963 (91.5%) | 183 (8.5%) |
| 35 to 44 Years | 2,036 (89.4%) | 241 (10.6%) |
| 45 to 54 Years | 2,128 (97.3%) | 59 (2.7%) |
| 55 to 64 Years | 2,282 (98.0%) | 46 (2.0%) |
| 65 to 74 Years | 1,536 (98.7%) | 20 (1.3%) |
| 75 Years and older | 1,093 (100.0%) | 0 (0.0%) |
| Total | 15,748 (95.8%) | 687 (4.2%) |
Health Insurance Coverage by Citizenship Status in Beaver Dam
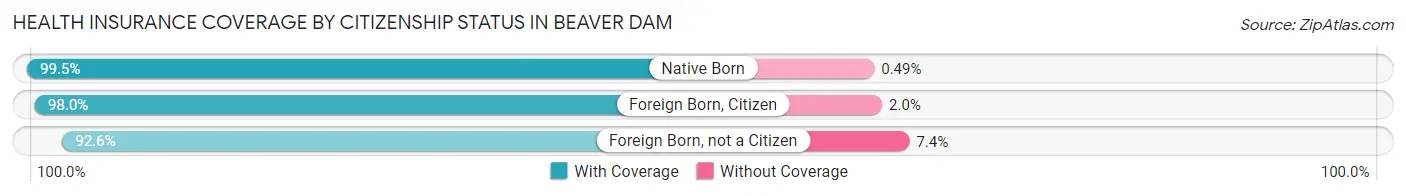
| Citizenship Status | With Coverage | Without Coverage |
| Native Born | 1,015 (99.5%) | 5 (0.5%) |
| Foreign Born, Citizen | 2,746 (98.0%) | 57 (2.0%) |
| Foreign Born, not a Citizen | 949 (92.6%) | 76 (7.4%) |
Health Insurance Coverage by Household Income in Beaver Dam
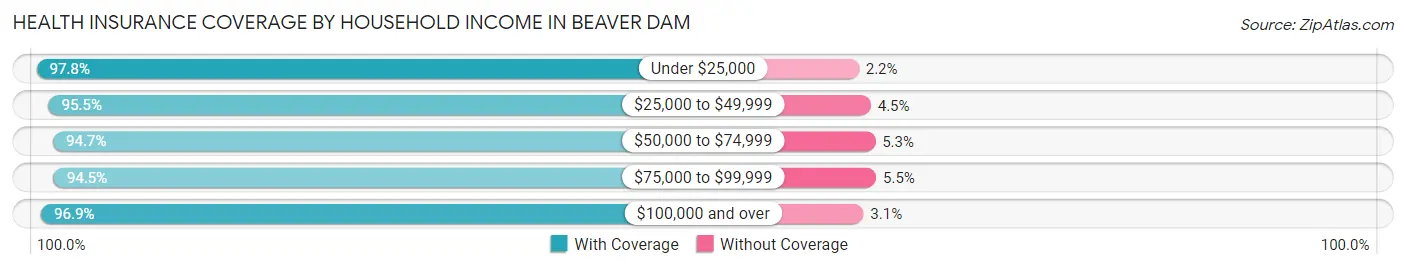
| Household Income | With Coverage | Without Coverage |
| Under $25,000 | 1,224 (97.8%) | 28 (2.2%) |
| $25,000 to $49,999 | 3,101 (95.5%) | 146 (4.5%) |
| $50,000 to $74,999 | 3,179 (94.7%) | 179 (5.3%) |
| $75,000 to $99,999 | 2,600 (94.5%) | 151 (5.5%) |
| $100,000 and over | 5,599 (96.9%) | 180 (3.1%) |
Public vs Private Health Insurance Coverage by Age in Beaver Dam
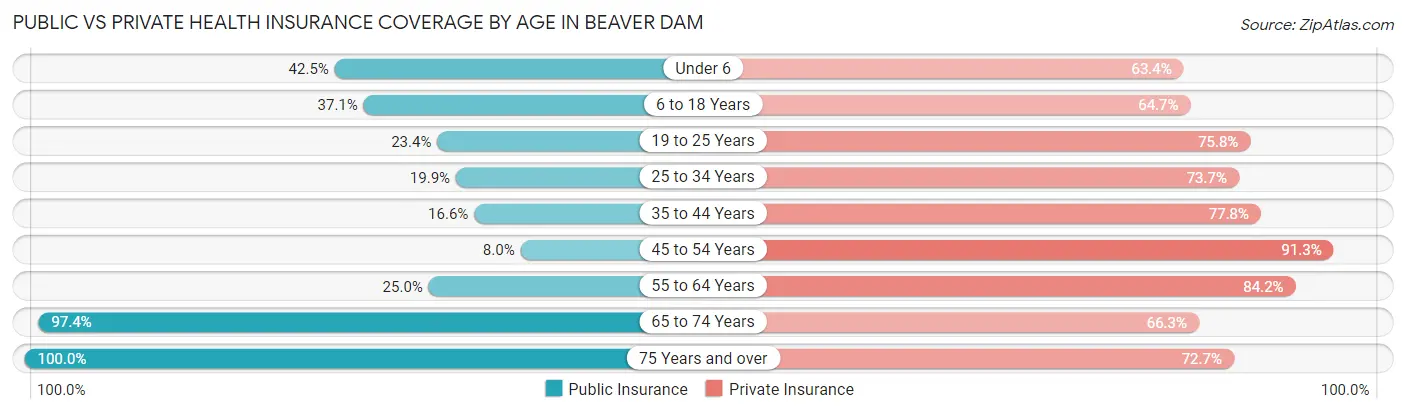
| Age Bracket | Public Insurance | Private Insurance |
| Under 6 | 433 (42.4%) | 647 (63.4%) |
| 6 to 18 Years | 1,039 (37.1%) | 1,813 (64.7%) |
| 19 to 25 Years | 240 (23.4%) | 777 (75.8%) |
| 25 to 34 Years | 428 (19.9%) | 1,581 (73.7%) |
| 35 to 44 Years | 377 (16.6%) | 1,771 (77.8%) |
| 45 to 54 Years | 174 (8.0%) | 1,996 (91.3%) |
| 55 to 64 Years | 582 (25.0%) | 1,960 (84.2%) |
| 65 to 74 Years | 1,516 (97.4%) | 1,031 (66.3%) |
| 75 Years and over | 1,093 (100.0%) | 795 (72.7%) |
| Total | 5,882 (35.8%) | 12,371 (75.3%) |
Disability Status by Sex by Age in Beaver Dam
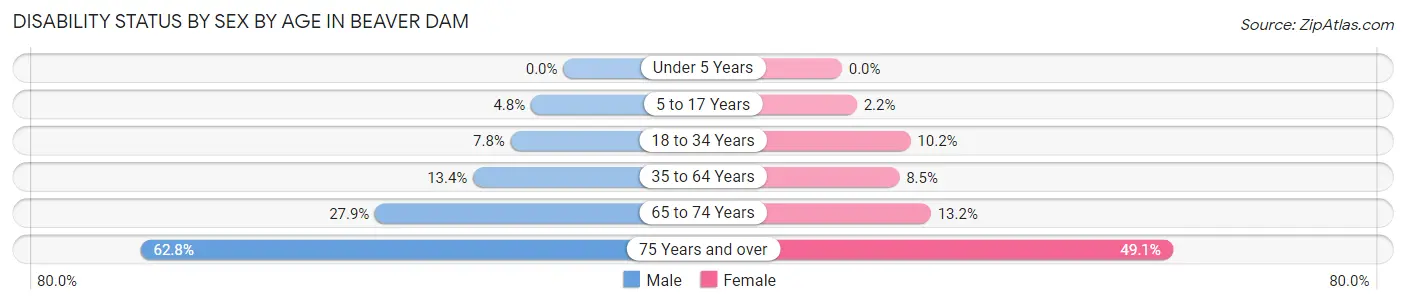
| Age Bracket | Male | Female |
| Under 5 Years | 0 (0.0%) | 0 (0.0%) |
| 5 to 17 Years | 71 (4.8%) | 25 (2.2%) |
| 18 to 34 Years | 173 (7.8%) | 144 (10.2%) |
| 35 to 64 Years | 495 (13.4%) | 264 (8.5%) |
| 65 to 74 Years | 202 (27.9%) | 110 (13.2%) |
| 75 Years and over | 221 (62.8%) | 364 (49.1%) |
Disability Class by Sex by Age in Beaver Dam
Disability Class: Hearing Difficulty
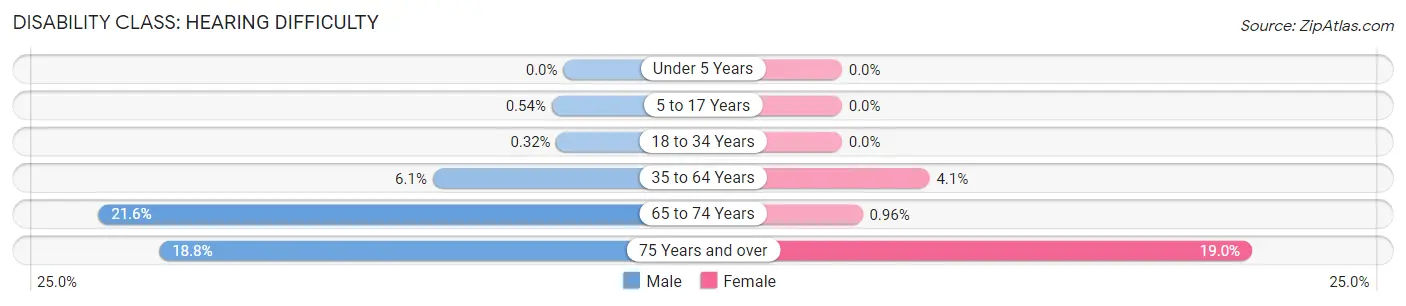
| Age Bracket | Male | Female |
| Under 5 Years | 0 (0.0%) | 0 (0.0%) |
| 5 to 17 Years | 8 (0.5%) | 0 (0.0%) |
| 18 to 34 Years | 7 (0.3%) | 0 (0.0%) |
| 35 to 64 Years | 224 (6.1%) | 126 (4.1%) |
| 65 to 74 Years | 156 (21.6%) | 8 (1.0%) |
| 75 Years and over | 66 (18.8%) | 141 (19.0%) |
Disability Class: Vision Difficulty
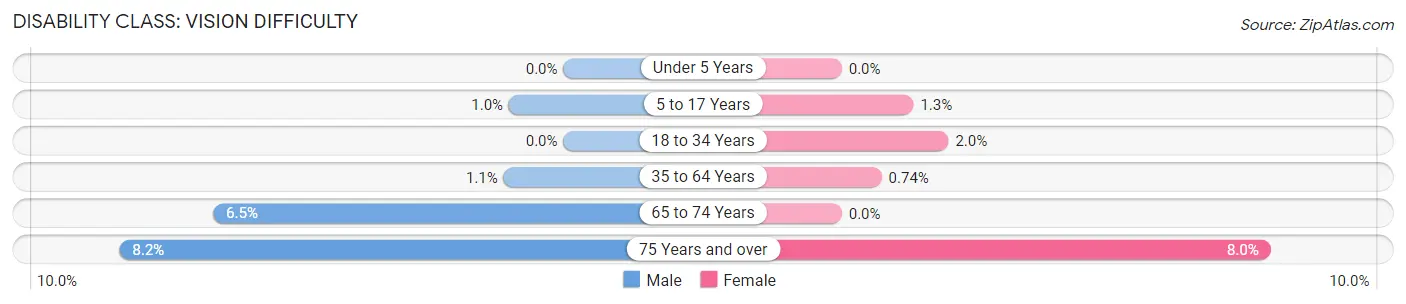
| Age Bracket | Male | Female |
| Under 5 Years | 0 (0.0%) | 0 (0.0%) |
| 5 to 17 Years | 15 (1.0%) | 15 (1.3%) |
| 18 to 34 Years | 0 (0.0%) | 28 (2.0%) |
| 35 to 64 Years | 41 (1.1%) | 23 (0.7%) |
| 65 to 74 Years | 47 (6.5%) | 0 (0.0%) |
| 75 Years and over | 29 (8.2%) | 59 (8.0%) |
Disability Class: Cognitive Difficulty
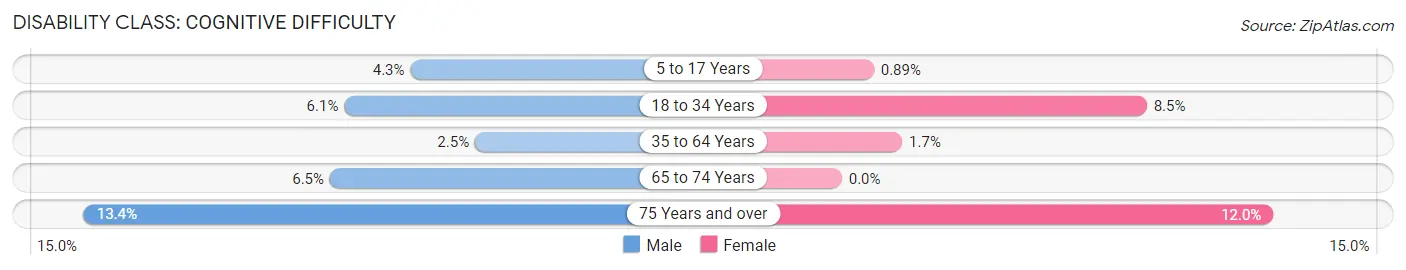
| Age Bracket | Male | Female |
| 5 to 17 Years | 63 (4.3%) | 10 (0.9%) |
| 18 to 34 Years | 135 (6.1%) | 120 (8.5%) |
| 35 to 64 Years | 91 (2.5%) | 52 (1.7%) |
| 65 to 74 Years | 47 (6.5%) | 0 (0.0%) |
| 75 Years and over | 47 (13.4%) | 89 (12.0%) |
Disability Class: Ambulatory Difficulty
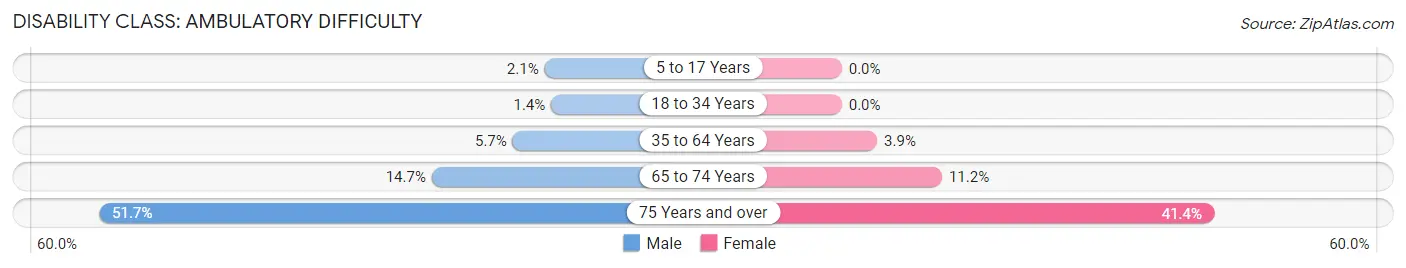
| Age Bracket | Male | Female |
| 5 to 17 Years | 31 (2.1%) | 0 (0.0%) |
| 18 to 34 Years | 30 (1.4%) | 0 (0.0%) |
| 35 to 64 Years | 209 (5.7%) | 122 (3.9%) |
| 65 to 74 Years | 106 (14.7%) | 93 (11.2%) |
| 75 Years and over | 182 (51.7%) | 307 (41.4%) |
Disability Class: Self-Care Difficulty
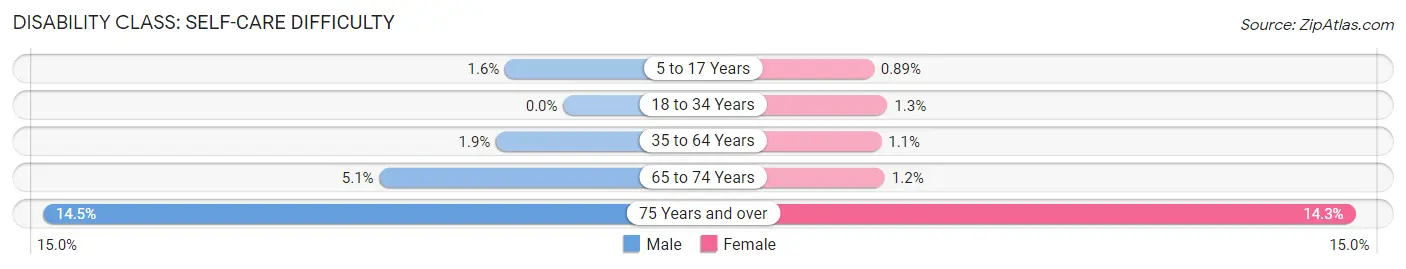
| Age Bracket | Male | Female |
| 5 to 17 Years | 24 (1.6%) | 10 (0.9%) |
| 18 to 34 Years | 0 (0.0%) | 18 (1.3%) |
| 35 to 64 Years | 69 (1.9%) | 34 (1.1%) |
| 65 to 74 Years | 37 (5.1%) | 10 (1.2%) |
| 75 Years and over | 51 (14.5%) | 106 (14.3%) |
Technology Access in Beaver Dam
Computing Device Access in Beaver Dam
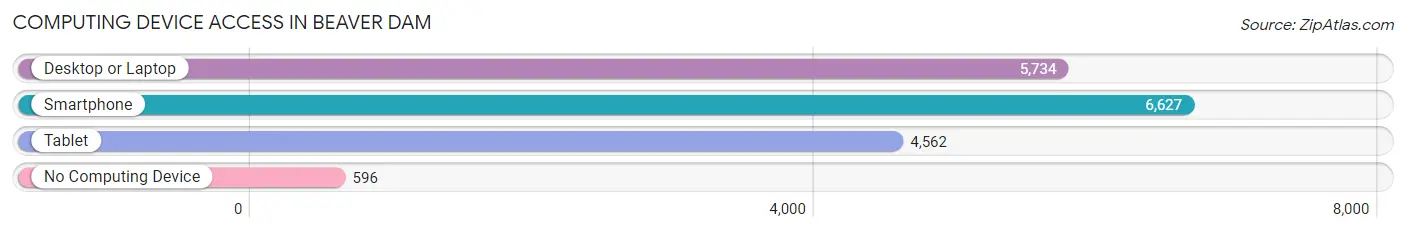
| Device Type | # Households | % Households |
| Desktop or Laptop | 5,734 | 74.0% |
| Smartphone | 6,627 | 85.5% |
| Tablet | 4,562 | 58.9% |
| No Computing Device | 596 | 7.7% |
| Total | 7,750 | 100.0% |
Internet Access in Beaver Dam
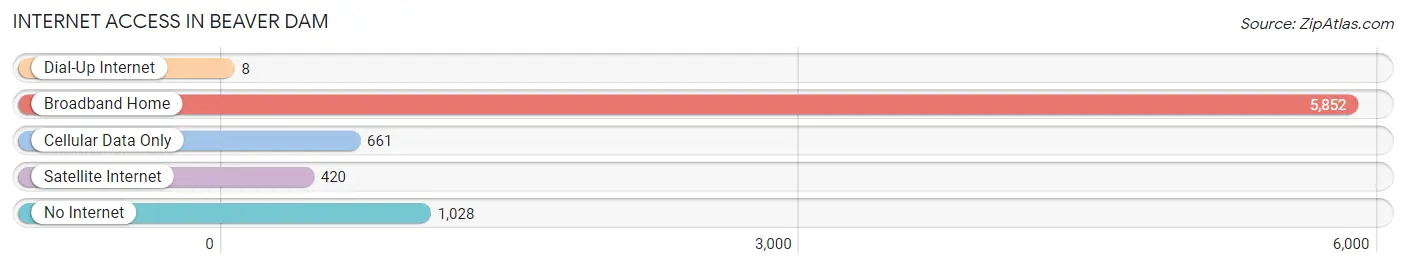
| Internet Type | # Households | % Households |
| Dial-Up Internet | 8 | 0.1% |
| Broadband Home | 5,852 | 75.5% |
| Cellular Data Only | 661 | 8.5% |
| Satellite Internet | 420 | 5.4% |
| No Internet | 1,028 | 13.3% |
| Total | 7,750 | 100.0% |
Beaver Dam Summary
Beaver Dam is a city located in Dodge County, Wisconsin, United States. It is situated on the Beaver Dam River, which flows into the Rock River. The city is located about 30 miles southwest of Milwaukee and about 60 miles northeast of Madison. As of the 2010 census, the city had a population of 16,214, making it the largest city in Dodge County.
History
The area that is now Beaver Dam was first settled in 1841 by William and Mary Johnston, who built a log cabin near the Beaver Dam River. The area was originally known as Johnstonville, and the first post office was established in 1845. The city was officially incorporated in 1856, and the name was changed to Beaver Dam.
The city grew rapidly in the late 19th century, due to the construction of the Milwaukee and Mississippi Railroad in 1871. The railroad connected Beaver Dam to Milwaukee and other cities in the region, and the city became a major shipping center for agricultural products.
Geography
Beaver Dam is located at 43°26′N 88°50′W (43.4333, -88.8333). According to the United States Census Bureau, the city has a total area of 8.2 square miles (21.2 km2), of which 8.1 square miles (21.0 km2) is land and 0.1 square miles (0.2 km2) is water.
Economy
Beaver Dam is a major center for manufacturing and agriculture. The city is home to several large manufacturing companies, including John Deere, Kohler Company, and Briggs & Stratton. The city is also home to several smaller businesses, including a number of restaurants, retail stores, and service providers.
Agriculture is also an important part of the local economy. The city is home to several large farms, and the surrounding area is known for its dairy production.
Demographics
As of the 2010 census, there were 16,214 people, 6,717 households, and 4,072 families residing in the city. The population density was 1,988.3 people per square mile (766.7/km2). There were 7,093 housing units at an average density of 872.3 per square mile (337.2/km2). The racial makeup of the city was 94.2% White, 0.9% African American, 0.4% Native American, 0.7% Asian, 2.3% from other races, and 1.5% from two or more races. Hispanic or Latino of any race were 5.2% of the population.
There were 6,717 households, out of which 30.2% had children under the age of 18 living with them, 46.2% were married couples living together, 11.3% had a female householder with no husband present, and 37.3% were non-families. 32.2% of all households were made up of individuals, and 14.2% had someone living alone who was 65 years of age or older. The average household size was 2.35 and the average family size was 2.97.
In the city, the population was spread out, with 24.2% under the age of 18, 8.2% from 18 to 24, 28.2% from 25 to 44, 21.7% from 45 to 64, and 17.7% who were 65 years of age or older. The median age was 38 years. For every 100 females, there were 93.2 males. For every 100 females age 18 and over, there were 89.7 males.
The median income for a household in the city was $41,945, and the median income for a family was $51,945. Males had a median income of $37,945 versus $25,945 for females. The per capita income for the city was $20,945. About 5.2% of families and 7.2% of the population were below the poverty line, including 9.2% of those under age 18 and 6.2% of those age 65 or over.
Common Questions
What is Per Capita Income in Beaver Dam?
Per Capita income in Beaver Dam is $37,106.
What is the Median Family Income in Beaver Dam?
Median Family Income in Beaver Dam is $85,336.
What is the Median Household income in Beaver Dam?
Median Household Income in Beaver Dam is $65,802.
What is Income or Wage Gap in Beaver Dam?
Income or Wage Gap in Beaver Dam is 21.7%.
Women in Beaver Dam earn 78.3 cents for every dollar earned by a man.
What is Inequality or Gini Index in Beaver Dam?
Inequality or Gini Index in Beaver Dam is 0.36.
What is the Total Population of Beaver Dam?
Total Population of Beaver Dam is 16,652.
What is the Total Male Population of Beaver Dam?
Total Male Population of Beaver Dam is 8,874.
What is the Total Female Population of Beaver Dam?
Total Female Population of Beaver Dam is 7,778.
What is the Ratio of Males per 100 Females in Beaver Dam?
There are 114.09 Males per 100 Females in Beaver Dam.
What is the Ratio of Females per 100 Males in Beaver Dam?
There are 87.65 Females per 100 Males in Beaver Dam.
What is the Median Population Age in Beaver Dam?
Median Population Age in Beaver Dam is 40.4 Years.
What is the Average Family Size in Beaver Dam
Average Family Size in Beaver Dam is 3.0 People.
What is the Average Household Size in Beaver Dam
Average Household Size in Beaver Dam is 2.1 People.
How Large is the Labor Force in Beaver Dam?
There are 9,895 People in the Labor Forcein in Beaver Dam.
What is the Percentage of People in the Labor Force in Beaver Dam?
72.2% of People are in the Labor Force in Beaver Dam.
What is the Unemployment Rate in Beaver Dam?
Unemployment Rate in Beaver Dam is 4.3%.