Ellsworth, WI Map & Demographics
Ellsworth Map
Ellsworth Overview
$35,693
PER CAPITA INCOME
$88,711
AVG FAMILY INCOME
$72,326
AVG HOUSEHOLD INCOME
29.7%
WAGE / INCOME GAP [ % ]
70.3¢/ $1
WAGE / INCOME GAP [ $ ]
$3,393
FAMILY INCOME DEFICIT
0.38
INEQUALITY / GINI INDEX
3,323
TOTAL POPULATION
1,568
MALE POPULATION
1,755
FEMALE POPULATION
89.34
MALES / 100 FEMALES
111.93
FEMALES / 100 MALES
41.8
MEDIAN AGE
3.2
AVG FAMILY SIZE
2.2
AVG HOUSEHOLD SIZE
1,728
LABOR FORCE [ PEOPLE ]
67.2%
PERCENT IN LABOR FORCE
3.9%
UNEMPLOYMENT RATE
Ellsworth Zip Codes
Ellsworth Area Codes
Income in Ellsworth
Income Overview in Ellsworth
Per Capita Income in Ellsworth is $35,693, while median incomes of families and households are $88,711 and $72,326 respectively.
| Characteristic | Number | Measure |
| Per Capita Income | 3,323 | $35,693 |
| Median Family Income | 751 | $88,711 |
| Mean Family Income | 751 | $99,416 |
| Median Household Income | 1,430 | $72,326 |
| Mean Household Income | 1,430 | $80,391 |
| Income Deficit | 751 | $3,393 |
| Wage / Income Gap (%) | 3,323 | 29.66% |
| Wage / Income Gap ($) | 3,323 | 70.34¢ per $1 |
| Gini / Inequality Index | 3,323 | 0.38 |
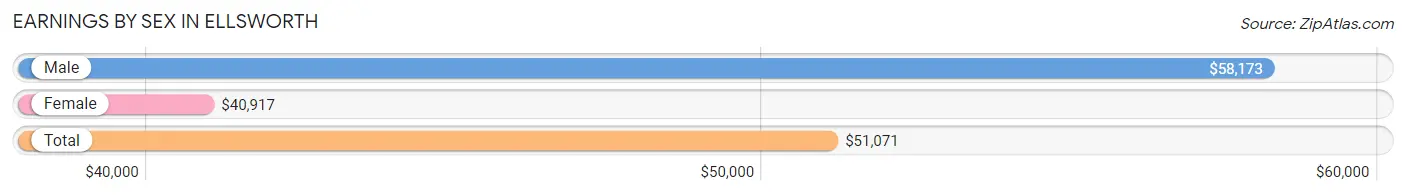
Earnings by Sex in Ellsworth
Average Earnings in Ellsworth are $51,071, $58,173 for men and $40,917 for women, a difference of 29.7%.
| Sex | Number | Average Earnings |
| Male | 879 (48.9%) | $58,173 |
| Female | 917 (51.1%) | $40,917 |
| Total | 1,796 (100.0%) | $51,071 |
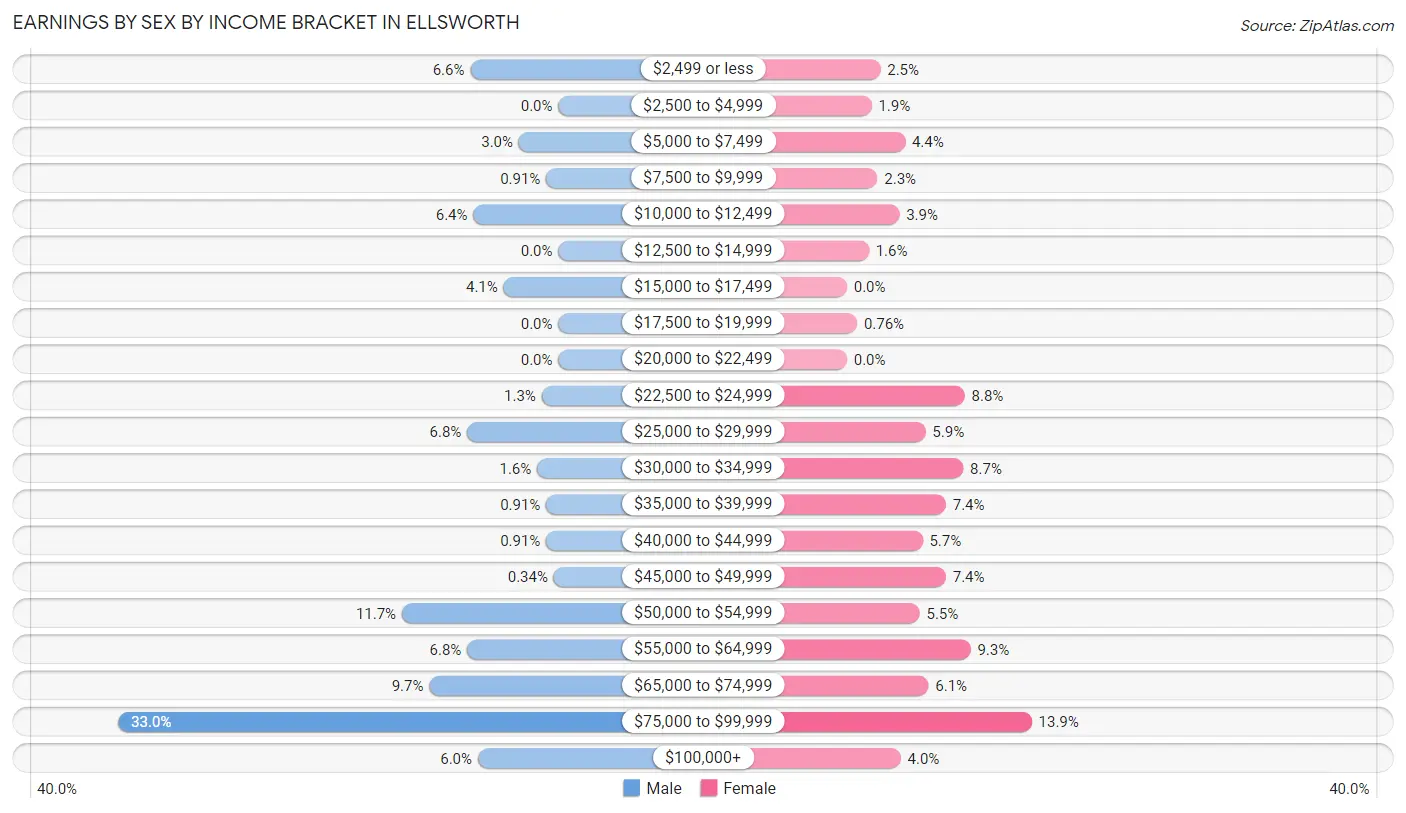
Earnings by Sex by Income Bracket in Ellsworth
The most common earnings brackets in Ellsworth are $75,000 to $99,999 for men (290 | 33.0%) and $75,000 to $99,999 for women (127 | 13.9%).
| Income | Male | Female |
| $2,499 or less | 58 (6.6%) | 23 (2.5%) |
| $2,500 to $4,999 | 0 (0.0%) | 17 (1.8%) |
| $5,000 to $7,499 | 26 (3.0%) | 40 (4.4%) |
| $7,500 to $9,999 | 8 (0.9%) | 21 (2.3%) |
| $10,000 to $12,499 | 56 (6.4%) | 36 (3.9%) |
| $12,500 to $14,999 | 0 (0.0%) | 15 (1.6%) |
| $15,000 to $17,499 | 36 (4.1%) | 0 (0.0%) |
| $17,500 to $19,999 | 0 (0.0%) | 7 (0.8%) |
| $20,000 to $22,499 | 0 (0.0%) | 0 (0.0%) |
| $22,500 to $24,999 | 11 (1.3%) | 81 (8.8%) |
| $25,000 to $29,999 | 60 (6.8%) | 54 (5.9%) |
| $30,000 to $34,999 | 14 (1.6%) | 80 (8.7%) |
| $35,000 to $39,999 | 8 (0.9%) | 68 (7.4%) |
| $40,000 to $44,999 | 8 (0.9%) | 52 (5.7%) |
| $45,000 to $49,999 | 3 (0.3%) | 68 (7.4%) |
| $50,000 to $54,999 | 103 (11.7%) | 50 (5.4%) |
| $55,000 to $64,999 | 60 (6.8%) | 85 (9.3%) |
| $65,000 to $74,999 | 85 (9.7%) | 56 (6.1%) |
| $75,000 to $99,999 | 290 (33.0%) | 127 (13.9%) |
| $100,000+ | 53 (6.0%) | 37 (4.0%) |
| Total | 879 (100.0%) | 917 (100.0%) |
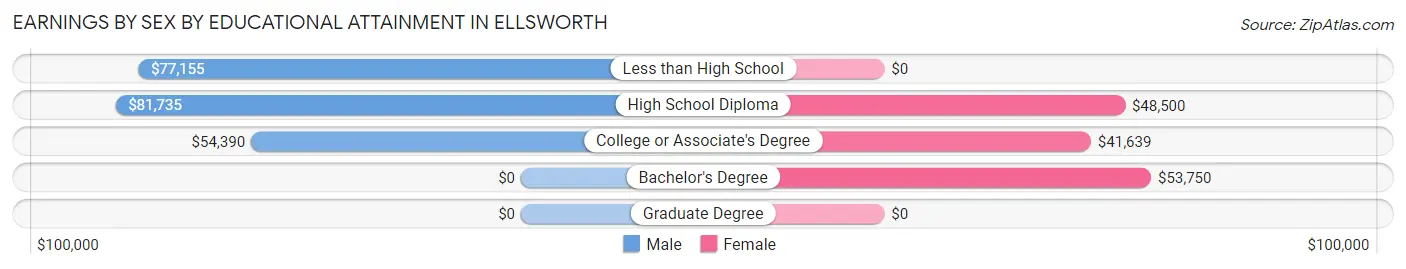
Earnings by Sex by Educational Attainment in Ellsworth
Average earnings in Ellsworth are $70,208 for men and $45,000 for women, a difference of 35.9%. Men with an educational attainment of high school diploma enjoy the highest average annual earnings of $81,735, while those with college or associate's degree education earn the least with $54,390. Women with an educational attainment of bachelor's degree earn the most with the average annual earnings of $53,750, while those with college or associate's degree education have the smallest earnings of $41,639.
| Educational Attainment | Male Income | Female Income |
| Less than High School | $77,155 | $0 |
| High School Diploma | $81,735 | $48,500 |
| College or Associate's Degree | $54,390 | $41,639 |
| Bachelor's Degree | - | - |
| Graduate Degree | - | - |
| Total | $70,208 | $45,000 |
Family Income in Ellsworth
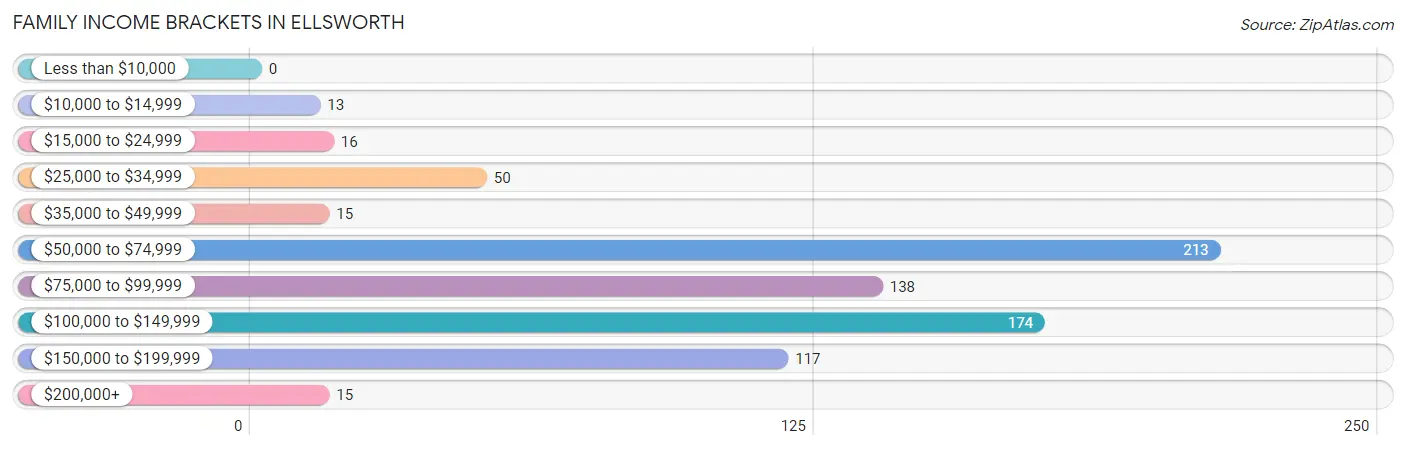
Family Income Brackets in Ellsworth
According to the Ellsworth family income data, there are 213 families falling into the $50,000 to $74,999 income range, which is the most common income bracket and makes up 28.4% of all families.
| Income Bracket | # Families | % Families |
| Less than $10,000 | 0 | 0.0% |
| $10,000 to $14,999 | 13 | 1.7% |
| $15,000 to $24,999 | 16 | 2.1% |
| $25,000 to $34,999 | 50 | 6.7% |
| $35,000 to $49,999 | 15 | 2.0% |
| $50,000 to $74,999 | 213 | 28.4% |
| $75,000 to $99,999 | 138 | 18.4% |
| $100,000 to $149,999 | 174 | 23.2% |
| $150,000 to $199,999 | 117 | 15.6% |
| $200,000+ | 15 | 2.0% |
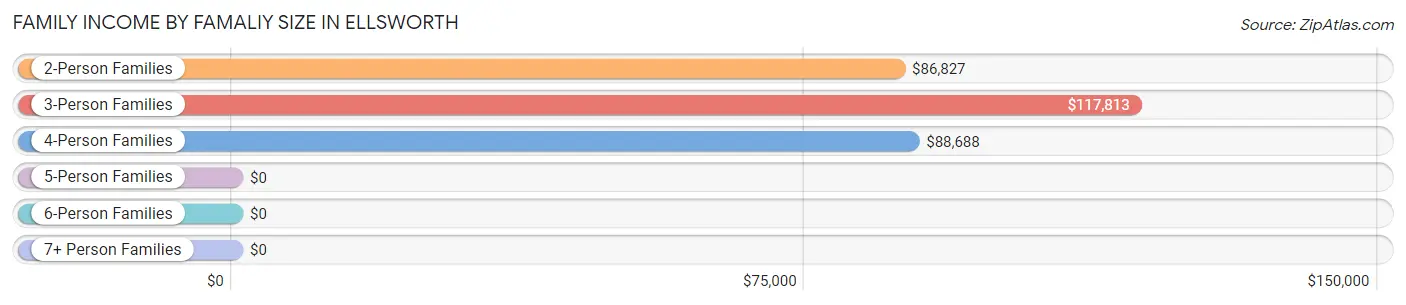
Family Income by Famaliy Size in Ellsworth
3-person families (128 | 17.0%) account for the highest median family income in Ellsworth with $117,813 per family, while 2-person families (397 | 52.9%) have the highest median income of $43,414 per family member.
| Income Bracket | # Families | Median Income |
| 2-Person Families | 397 (52.9%) | $86,827 |
| 3-Person Families | 128 (17.0%) | $117,813 |
| 4-Person Families | 141 (18.8%) | $88,688 |
| 5-Person Families | 19 (2.5%) | $0 |
| 6-Person Families | 0 (0.0%) | $0 |
| 7+ Person Families | 66 (8.8%) | $0 |
| Total | 751 (100.0%) | $88,711 |
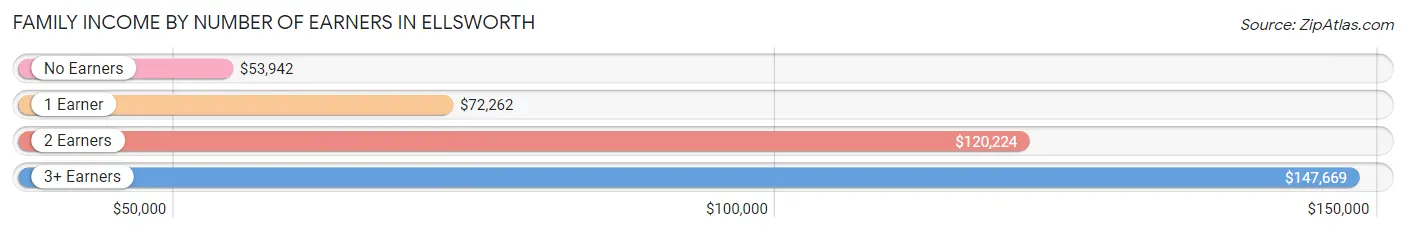
Family Income by Number of Earners in Ellsworth
The median family income in Ellsworth is $88,711, with families comprising 3+ earners (93) having the highest median family income of $147,669, while families with no earners (121) have the lowest median family income of $53,942, accounting for 12.4% and 16.1% of families, respectively.
| Number of Earners | # Families | Median Income |
| No Earners | 121 (16.1%) | $53,942 |
| 1 Earner | 170 (22.6%) | $72,262 |
| 2 Earners | 367 (48.9%) | $120,224 |
| 3+ Earners | 93 (12.4%) | $147,669 |
| Total | 751 (100.0%) | $88,711 |
Household Income in Ellsworth
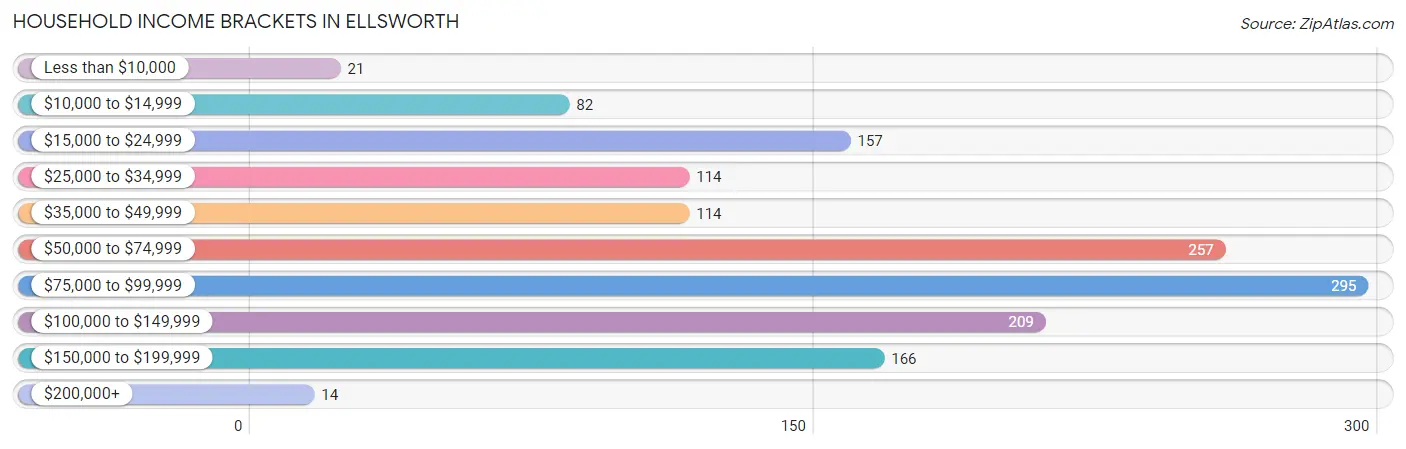
Household Income Brackets in Ellsworth
With 295 households falling in the category, the $75,000 to $99,999 income range is the most frequent in Ellsworth, accounting for 20.6% of all households. In contrast, only 14 households (1.0%) fall into the $200,000+ income bracket, making it the least populous group.
| Income Bracket | # Households | % Households |
| Less than $10,000 | 21 | 1.5% |
| $10,000 to $14,999 | 82 | 5.7% |
| $15,000 to $24,999 | 157 | 11.0% |
| $25,000 to $34,999 | 114 | 8.0% |
| $35,000 to $49,999 | 114 | 8.0% |
| $50,000 to $74,999 | 257 | 18.0% |
| $75,000 to $99,999 | 295 | 20.6% |
| $100,000 to $149,999 | 209 | 14.6% |
| $150,000 to $199,999 | 166 | 11.6% |
| $200,000+ | 14 | 1.0% |
Household Income by Householder Age in Ellsworth
The median household income in Ellsworth is $72,326, with the highest median household income of $87,813 found in the 25 to 44 years age bracket for the primary householder. A total of 526 households (36.8%) fall into this category. Meanwhile, the 15 to 24 years age bracket for the primary householder has the lowest median household income of $0, with 40 households (2.8%) in this group.
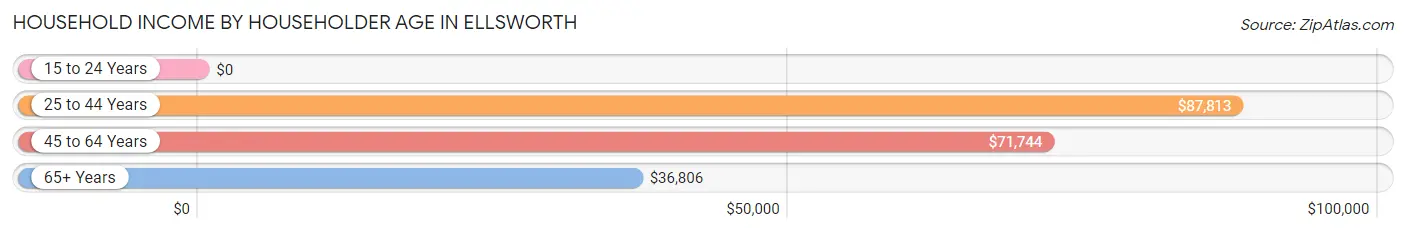
| Income Bracket | # Households | Median Income |
| 15 to 24 Years | 40 (2.8%) | $0 |
| 25 to 44 Years | 526 (36.8%) | $87,813 |
| 45 to 64 Years | 558 (39.0%) | $71,744 |
| 65+ Years | 306 (21.4%) | $36,806 |
| Total | 1,430 (100.0%) | $72,326 |
Poverty in Ellsworth
Income Below Poverty by Sex and Age in Ellsworth
With 6.9% poverty level for males and 10.8% for females among the residents of Ellsworth, 16 and 17 year old males and 16 and 17 year old females are the most vulnerable to poverty, with 8 males (38.1%) and 13 females (28.3%) in their respective age groups living below the poverty level.
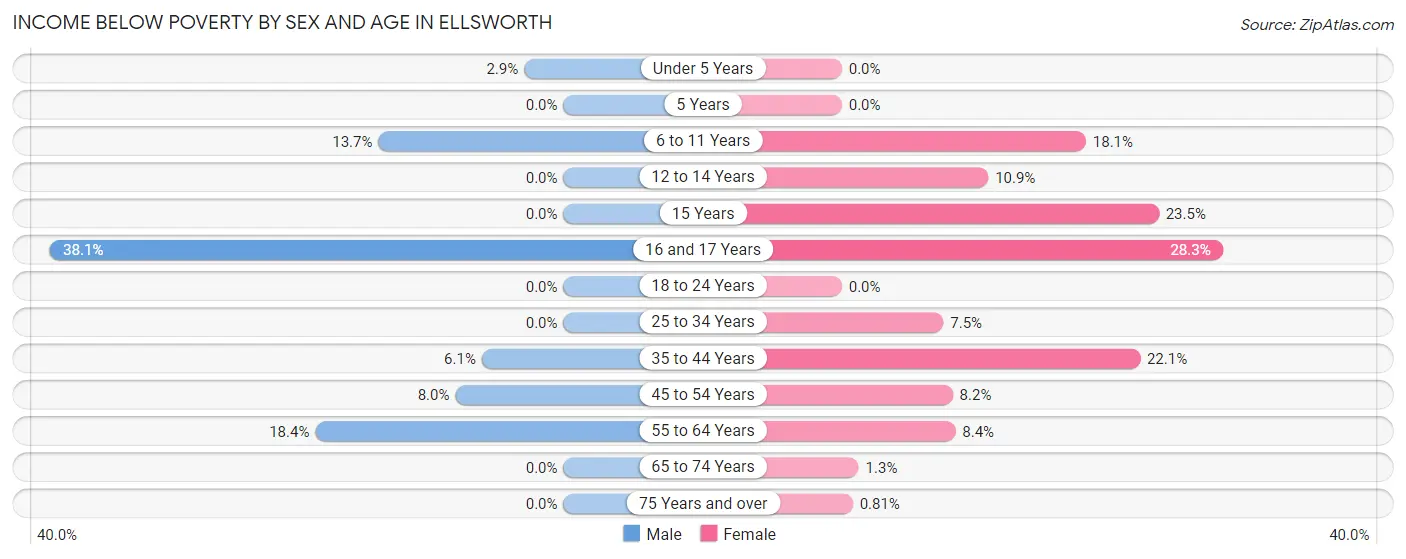
| Age Bracket | Male | Female |
| Under 5 Years | 5 (2.9%) | 0 (0.0%) |
| 5 Years | 0 (0.0%) | 0 (0.0%) |
| 6 to 11 Years | 25 (13.7%) | 29 (18.1%) |
| 12 to 14 Years | 0 (0.0%) | 10 (10.9%) |
| 15 Years | 0 (0.0%) | 12 (23.5%) |
| 16 and 17 Years | 8 (38.1%) | 13 (28.3%) |
| 18 to 24 Years | 0 (0.0%) | 0 (0.0%) |
| 25 to 34 Years | 0 (0.0%) | 15 (7.5%) |
| 35 to 44 Years | 16 (6.1%) | 62 (22.1%) |
| 45 to 54 Years | 15 (8.0%) | 19 (8.2%) |
| 55 to 64 Years | 35 (18.4%) | 21 (8.4%) |
| 65 to 74 Years | 0 (0.0%) | 2 (1.3%) |
| 75 Years and over | 0 (0.0%) | 1 (0.8%) |
| Total | 104 (6.9%) | 184 (10.8%) |
Income Above Poverty by Sex and Age in Ellsworth
According to the poverty statistics in Ellsworth, males aged 5 years and females aged under 5 years are the age groups that are most secure financially, with 100.0% of males and 100.0% of females in these age groups living above the poverty line.
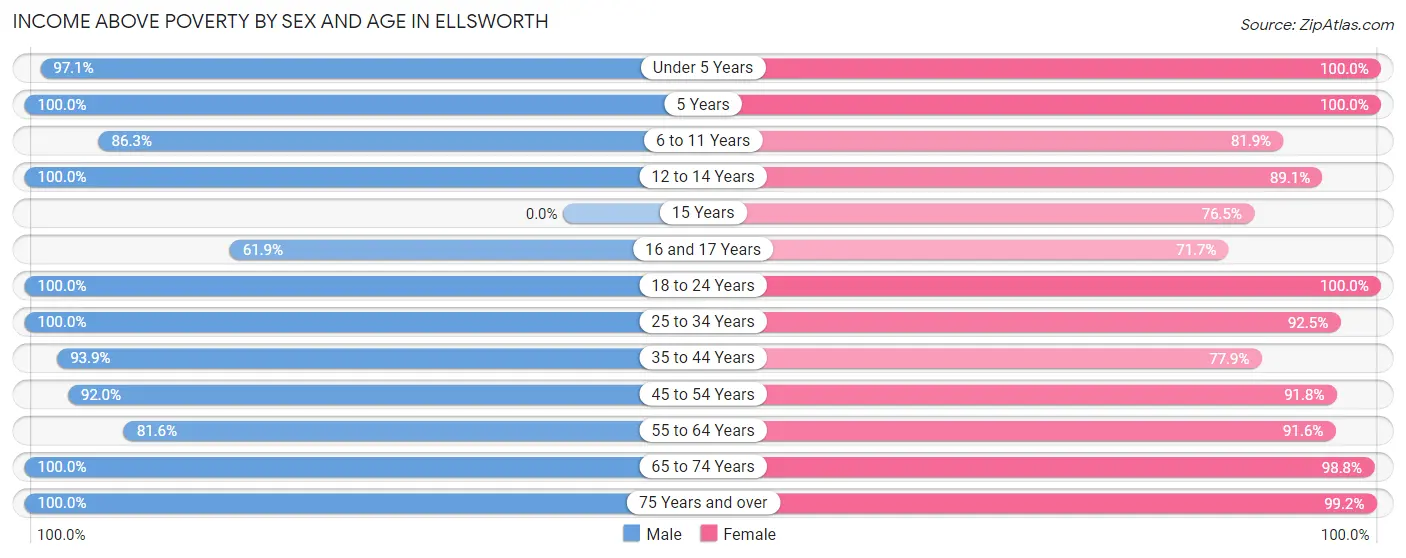
| Age Bracket | Male | Female |
| Under 5 Years | 166 (97.1%) | 35 (100.0%) |
| 5 Years | 4 (100.0%) | 4 (100.0%) |
| 6 to 11 Years | 157 (86.3%) | 131 (81.9%) |
| 12 to 14 Years | 38 (100.0%) | 82 (89.1%) |
| 15 Years | 0 (0.0%) | 39 (76.5%) |
| 16 and 17 Years | 13 (61.9%) | 33 (71.7%) |
| 18 to 24 Years | 123 (100.0%) | 70 (100.0%) |
| 25 to 34 Years | 154 (100.0%) | 184 (92.5%) |
| 35 to 44 Years | 248 (93.9%) | 218 (77.9%) |
| 45 to 54 Years | 172 (92.0%) | 212 (91.8%) |
| 55 to 64 Years | 155 (81.6%) | 228 (91.6%) |
| 65 to 74 Years | 111 (100.0%) | 158 (98.8%) |
| 75 Years and over | 69 (100.0%) | 122 (99.2%) |
| Total | 1,410 (93.1%) | 1,516 (89.2%) |
Income Below Poverty Among Married-Couple Families in Ellsworth
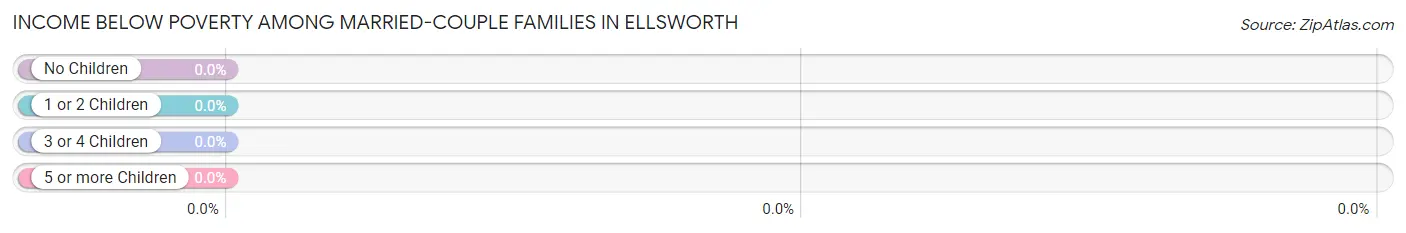
| Children | Above Poverty | Below Poverty |
| No Children | 343 (100.0%) | 0 (0.0%) |
| 1 or 2 Children | 179 (100.0%) | 0 (0.0%) |
| 3 or 4 Children | 44 (100.0%) | 0 (0.0%) |
| 5 or more Children | 29 (100.0%) | 0 (0.0%) |
| Total | 595 (100.0%) | 0 (0.0%) |
Income Below Poverty Among Single-Parent Households in Ellsworth
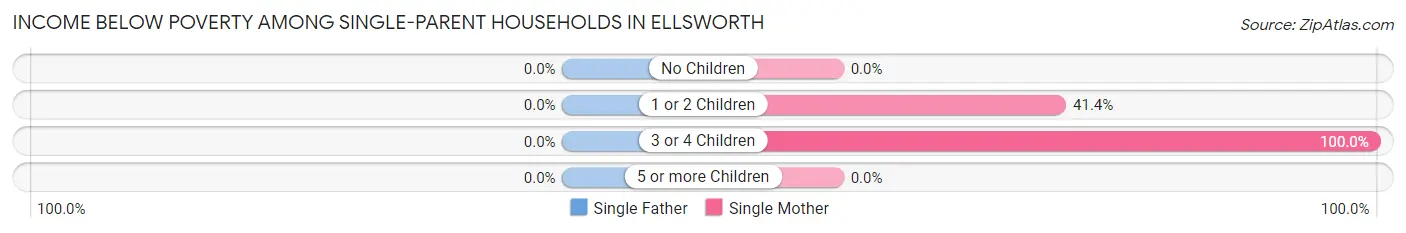
| Children | Single Father | Single Mother |
| No Children | 0 (0.0%) | 0 (0.0%) |
| 1 or 2 Children | 0 (0.0%) | 29 (41.4%) |
| 3 or 4 Children | 0 (0.0%) | 12 (100.0%) |
| 5 or more Children | 0 (0.0%) | 0 (0.0%) |
| Total | 0 (0.0%) | 41 (34.2%) |
Income Below Poverty Among Married-Couple vs Single-Parent Households in Ellsworth
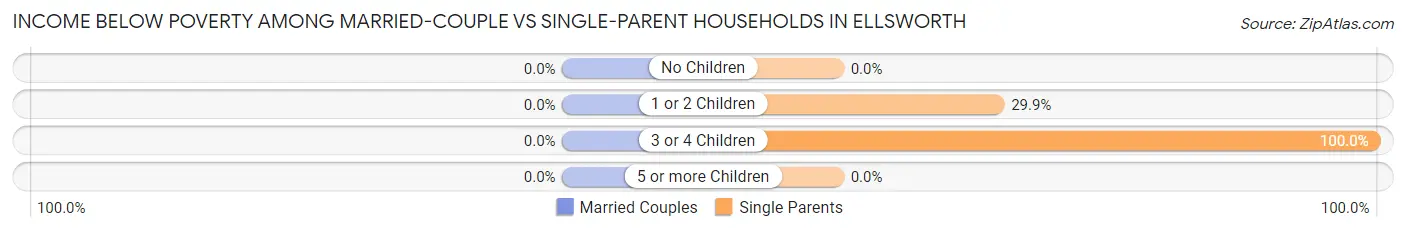
| Children | Married-Couple Families | Single-Parent Households |
| No Children | 0 (0.0%) | 0 (0.0%) |
| 1 or 2 Children | 0 (0.0%) | 29 (29.9%) |
| 3 or 4 Children | 0 (0.0%) | 12 (100.0%) |
| 5 or more Children | 0 (0.0%) | 0 (0.0%) |
| Total | 0 (0.0%) | 41 (26.3%) |
Race in Ellsworth
The most populous races in Ellsworth are White / Caucasian (2,995 | 90.1%), Two or more Races (285 | 8.6%), and Hispanic or Latino (171 | 5.1%).
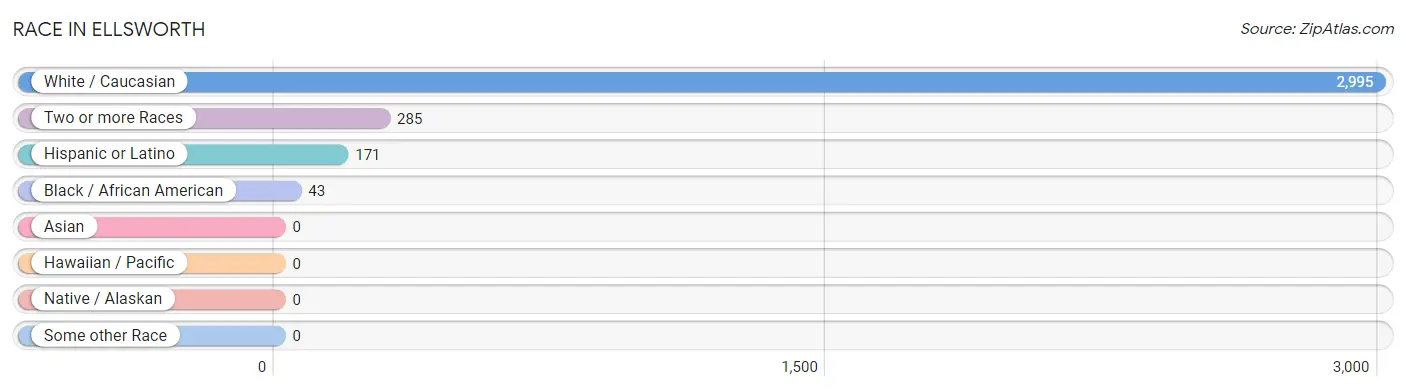
| Race | # Population | % Population |
| Asian | 0 | 0.0% |
| Black / African American | 43 | 1.3% |
| Hawaiian / Pacific | 0 | 0.0% |
| Hispanic or Latino | 171 | 5.1% |
| Native / Alaskan | 0 | 0.0% |
| White / Caucasian | 2,995 | 90.1% |
| Two or more Races | 285 | 8.6% |
| Some other Race | 0 | 0.0% |
| Total | 3,323 | 100.0% |
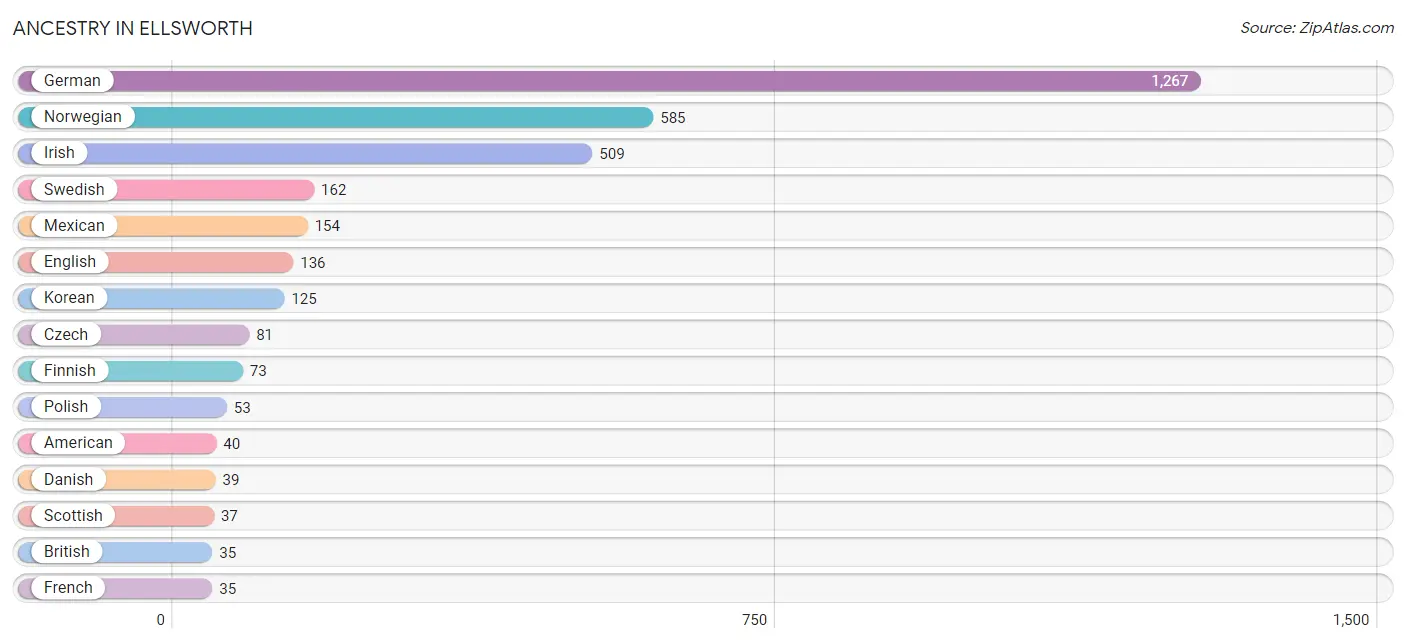
Ancestry in Ellsworth
The most populous ancestries reported in Ellsworth are German (1,267 | 38.1%), Norwegian (585 | 17.6%), Irish (509 | 15.3%), Swedish (162 | 4.9%), and Mexican (154 | 4.6%), together accounting for 80.6% of all Ellsworth residents.
| Ancestry | # Population | % Population |
| American | 40 | 1.2% |
| Arab | 5 | 0.2% |
| Bahamian | 10 | 0.3% |
| British | 35 | 1.1% |
| Cherokee | 12 | 0.4% |
| Czech | 81 | 2.4% |
| Danish | 39 | 1.2% |
| Dutch | 25 | 0.7% |
| English | 136 | 4.1% |
| European | 14 | 0.4% |
| Finnish | 73 | 2.2% |
| French | 35 | 1.1% |
| French Canadian | 34 | 1.0% |
| German | 1,267 | 38.1% |
| Irish | 509 | 15.3% |
| Italian | 17 | 0.5% |
| Korean | 125 | 3.8% |
| Lebanese | 5 | 0.2% |
| Lithuanian | 16 | 0.5% |
| Mexican | 154 | 4.6% |
| Nigerian | 6 | 0.2% |
| Norwegian | 585 | 17.6% |
| Peruvian | 17 | 0.5% |
| Polish | 53 | 1.6% |
| Scandinavian | 20 | 0.6% |
| Scotch-Irish | 35 | 1.1% |
| Scottish | 37 | 1.1% |
| South American | 17 | 0.5% |
| Subsaharan African | 6 | 0.2% |
| Swedish | 162 | 4.9% |
| Yugoslavian | 17 | 0.5% | View All 31 Rows |
Immigrants in Ellsworth
The most numerous immigrant groups reported in Ellsworth came from Latin America (117 | 3.5%), Central America (90 | 2.7%), Mexico (90 | 2.7%), Peru (17 | 0.5%), and South America (17 | 0.5%), together accounting for 10.0% of all Ellsworth residents.
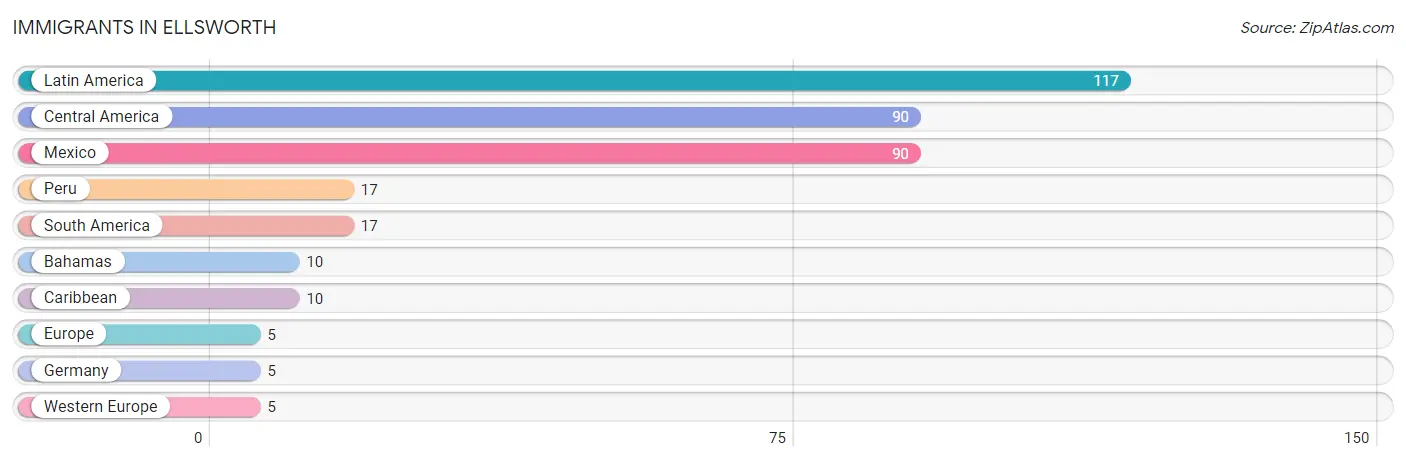
| Immigration Origin | # Population | % Population |
| Bahamas | 10 | 0.3% |
| Caribbean | 10 | 0.3% |
| Central America | 90 | 2.7% |
| Europe | 5 | 0.2% |
| Germany | 5 | 0.2% |
| Latin America | 117 | 3.5% |
| Mexico | 90 | 2.7% |
| Peru | 17 | 0.5% |
| South America | 17 | 0.5% |
| Western Europe | 5 | 0.2% | View All 10 Rows |
Sex and Age in Ellsworth
Sex and Age in Ellsworth
The most populous age groups in Ellsworth are 40 to 44 Years (221 | 14.1%) for men and 55 to 59 Years (202 | 11.5%) for women.
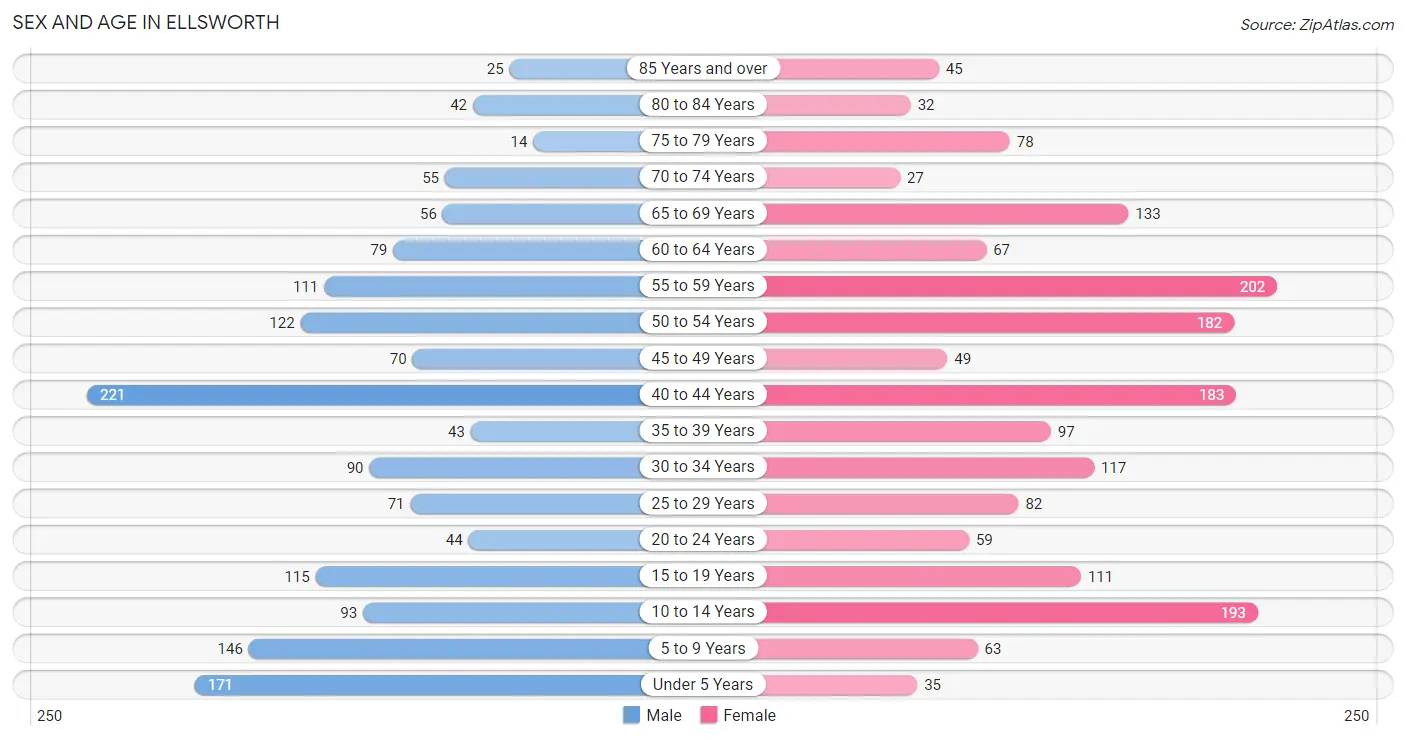
| Age Bracket | Male | Female |
| Under 5 Years | 171 (10.9%) | 35 (2.0%) |
| 5 to 9 Years | 146 (9.3%) | 63 (3.6%) |
| 10 to 14 Years | 93 (5.9%) | 193 (11.0%) |
| 15 to 19 Years | 115 (7.3%) | 111 (6.3%) |
| 20 to 24 Years | 44 (2.8%) | 59 (3.4%) |
| 25 to 29 Years | 71 (4.5%) | 82 (4.7%) |
| 30 to 34 Years | 90 (5.7%) | 117 (6.7%) |
| 35 to 39 Years | 43 (2.7%) | 97 (5.5%) |
| 40 to 44 Years | 221 (14.1%) | 183 (10.4%) |
| 45 to 49 Years | 70 (4.5%) | 49 (2.8%) |
| 50 to 54 Years | 122 (7.8%) | 182 (10.4%) |
| 55 to 59 Years | 111 (7.1%) | 202 (11.5%) |
| 60 to 64 Years | 79 (5.0%) | 67 (3.8%) |
| 65 to 69 Years | 56 (3.6%) | 133 (7.6%) |
| 70 to 74 Years | 55 (3.5%) | 27 (1.5%) |
| 75 to 79 Years | 14 (0.9%) | 78 (4.4%) |
| 80 to 84 Years | 42 (2.7%) | 32 (1.8%) |
| 85 Years and over | 25 (1.6%) | 45 (2.6%) |
| Total | 1,568 (100.0%) | 1,755 (100.0%) |
Families and Households in Ellsworth
Median Family Size in Ellsworth
The median family size in Ellsworth is 3.16 persons per family, with married-couple families (595 | 79.2%) accounting for the largest median family size of 3.35 persons per family. On the other hand, single male/father families (36 | 4.8%) represent the smallest median family size with 2.36 persons per family.
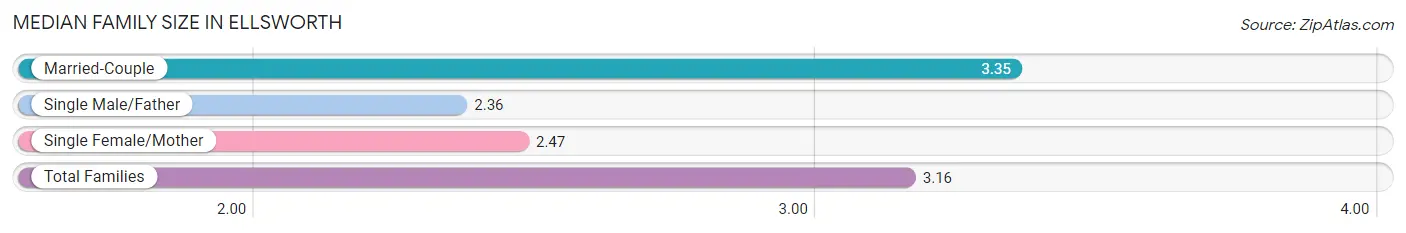
| Family Type | # Families | Family Size |
| Married-Couple | 595 (79.2%) | 3.35 |
| Single Male/Father | 36 (4.8%) | 2.36 |
| Single Female/Mother | 120 (16.0%) | 2.47 |
| Total Families | 751 (100.0%) | 3.16 |
Median Household Size in Ellsworth
The median household size in Ellsworth is 2.23 persons per household, with single male/father households (36 | 2.5%) accounting for the largest median household size of 3.58 persons per household. non-family households (679 | 47.5%) represent the smallest median household size with 1.10 persons per household.
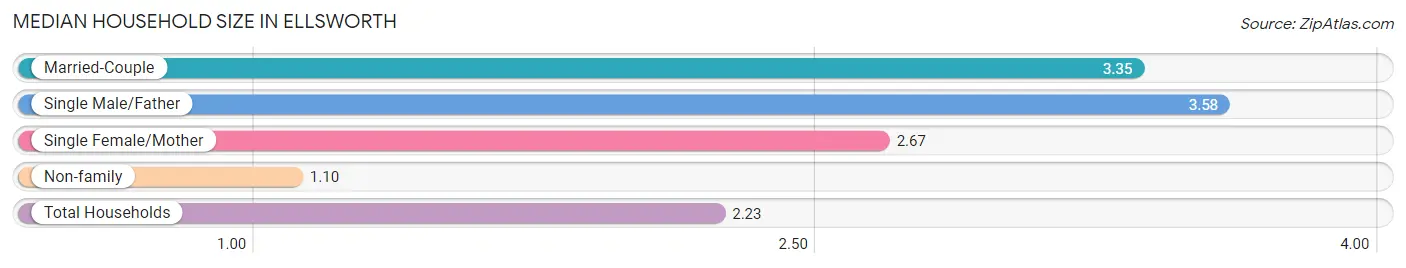
| Household Type | # Households | Household Size |
| Married-Couple | 595 (41.6%) | 3.35 |
| Single Male/Father | 36 (2.5%) | 3.58 |
| Single Female/Mother | 120 (8.4%) | 2.67 |
| Non-family | 679 (47.5%) | 1.10 |
| Total Households | 1,430 (100.0%) | 2.23 |
Household Size by Marriage Status in Ellsworth
Out of a total of 1,430 households in Ellsworth, 751 (52.5%) are family households, while 679 (47.5%) are nonfamily households. The most numerous type of family households are 2-person households, comprising 387, and the most common type of nonfamily households are 1-person households, comprising 625.
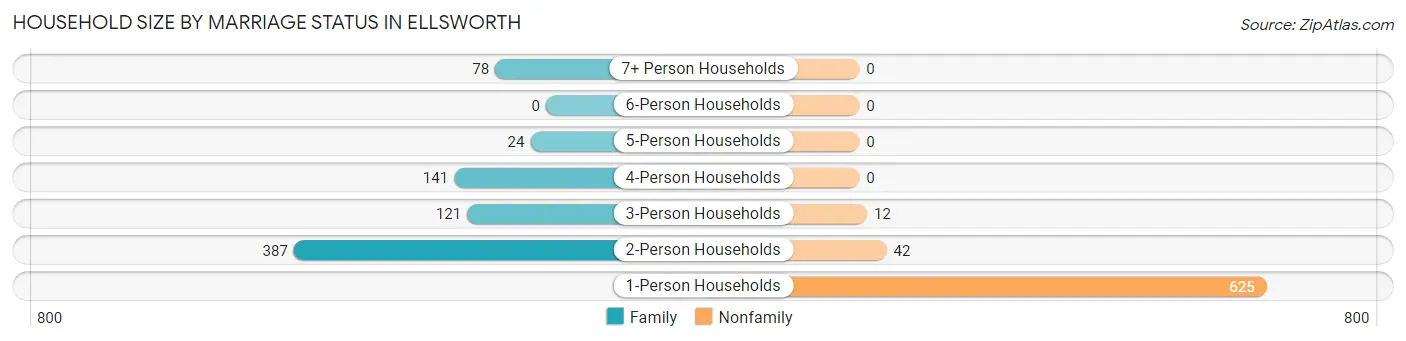
| Household Size | Family Households | Nonfamily Households |
| 1-Person Households | - | 625 (43.7%) |
| 2-Person Households | 387 (27.1%) | 42 (2.9%) |
| 3-Person Households | 121 (8.5%) | 12 (0.8%) |
| 4-Person Households | 141 (9.9%) | 0 (0.0%) |
| 5-Person Households | 24 (1.7%) | 0 (0.0%) |
| 6-Person Households | 0 (0.0%) | 0 (0.0%) |
| 7+ Person Households | 78 (5.4%) | 0 (0.0%) |
| Total | 751 (52.5%) | 679 (47.5%) |
Female Fertility in Ellsworth
Fertility by Age in Ellsworth
Average fertility rate in Ellsworth is 66.0 births per 1,000 women. Women in the age bracket of 20 to 34 years have the highest fertility rate with 174.0 births per 1,000 women. Women in the age bracket of 20 to 34 years acount for 86.5% of all women with births.
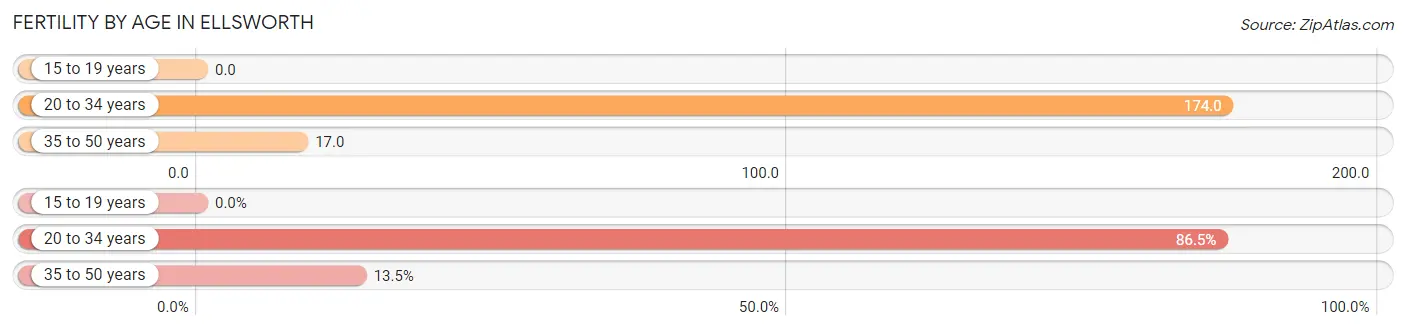
| Age Bracket | Women with Births | Births / 1,000 Women |
| 15 to 19 years | 0 (0.0%) | 0.0 |
| 20 to 34 years | 45 (86.5%) | 174.0 |
| 35 to 50 years | 7 (13.5%) | 17.0 |
| Total | 52 (100.0%) | 66.0 |
Fertility by Age by Marriage Status in Ellsworth
86.5% of women with births (52) in Ellsworth are married. The highest percentage of unmarried women with births falls into 20 to 34 years age bracket with 15.6% of them unmarried at the time of birth, while the lowest percentage of unmarried women with births belong to 35 to 50 years age bracket with 0.0% of them unmarried.
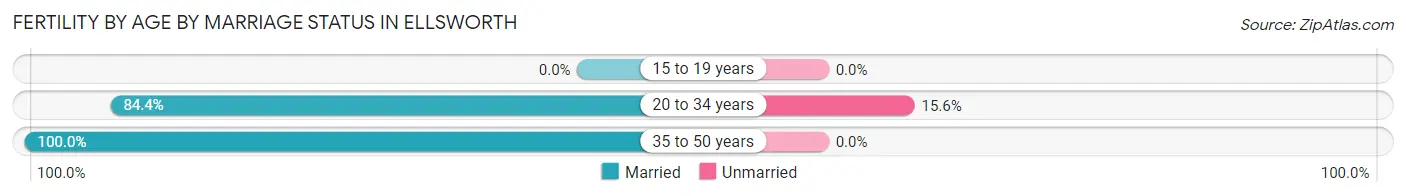
| Age Bracket | Married | Unmarried |
| 15 to 19 years | 0 (0.0%) | 0 (0.0%) |
| 20 to 34 years | 38 (84.4%) | 7 (15.6%) |
| 35 to 50 years | 7 (100.0%) | 0 (0.0%) |
| Total | 45 (86.5%) | 7 (13.5%) |
Fertility by Education in Ellsworth
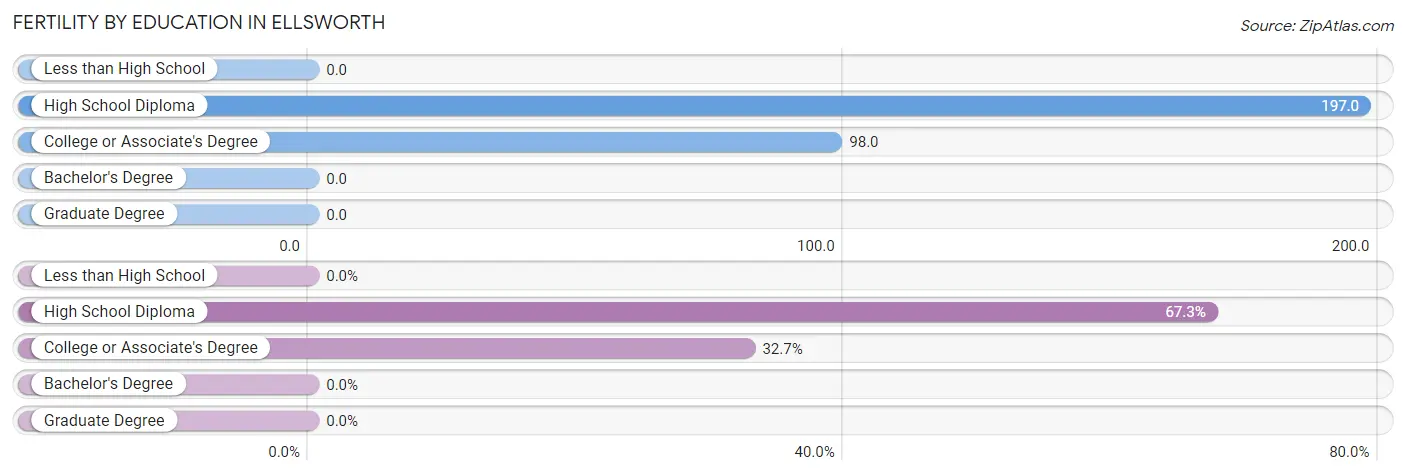
| Educational Attainment | Women with Births | Births / 1,000 Women |
| Less than High School | 0 (0.0%) | 0.0 |
| High School Diploma | 35 (67.3%) | 197.0 |
| College or Associate's Degree | 17 (32.7%) | 98.0 |
| Bachelor's Degree | 0 (0.0%) | 0.0 |
| Graduate Degree | 0 (0.0%) | 0.0 |
| Total | 52 (100.0%) | 66.0 |
Fertility by Education by Marriage Status in Ellsworth
13.5% of women with births in Ellsworth are unmarried. Women with the educational attainment of high school diploma are most likely to be married with 100.0% of them married at childbirth, while women with the educational attainment of college or associate's degree are least likely to be married with 41.2% of them unmarried at childbirth.
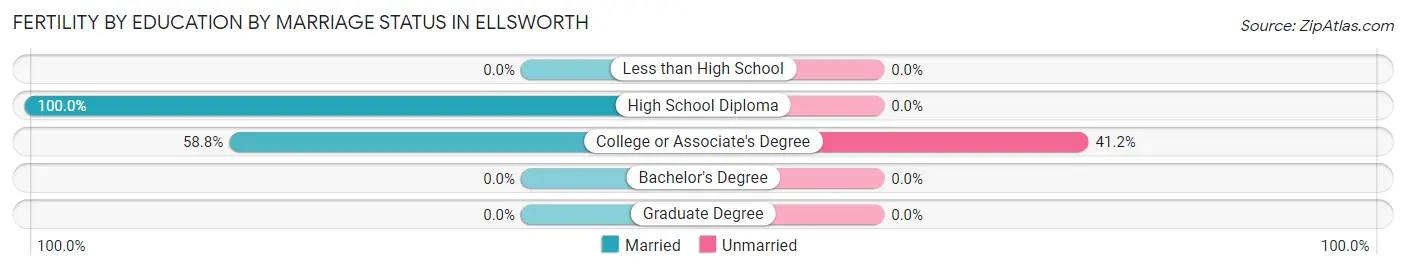
| Educational Attainment | Married | Unmarried |
| Less than High School | 0 (0.0%) | 0 (0.0%) |
| High School Diploma | 35 (100.0%) | 0 (0.0%) |
| College or Associate's Degree | 10 (58.8%) | 7 (41.2%) |
| Bachelor's Degree | 0 (0.0%) | 0 (0.0%) |
| Graduate Degree | 0 (0.0%) | 0 (0.0%) |
| Total | 45 (86.5%) | 7 (13.5%) |
Employment Characteristics in Ellsworth
Employment by Class of Employer in Ellsworth
Among the 1,598 employed individuals in Ellsworth, private company employees (1,157 | 72.4%), local government employees (137 | 8.6%), and not-for-profit organizations (125 | 7.8%) make up the most common classes of employment.
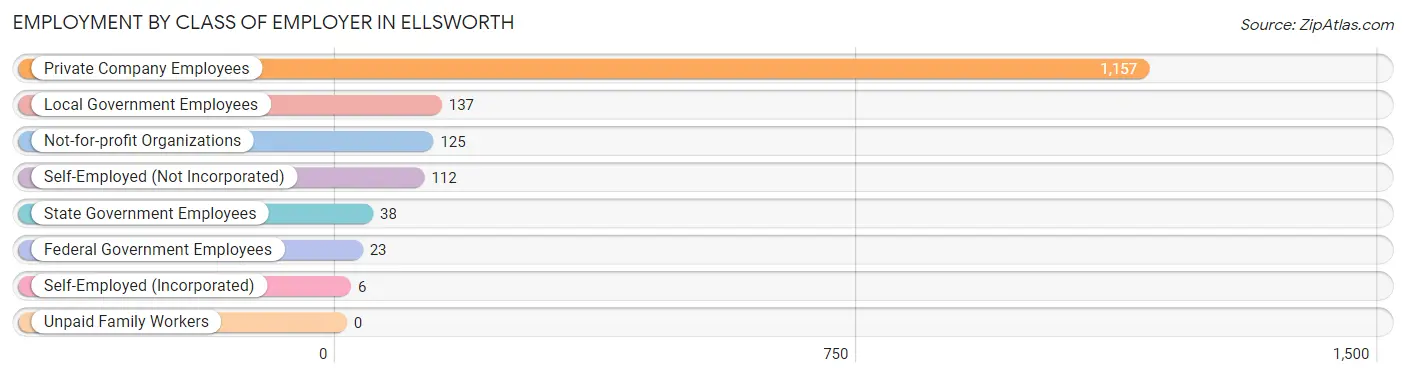
| Employer Class | # Employees | % Employees |
| Private Company Employees | 1,157 | 72.4% |
| Self-Employed (Incorporated) | 6 | 0.4% |
| Self-Employed (Not Incorporated) | 112 | 7.0% |
| Not-for-profit Organizations | 125 | 7.8% |
| Local Government Employees | 137 | 8.6% |
| State Government Employees | 38 | 2.4% |
| Federal Government Employees | 23 | 1.4% |
| Unpaid Family Workers | 0 | 0.0% |
| Total | 1,598 | 100.0% |
Employment Status by Age in Ellsworth
According to the labor force statistics for Ellsworth, out of the total population over 16 years of age (2,571), 67.2% or 1,728 individuals are in the labor force, with 3.9% or 67 of them unemployed. The age group with the highest labor force participation rate is 35 to 44 years, with 90.1% or 490 individuals in the labor force. Within the labor force, the 16 to 19 years age range has the highest percentage of unemployed individuals, with 28.3% or 36 of them being unemployed.
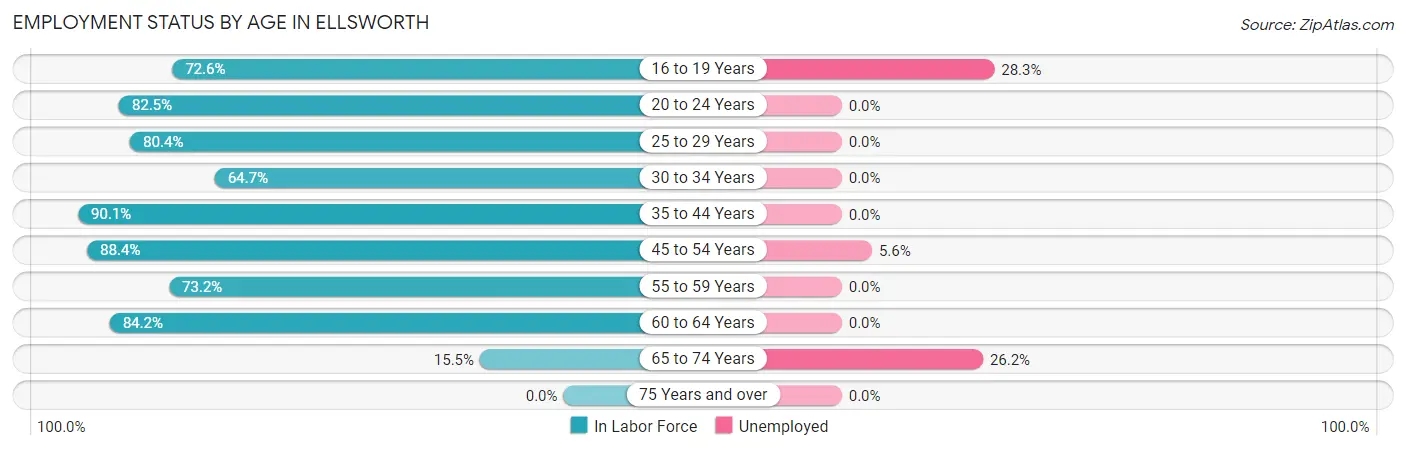
| Age Bracket | In Labor Force | Unemployed |
| 16 to 19 Years | 127 (72.6%) | 36 (28.3%) |
| 20 to 24 Years | 85 (82.5%) | 0 (0.0%) |
| 25 to 29 Years | 123 (80.4%) | 0 (0.0%) |
| 30 to 34 Years | 134 (64.7%) | 0 (0.0%) |
| 35 to 44 Years | 490 (90.1%) | 0 (0.0%) |
| 45 to 54 Years | 374 (88.4%) | 21 (5.6%) |
| 55 to 59 Years | 229 (73.2%) | 0 (0.0%) |
| 60 to 64 Years | 123 (84.2%) | 0 (0.0%) |
| 65 to 74 Years | 42 (15.5%) | 11 (26.2%) |
| 75 Years and over | 0 (0.0%) | 0 (0.0%) |
| Total | 1,728 (67.2%) | 67 (3.9%) |
Employment Status by Educational Attainment in Ellsworth
According to labor force statistics for Ellsworth, 82.5% of individuals (1,473) out of the total population between 25 and 64 years of age (1,786) are in the labor force, with 1.4% or 21 of them being unemployed. The group with the highest labor force participation rate are those with the educational attainment of bachelor's degree or higher, with 94.0% or 313 individuals in the labor force. Within the labor force, individuals with college / associate degree education have the highest percentage of unemployment, with 3.6% or 21 of them being unemployed.
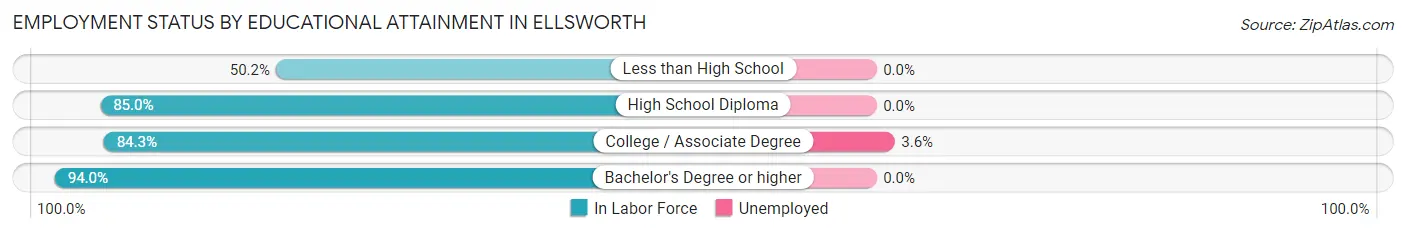
| Educational Attainment | In Labor Force | Unemployed |
| Less than High School | 101 (50.2%) | 0 (0.0%) |
| High School Diploma | 480 (85.0%) | 0 (0.0%) |
| College / Associate Degree | 579 (84.3%) | 25 (3.6%) |
| Bachelor's Degree or higher | 313 (94.0%) | 0 (0.0%) |
| Total | 1,473 (82.5%) | 25 (1.4%) |
Employment Occupations by Sex in Ellsworth
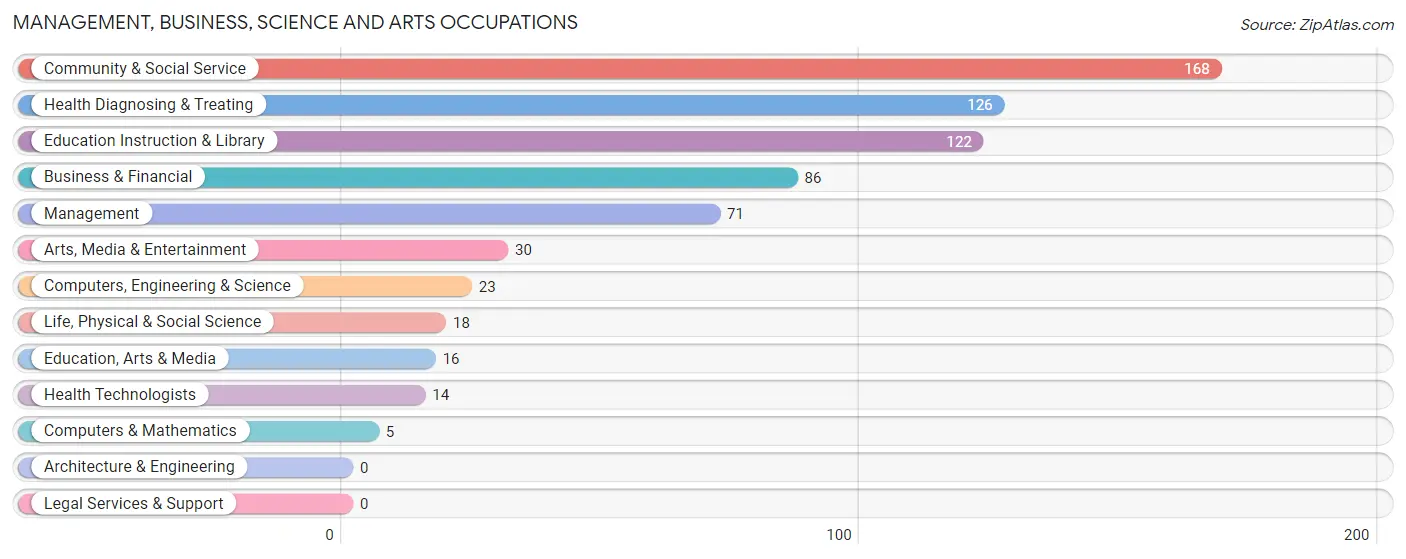
Management, Business, Science and Arts Occupations
The most common Management, Business, Science and Arts occupations in Ellsworth are Community & Social Service (168 | 10.1%), Health Diagnosing & Treating (126 | 7.6%), Education Instruction & Library (122 | 7.3%), Business & Financial (86 | 5.2%), and Management (71 | 4.3%).
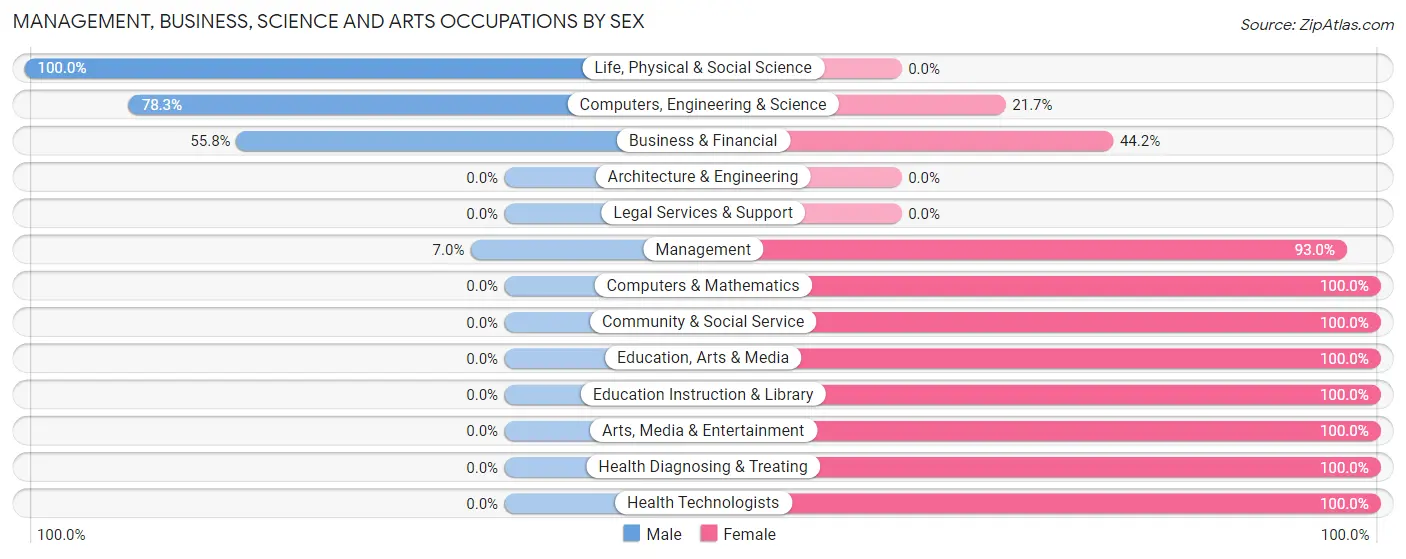
Management, Business, Science and Arts Occupations by Sex
Within the Management, Business, Science and Arts occupations in Ellsworth, the most male-oriented occupations are Life, Physical & Social Science (100.0%), Computers, Engineering & Science (78.3%), and Business & Financial (55.8%), while the most female-oriented occupations are Computers & Mathematics (100.0%), Community & Social Service (100.0%), and Education, Arts & Media (100.0%).
| Occupation | Male | Female |
| Management | 5 (7.0%) | 66 (93.0%) |
| Business & Financial | 48 (55.8%) | 38 (44.2%) |
| Computers, Engineering & Science | 18 (78.3%) | 5 (21.7%) |
| Computers & Mathematics | 0 (0.0%) | 5 (100.0%) |
| Architecture & Engineering | 0 (0.0%) | 0 (0.0%) |
| Life, Physical & Social Science | 18 (100.0%) | 0 (0.0%) |
| Community & Social Service | 0 (0.0%) | 168 (100.0%) |
| Education, Arts & Media | 0 (0.0%) | 16 (100.0%) |
| Legal Services & Support | 0 (0.0%) | 0 (0.0%) |
| Education Instruction & Library | 0 (0.0%) | 122 (100.0%) |
| Arts, Media & Entertainment | 0 (0.0%) | 30 (100.0%) |
| Health Diagnosing & Treating | 0 (0.0%) | 126 (100.0%) |
| Health Technologists | 0 (0.0%) | 14 (100.0%) |
| Total (Category) | 71 (15.0%) | 403 (85.0%) |
| Total (Overall) | 770 (46.4%) | 889 (53.6%) |
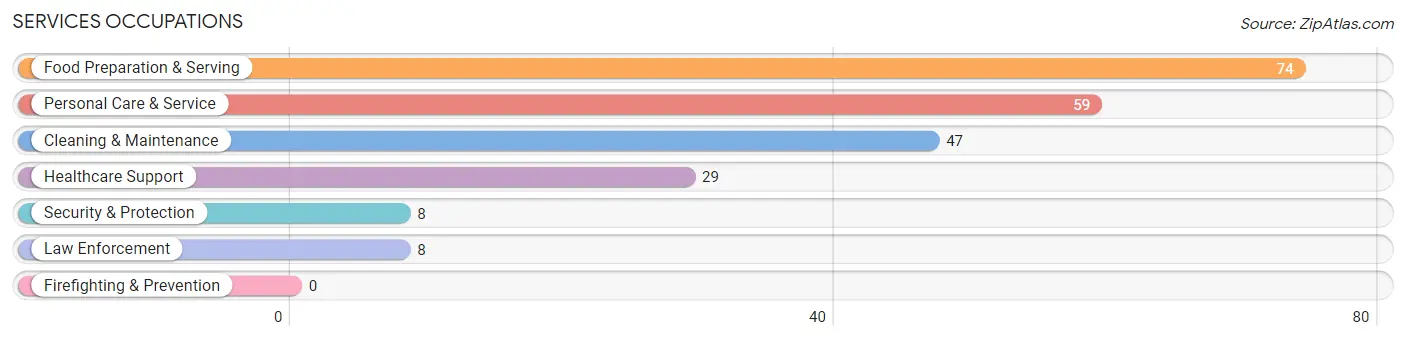
Services Occupations
The most common Services occupations in Ellsworth are Food Preparation & Serving (74 | 4.5%), Personal Care & Service (59 | 3.6%), Cleaning & Maintenance (47 | 2.8%), Healthcare Support (29 | 1.8%), and Security & Protection (8 | 0.5%).
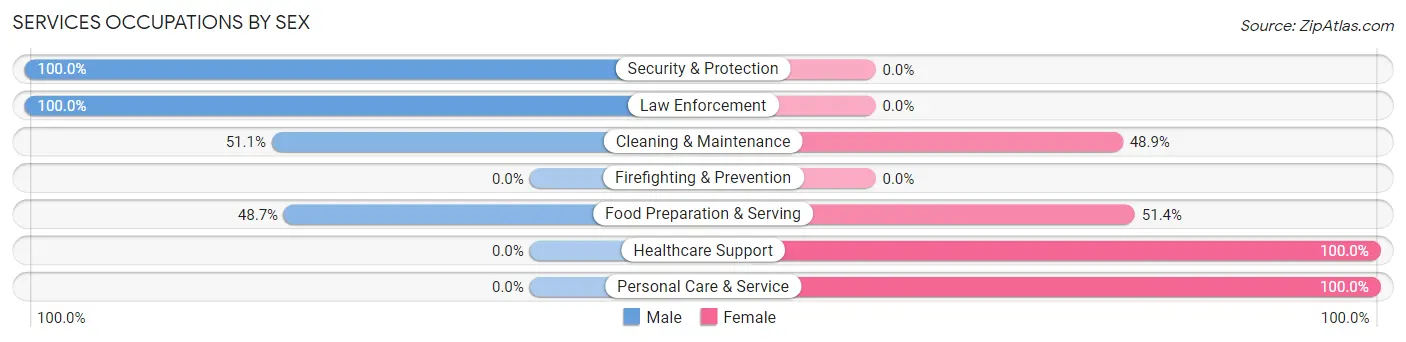
Services Occupations by Sex
Within the Services occupations in Ellsworth, the most male-oriented occupations are Security & Protection (100.0%), Law Enforcement (100.0%), and Cleaning & Maintenance (51.1%), while the most female-oriented occupations are Healthcare Support (100.0%), Personal Care & Service (100.0%), and Food Preparation & Serving (51.3%).
| Occupation | Male | Female |
| Healthcare Support | 0 (0.0%) | 29 (100.0%) |
| Security & Protection | 8 (100.0%) | 0 (0.0%) |
| Firefighting & Prevention | 0 (0.0%) | 0 (0.0%) |
| Law Enforcement | 8 (100.0%) | 0 (0.0%) |
| Food Preparation & Serving | 36 (48.6%) | 38 (51.3%) |
| Cleaning & Maintenance | 24 (51.1%) | 23 (48.9%) |
| Personal Care & Service | 0 (0.0%) | 59 (100.0%) |
| Total (Category) | 68 (31.3%) | 149 (68.7%) |
| Total (Overall) | 770 (46.4%) | 889 (53.6%) |
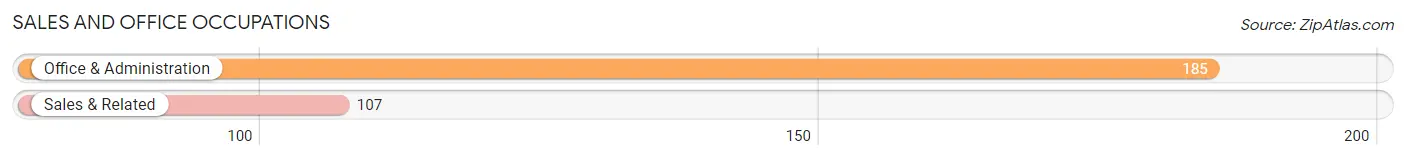
Sales and Office Occupations
The most common Sales and Office occupations in Ellsworth are Office & Administration (185 | 11.2%), and Sales & Related (107 | 6.5%).
Sales and Office Occupations by Sex
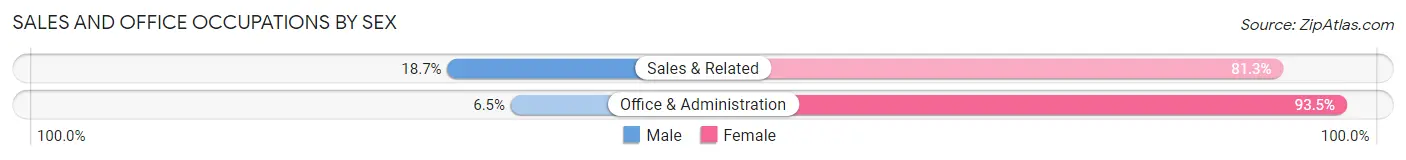
| Occupation | Male | Female |
| Sales & Related | 20 (18.7%) | 87 (81.3%) |
| Office & Administration | 12 (6.5%) | 173 (93.5%) |
| Total (Category) | 32 (11.0%) | 260 (89.0%) |
| Total (Overall) | 770 (46.4%) | 889 (53.6%) |
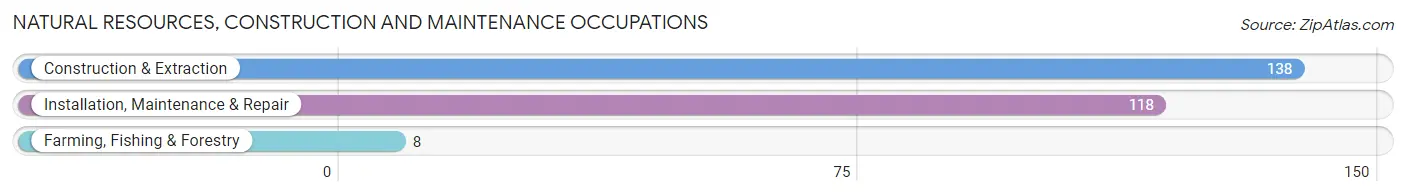
Natural Resources, Construction and Maintenance Occupations
The most common Natural Resources, Construction and Maintenance occupations in Ellsworth are Construction & Extraction (138 | 8.3%), Installation, Maintenance & Repair (118 | 7.1%), and Farming, Fishing & Forestry (8 | 0.5%).
Natural Resources, Construction and Maintenance Occupations by Sex
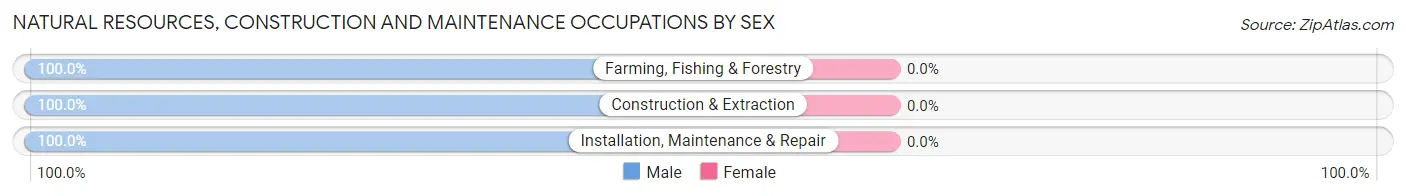
| Occupation | Male | Female |
| Farming, Fishing & Forestry | 8 (100.0%) | 0 (0.0%) |
| Construction & Extraction | 138 (100.0%) | 0 (0.0%) |
| Installation, Maintenance & Repair | 118 (100.0%) | 0 (0.0%) |
| Total (Category) | 264 (100.0%) | 0 (0.0%) |
| Total (Overall) | 770 (46.4%) | 889 (53.6%) |
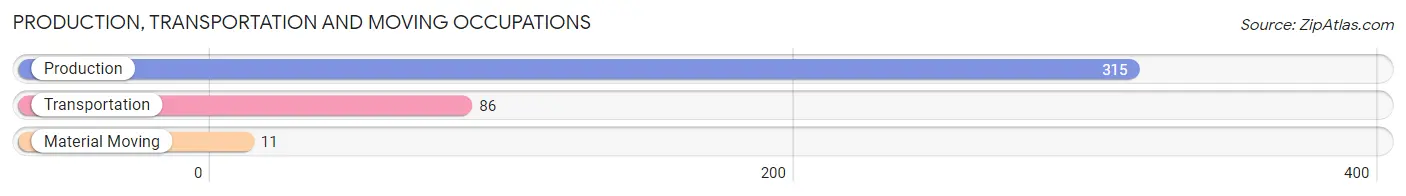
Production, Transportation and Moving Occupations
The most common Production, Transportation and Moving occupations in Ellsworth are Production (315 | 19.0%), Transportation (86 | 5.2%), and Material Moving (11 | 0.7%).
Production, Transportation and Moving Occupations by Sex
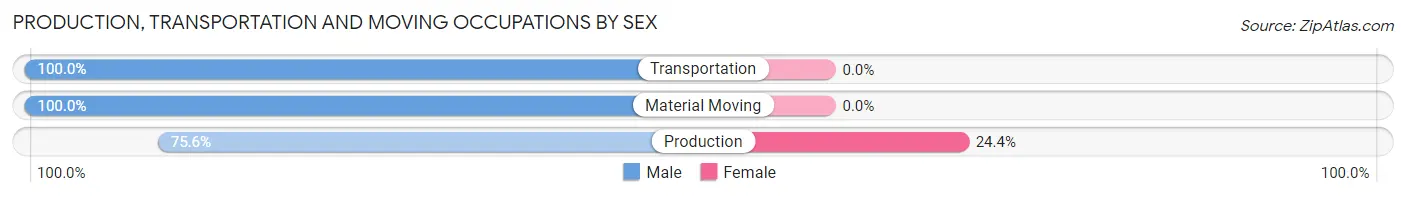
| Occupation | Male | Female |
| Production | 238 (75.6%) | 77 (24.4%) |
| Transportation | 86 (100.0%) | 0 (0.0%) |
| Material Moving | 11 (100.0%) | 0 (0.0%) |
| Total (Category) | 335 (81.3%) | 77 (18.7%) |
| Total (Overall) | 770 (46.4%) | 889 (53.6%) |
Employment Industries by Sex in Ellsworth
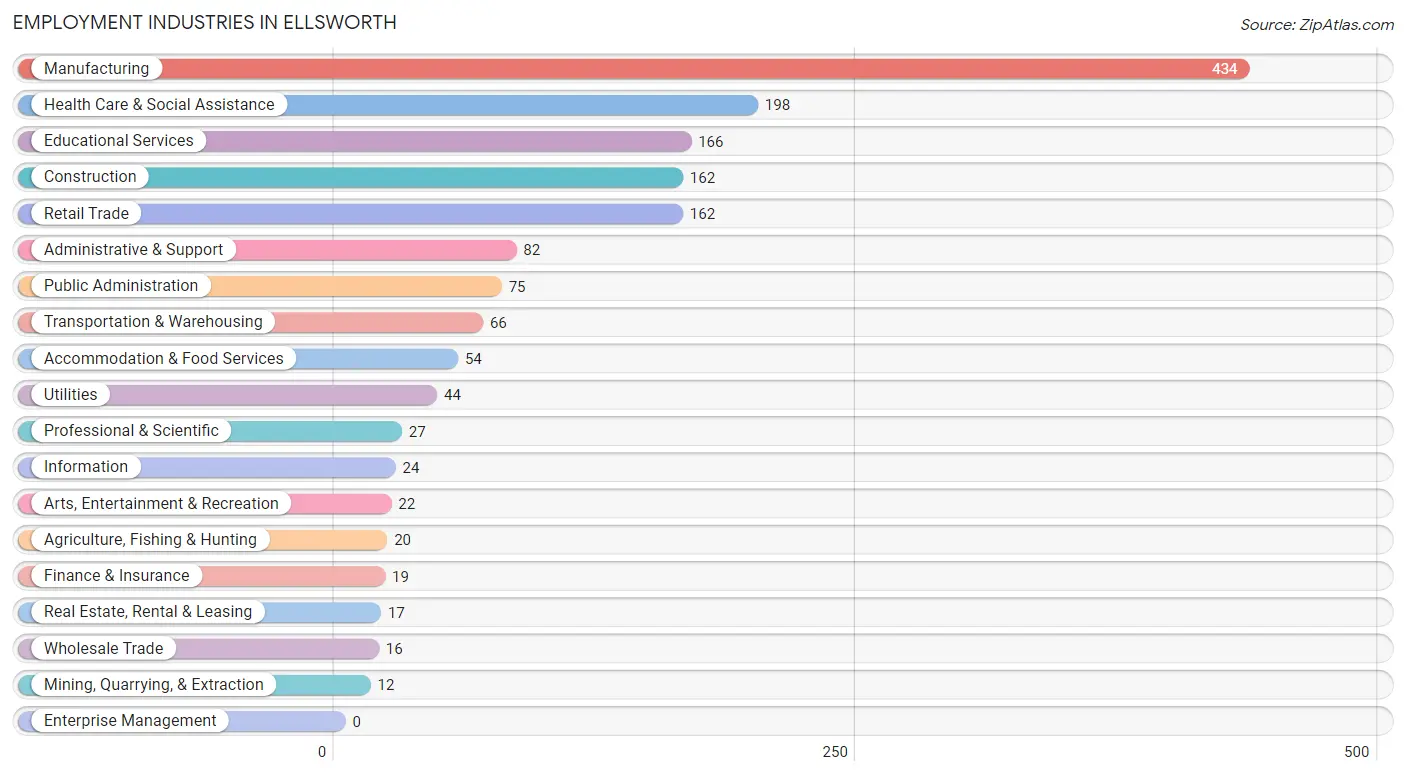
Employment Industries in Ellsworth
The major employment industries in Ellsworth include Manufacturing (434 | 26.2%), Health Care & Social Assistance (198 | 11.9%), Educational Services (166 | 10.0%), Construction (162 | 9.8%), and Retail Trade (162 | 9.8%).
Employment Industries by Sex in Ellsworth
The Ellsworth industries that see more men than women are Agriculture, Fishing & Hunting (100.0%), Mining, Quarrying, & Extraction (100.0%), and Construction (100.0%), whereas the industries that tend to have a higher number of women are Finance & Insurance (100.0%), Real Estate, Rental & Leasing (100.0%), and Professional & Scientific (100.0%).
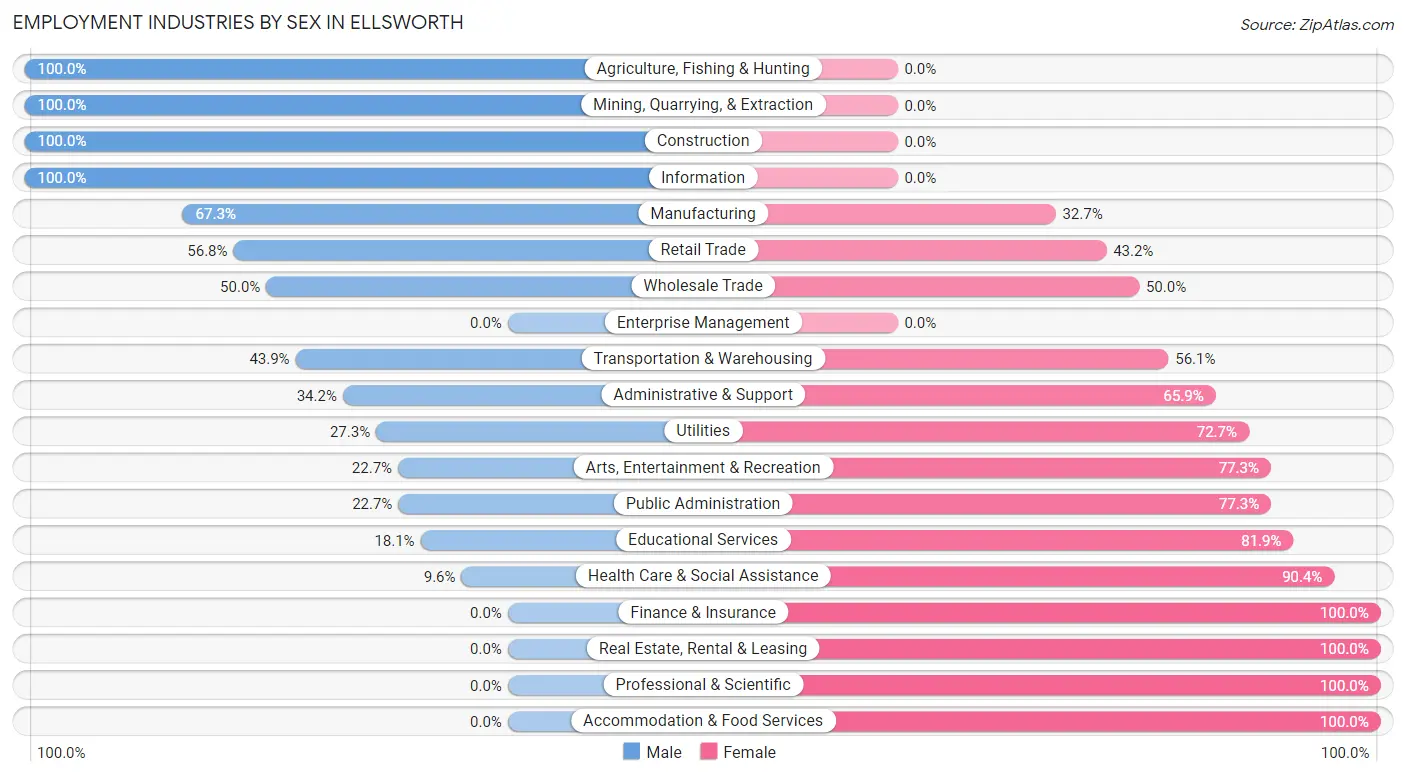
| Industry | Male | Female |
| Agriculture, Fishing & Hunting | 20 (100.0%) | 0 (0.0%) |
| Mining, Quarrying, & Extraction | 12 (100.0%) | 0 (0.0%) |
| Construction | 162 (100.0%) | 0 (0.0%) |
| Manufacturing | 292 (67.3%) | 142 (32.7%) |
| Wholesale Trade | 8 (50.0%) | 8 (50.0%) |
| Retail Trade | 92 (56.8%) | 70 (43.2%) |
| Transportation & Warehousing | 29 (43.9%) | 37 (56.1%) |
| Utilities | 12 (27.3%) | 32 (72.7%) |
| Information | 24 (100.0%) | 0 (0.0%) |
| Finance & Insurance | 0 (0.0%) | 19 (100.0%) |
| Real Estate, Rental & Leasing | 0 (0.0%) | 17 (100.0%) |
| Professional & Scientific | 0 (0.0%) | 27 (100.0%) |
| Enterprise Management | 0 (0.0%) | 0 (0.0%) |
| Administrative & Support | 28 (34.2%) | 54 (65.8%) |
| Educational Services | 30 (18.1%) | 136 (81.9%) |
| Health Care & Social Assistance | 19 (9.6%) | 179 (90.4%) |
| Arts, Entertainment & Recreation | 5 (22.7%) | 17 (77.3%) |
| Accommodation & Food Services | 0 (0.0%) | 54 (100.0%) |
| Public Administration | 17 (22.7%) | 58 (77.3%) |
| Total | 770 (46.4%) | 889 (53.6%) |
Education in Ellsworth
School Enrollment in Ellsworth
The most common levels of schooling among the 716 students in Ellsworth are elementary school (255 | 35.6%), middle school (176 | 24.6%), and high school (145 | 20.3%).
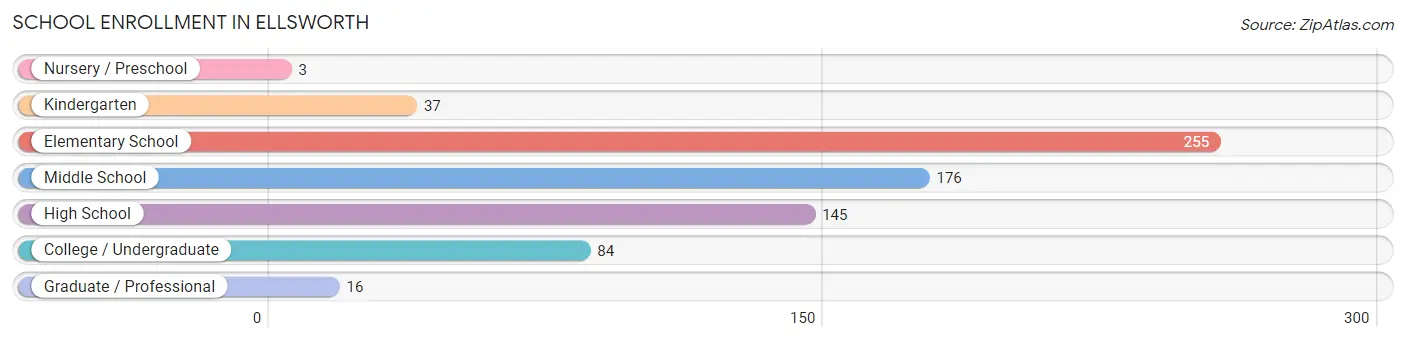
| School Level | # Students | % Students |
| Nursery / Preschool | 3 | 0.4% |
| Kindergarten | 37 | 5.2% |
| Elementary School | 255 | 35.6% |
| Middle School | 176 | 24.6% |
| High School | 145 | 20.3% |
| College / Undergraduate | 84 | 11.7% |
| Graduate / Professional | 16 | 2.2% |
| Total | 716 | 100.0% |
School Enrollment by Age by Funding Source in Ellsworth
Out of a total of 716 students who are enrolled in schools in Ellsworth, 42 (5.9%) attend a private institution, while the remaining 674 (94.1%) are enrolled in public schools. The age group of 35 years and over has the highest likelihood of being enrolled in private schools, with 12 (34.3% in the age bracket) enrolled. Conversely, the age group of 3 to 4 year olds has the lowest likelihood of being enrolled in a private school, with 3 (100.0% in the age bracket) attending a public institution.
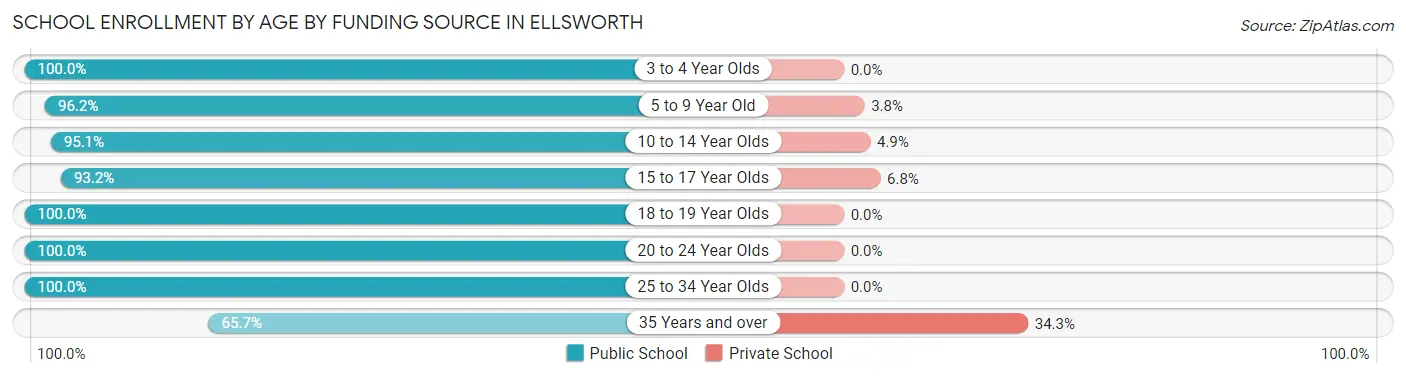
| Age Bracket | Public School | Private School |
| 3 to 4 Year Olds | 3 (100.0%) | 0 (0.0%) |
| 5 to 9 Year Old | 201 (96.2%) | 8 (3.8%) |
| 10 to 14 Year Olds | 272 (95.1%) | 14 (4.9%) |
| 15 to 17 Year Olds | 110 (93.2%) | 8 (6.8%) |
| 18 to 19 Year Olds | 36 (100.0%) | 0 (0.0%) |
| 20 to 24 Year Olds | 16 (100.0%) | 0 (0.0%) |
| 25 to 34 Year Olds | 13 (100.0%) | 0 (0.0%) |
| 35 Years and over | 23 (65.7%) | 12 (34.3%) |
| Total | 674 (94.1%) | 42 (5.9%) |
Educational Attainment by Field of Study in Ellsworth
Psychology (106 | 24.4%), business (72 | 16.6%), education (53 | 12.2%), bio, nature & agricultural (50 | 11.5%), and engineering (32 | 7.4%) are the most common fields of study among 435 individuals in Ellsworth who have obtained a bachelor's degree or higher.
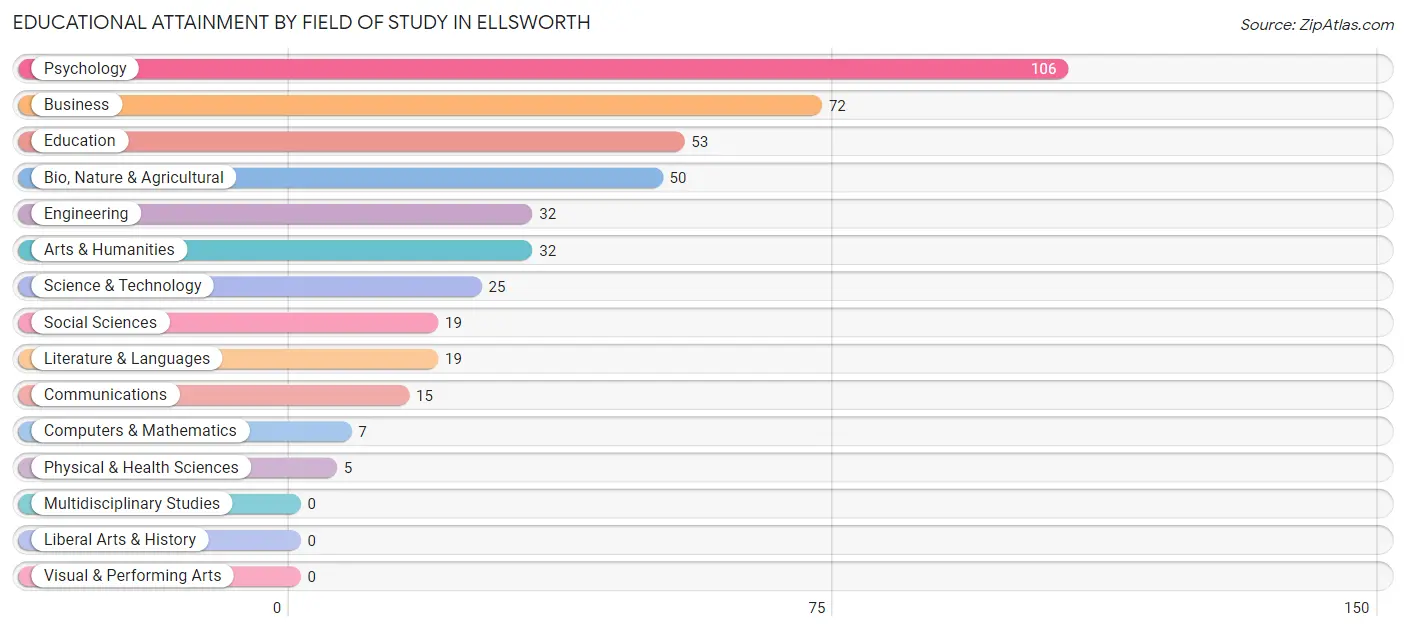
| Field of Study | # Graduates | % Graduates |
| Computers & Mathematics | 7 | 1.6% |
| Bio, Nature & Agricultural | 50 | 11.5% |
| Physical & Health Sciences | 5 | 1.1% |
| Psychology | 106 | 24.4% |
| Social Sciences | 19 | 4.4% |
| Engineering | 32 | 7.4% |
| Multidisciplinary Studies | 0 | 0.0% |
| Science & Technology | 25 | 5.8% |
| Business | 72 | 16.6% |
| Education | 53 | 12.2% |
| Literature & Languages | 19 | 4.4% |
| Liberal Arts & History | 0 | 0.0% |
| Visual & Performing Arts | 0 | 0.0% |
| Communications | 15 | 3.5% |
| Arts & Humanities | 32 | 7.4% |
| Total | 435 | 100.0% |
Transportation & Commute in Ellsworth
Vehicle Availability by Sex in Ellsworth
The most prevalent vehicle ownership categories in Ellsworth are males with 2 vehicles (311, accounting for 41.7%) and females with 2 vehicles (275, making up 36.5%).
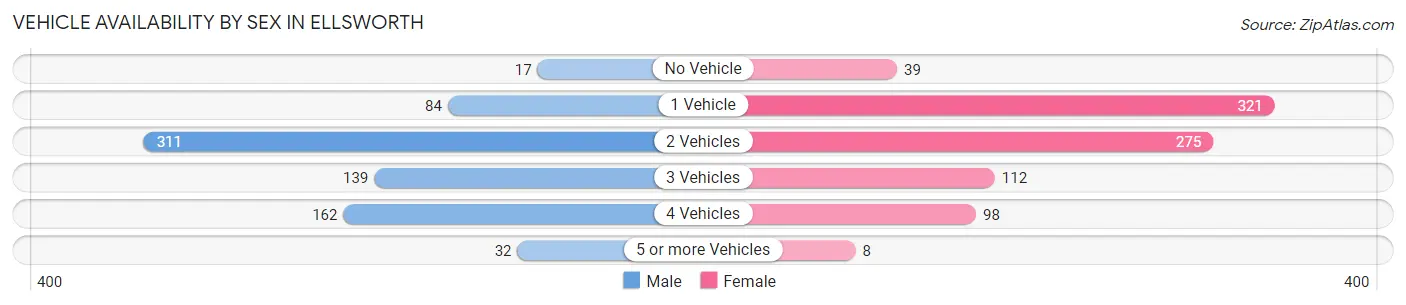
| Vehicles Available | Male | Female |
| No Vehicle | 17 (2.3%) | 39 (4.6%) |
| 1 Vehicle | 84 (11.3%) | 321 (37.6%) |
| 2 Vehicles | 311 (41.7%) | 275 (32.2%) |
| 3 Vehicles | 139 (18.7%) | 112 (13.1%) |
| 4 Vehicles | 162 (21.7%) | 98 (11.5%) |
| 5 or more Vehicles | 32 (4.3%) | 8 (0.9%) |
| Total | 745 (100.0%) | 853 (100.0%) |
Commute Time in Ellsworth
The most frequently occuring commute durations in Ellsworth are 5 to 9 minutes (274 commuters, 18.8%), 30 to 34 minutes (215 commuters, 14.8%), and 20 to 24 minutes (148 commuters, 10.2%).
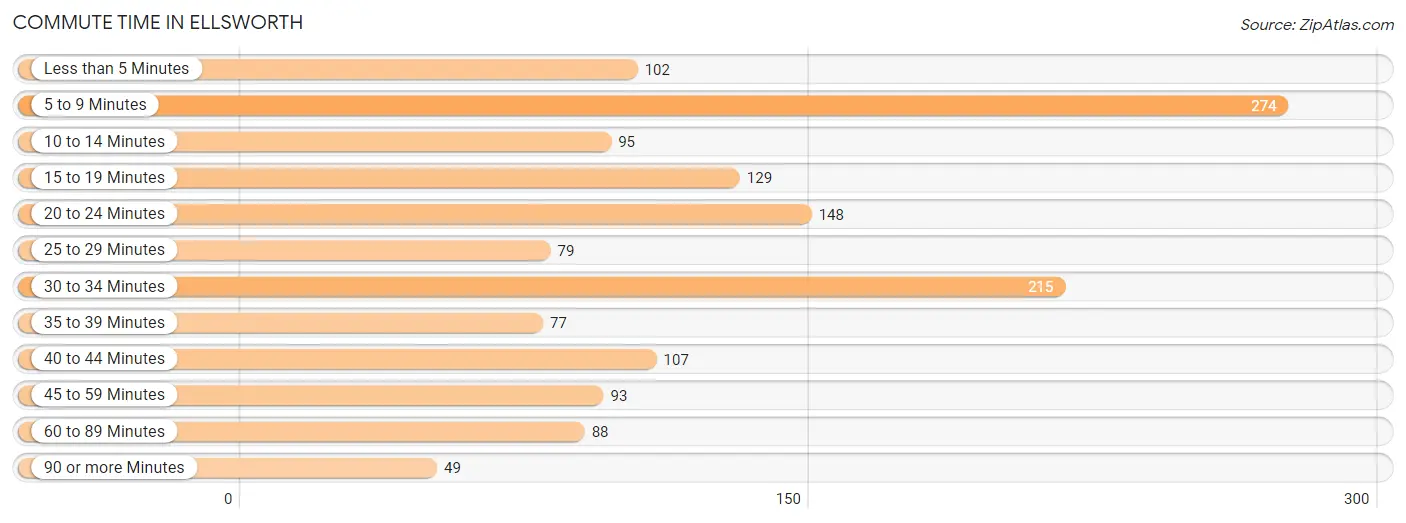
| Commute Time | # Commuters | % Commuters |
| Less than 5 Minutes | 102 | 7.0% |
| 5 to 9 Minutes | 274 | 18.8% |
| 10 to 14 Minutes | 95 | 6.5% |
| 15 to 19 Minutes | 129 | 8.9% |
| 20 to 24 Minutes | 148 | 10.2% |
| 25 to 29 Minutes | 79 | 5.4% |
| 30 to 34 Minutes | 215 | 14.8% |
| 35 to 39 Minutes | 77 | 5.3% |
| 40 to 44 Minutes | 107 | 7.3% |
| 45 to 59 Minutes | 93 | 6.4% |
| 60 to 89 Minutes | 88 | 6.0% |
| 90 or more Minutes | 49 | 3.4% |
Commute Time by Sex in Ellsworth
The most common commute times in Ellsworth are 30 to 34 minutes (127 commuters, 17.5%) for males and 5 to 9 minutes (207 commuters, 28.3%) for females.
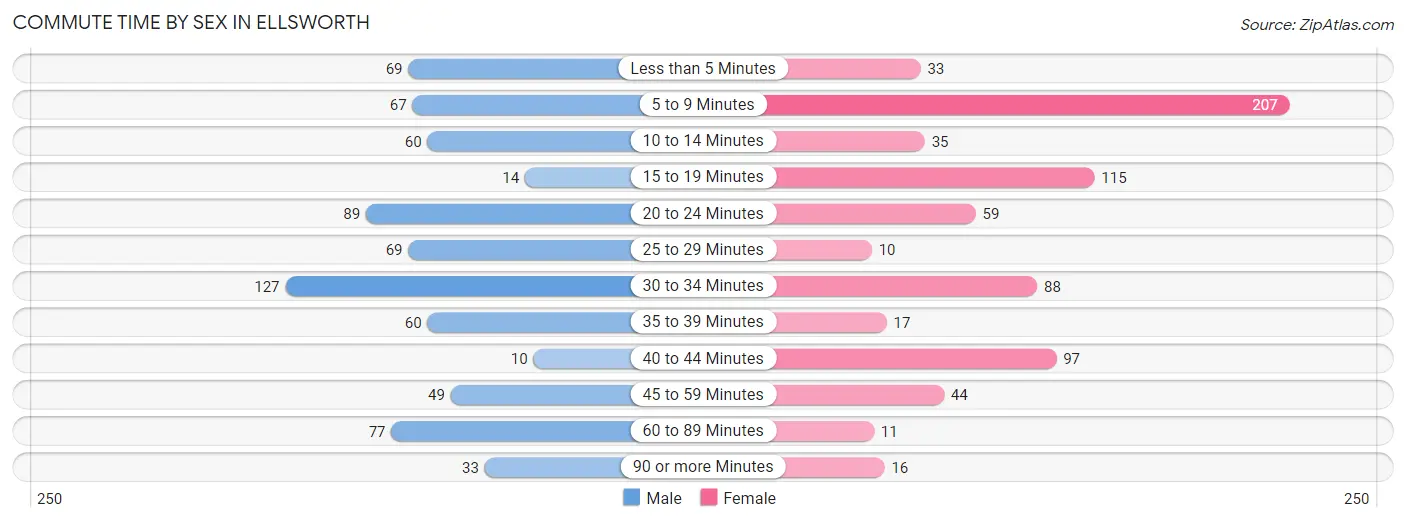
| Commute Time | Male | Female |
| Less than 5 Minutes | 69 (9.5%) | 33 (4.5%) |
| 5 to 9 Minutes | 67 (9.2%) | 207 (28.3%) |
| 10 to 14 Minutes | 60 (8.3%) | 35 (4.8%) |
| 15 to 19 Minutes | 14 (1.9%) | 115 (15.7%) |
| 20 to 24 Minutes | 89 (12.3%) | 59 (8.1%) |
| 25 to 29 Minutes | 69 (9.5%) | 10 (1.4%) |
| 30 to 34 Minutes | 127 (17.5%) | 88 (12.0%) |
| 35 to 39 Minutes | 60 (8.3%) | 17 (2.3%) |
| 40 to 44 Minutes | 10 (1.4%) | 97 (13.3%) |
| 45 to 59 Minutes | 49 (6.8%) | 44 (6.0%) |
| 60 to 89 Minutes | 77 (10.6%) | 11 (1.5%) |
| 90 or more Minutes | 33 (4.6%) | 16 (2.2%) |
Time of Departure to Work by Sex in Ellsworth
The most frequent times of departure to work in Ellsworth are 5:00 AM to 5:29 AM (153, 21.1%) for males and 7:00 AM to 7:29 AM (142, 19.4%) for females.
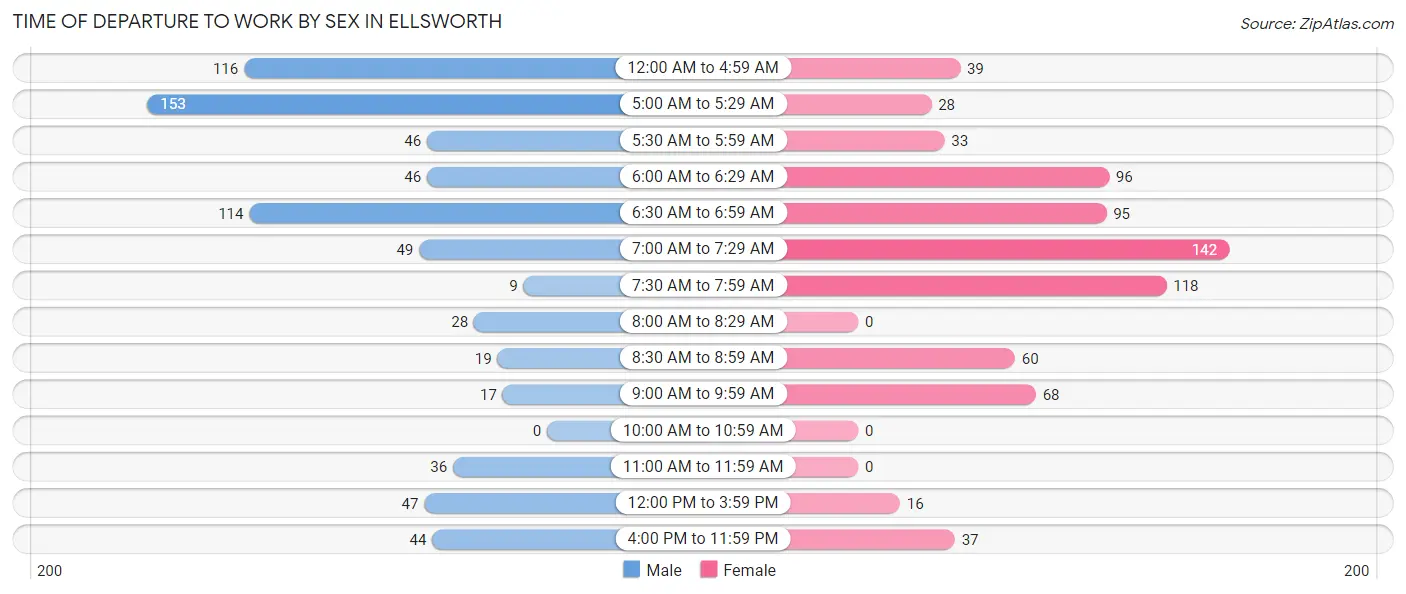
| Time of Departure | Male | Female |
| 12:00 AM to 4:59 AM | 116 (16.0%) | 39 (5.3%) |
| 5:00 AM to 5:29 AM | 153 (21.1%) | 28 (3.8%) |
| 5:30 AM to 5:59 AM | 46 (6.4%) | 33 (4.5%) |
| 6:00 AM to 6:29 AM | 46 (6.4%) | 96 (13.1%) |
| 6:30 AM to 6:59 AM | 114 (15.8%) | 95 (13.0%) |
| 7:00 AM to 7:29 AM | 49 (6.8%) | 142 (19.4%) |
| 7:30 AM to 7:59 AM | 9 (1.2%) | 118 (16.1%) |
| 8:00 AM to 8:29 AM | 28 (3.9%) | 0 (0.0%) |
| 8:30 AM to 8:59 AM | 19 (2.6%) | 60 (8.2%) |
| 9:00 AM to 9:59 AM | 17 (2.4%) | 68 (9.3%) |
| 10:00 AM to 10:59 AM | 0 (0.0%) | 0 (0.0%) |
| 11:00 AM to 11:59 AM | 36 (5.0%) | 0 (0.0%) |
| 12:00 PM to 3:59 PM | 47 (6.5%) | 16 (2.2%) |
| 4:00 PM to 11:59 PM | 44 (6.1%) | 37 (5.1%) |
| Total | 724 (100.0%) | 732 (100.0%) |
Housing Occupancy in Ellsworth
Occupancy by Ownership in Ellsworth
Of the total 1,430 dwellings in Ellsworth, owner-occupied units account for 896 (62.7%), while renter-occupied units make up 534 (37.3%).
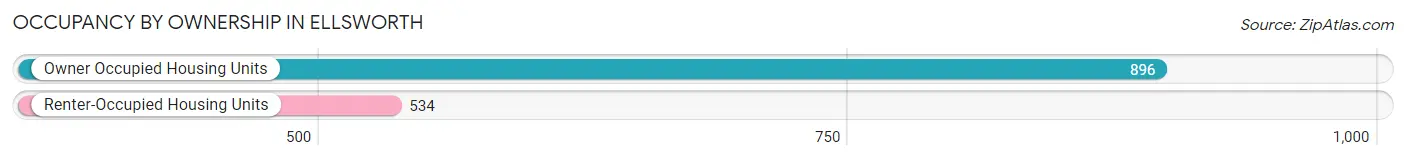
| Occupancy | # Housing Units | % Housing Units |
| Owner Occupied Housing Units | 896 | 62.7% |
| Renter-Occupied Housing Units | 534 | 37.3% |
| Total Occupied Housing Units | 1,430 | 100.0% |
Occupancy by Household Size in Ellsworth
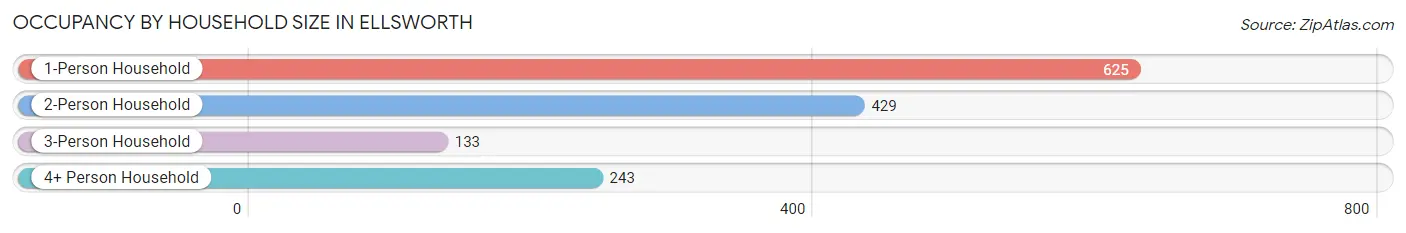
| Household Size | # Housing Units | % Housing Units |
| 1-Person Household | 625 | 43.7% |
| 2-Person Household | 429 | 30.0% |
| 3-Person Household | 133 | 9.3% |
| 4+ Person Household | 243 | 17.0% |
| Total Housing Units | 1,430 | 100.0% |
Occupancy by Ownership by Household Size in Ellsworth
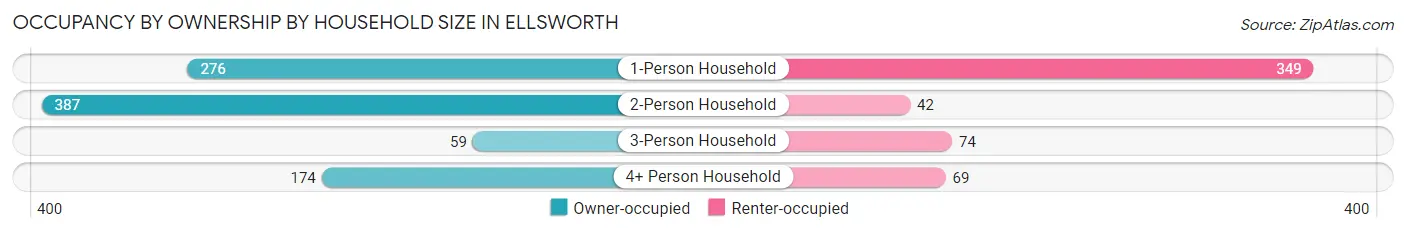
| Household Size | Owner-occupied | Renter-occupied |
| 1-Person Household | 276 (44.2%) | 349 (55.8%) |
| 2-Person Household | 387 (90.2%) | 42 (9.8%) |
| 3-Person Household | 59 (44.4%) | 74 (55.6%) |
| 4+ Person Household | 174 (71.6%) | 69 (28.4%) |
| Total Housing Units | 896 (62.7%) | 534 (37.3%) |
Occupancy by Educational Attainment in Ellsworth
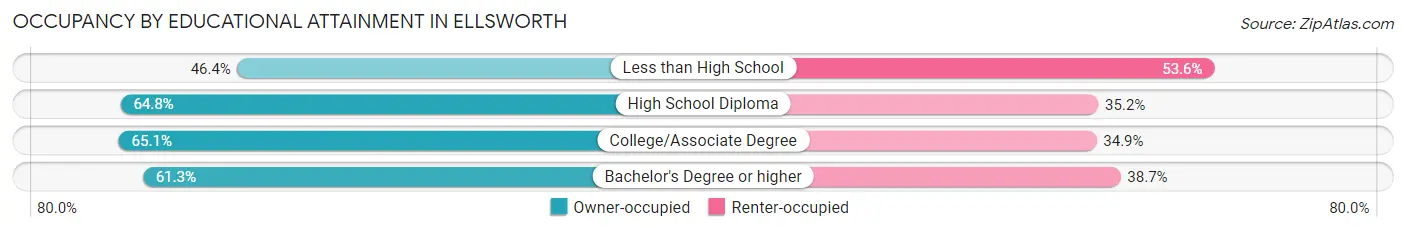
| Household Size | Owner-occupied | Renter-occupied |
| Less than High School | 51 (46.4%) | 59 (53.6%) |
| High School Diploma | 300 (64.8%) | 163 (35.2%) |
| College/Associate Degree | 341 (65.1%) | 183 (34.9%) |
| Bachelor's Degree or higher | 204 (61.3%) | 129 (38.7%) |
Occupancy by Age of Householder in Ellsworth
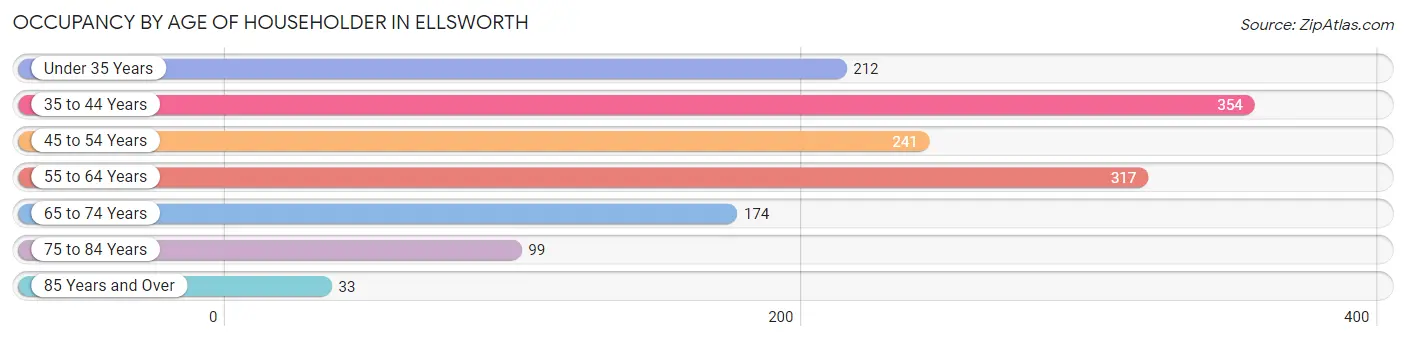
| Age Bracket | # Households | % Households |
| Under 35 Years | 212 | 14.8% |
| 35 to 44 Years | 354 | 24.8% |
| 45 to 54 Years | 241 | 16.9% |
| 55 to 64 Years | 317 | 22.2% |
| 65 to 74 Years | 174 | 12.2% |
| 75 to 84 Years | 99 | 6.9% |
| 85 Years and Over | 33 | 2.3% |
| Total | 1,430 | 100.0% |
Housing Finances in Ellsworth
Median Income by Occupancy in Ellsworth
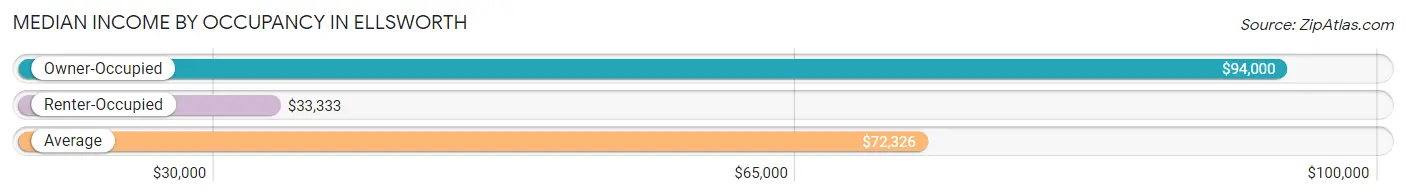
| Occupancy Type | # Households | Median Income |
| Owner-Occupied | 896 (62.7%) | $94,000 |
| Renter-Occupied | 534 (37.3%) | $33,333 |
| Average | 1,430 (100.0%) | $72,326 |
Occupancy by Householder Income Bracket in Ellsworth
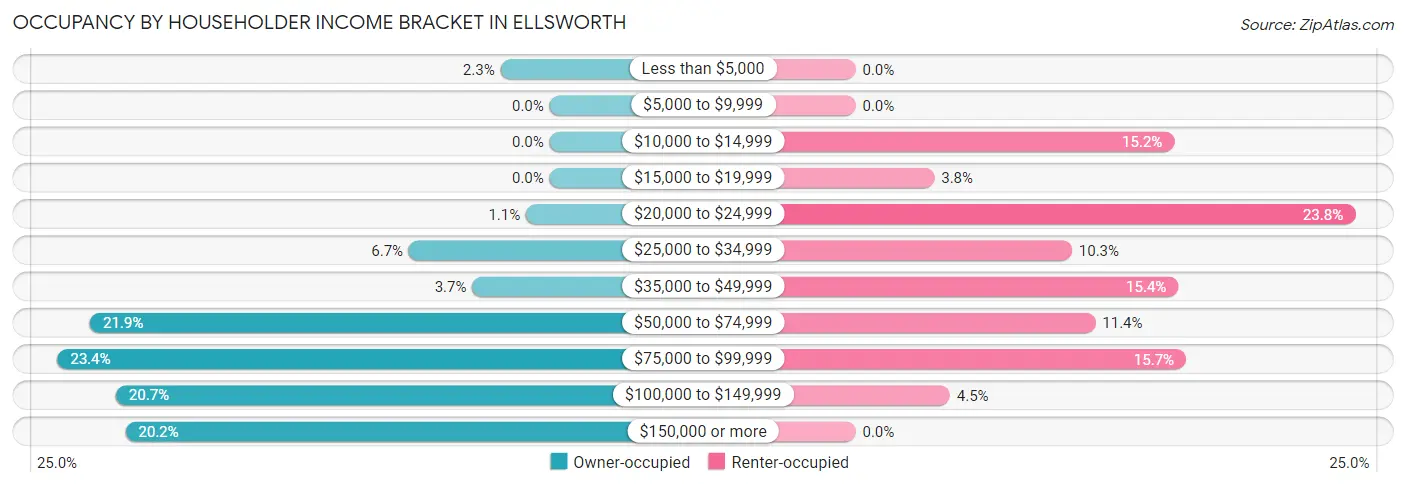
| Income Bracket | Owner-occupied | Renter-occupied |
| Less than $5,000 | 21 (2.3%) | 0 (0.0%) |
| $5,000 to $9,999 | 0 (0.0%) | 0 (0.0%) |
| $10,000 to $14,999 | 0 (0.0%) | 81 (15.2%) |
| $15,000 to $19,999 | 0 (0.0%) | 20 (3.7%) |
| $20,000 to $24,999 | 10 (1.1%) | 127 (23.8%) |
| $25,000 to $34,999 | 60 (6.7%) | 55 (10.3%) |
| $35,000 to $49,999 | 33 (3.7%) | 82 (15.4%) |
| $50,000 to $74,999 | 196 (21.9%) | 61 (11.4%) |
| $75,000 to $99,999 | 210 (23.4%) | 84 (15.7%) |
| $100,000 to $149,999 | 185 (20.6%) | 24 (4.5%) |
| $150,000 or more | 181 (20.2%) | 0 (0.0%) |
| Total | 896 (100.0%) | 534 (100.0%) |
Monthly Housing Cost Tiers in Ellsworth
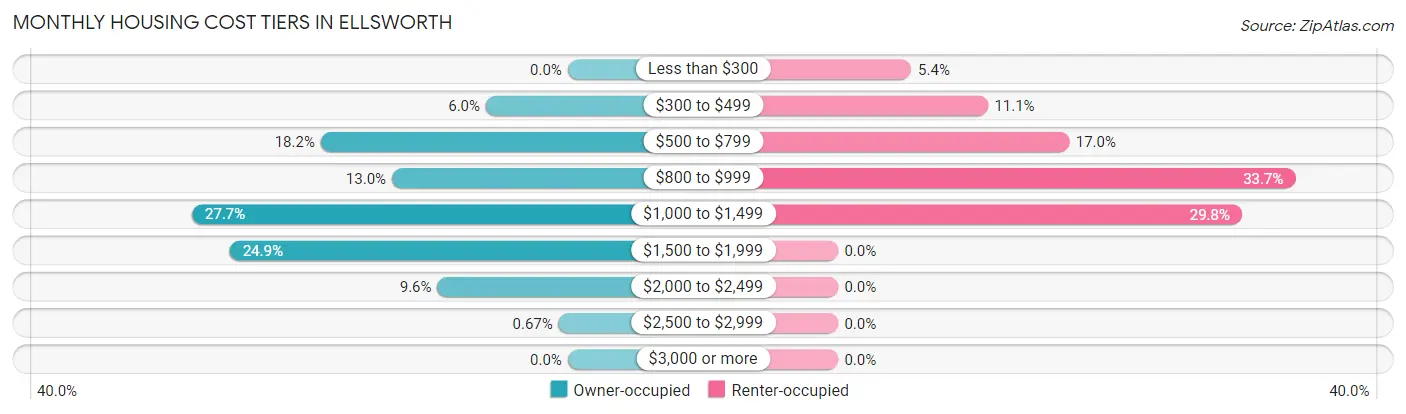
| Monthly Cost | Owner-occupied | Renter-occupied |
| Less than $300 | 0 (0.0%) | 29 (5.4%) |
| $300 to $499 | 54 (6.0%) | 59 (11.1%) |
| $500 to $799 | 163 (18.2%) | 91 (17.0%) |
| $800 to $999 | 116 (13.0%) | 180 (33.7%) |
| $1,000 to $1,499 | 248 (27.7%) | 159 (29.8%) |
| $1,500 to $1,999 | 223 (24.9%) | 0 (0.0%) |
| $2,000 to $2,499 | 86 (9.6%) | 0 (0.0%) |
| $2,500 to $2,999 | 6 (0.7%) | 0 (0.0%) |
| $3,000 or more | 0 (0.0%) | 0 (0.0%) |
| Total | 896 (100.0%) | 534 (100.0%) |
Physical Housing Characteristics in Ellsworth
Housing Structures in Ellsworth
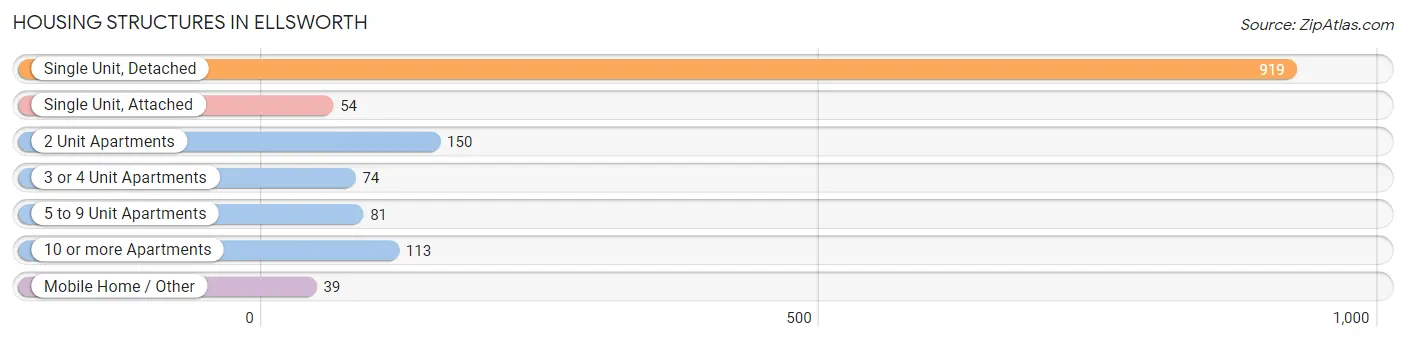
| Structure Type | # Housing Units | % Housing Units |
| Single Unit, Detached | 919 | 64.3% |
| Single Unit, Attached | 54 | 3.8% |
| 2 Unit Apartments | 150 | 10.5% |
| 3 or 4 Unit Apartments | 74 | 5.2% |
| 5 to 9 Unit Apartments | 81 | 5.7% |
| 10 or more Apartments | 113 | 7.9% |
| Mobile Home / Other | 39 | 2.7% |
| Total | 1,430 | 100.0% |
Housing Structures by Occupancy in Ellsworth
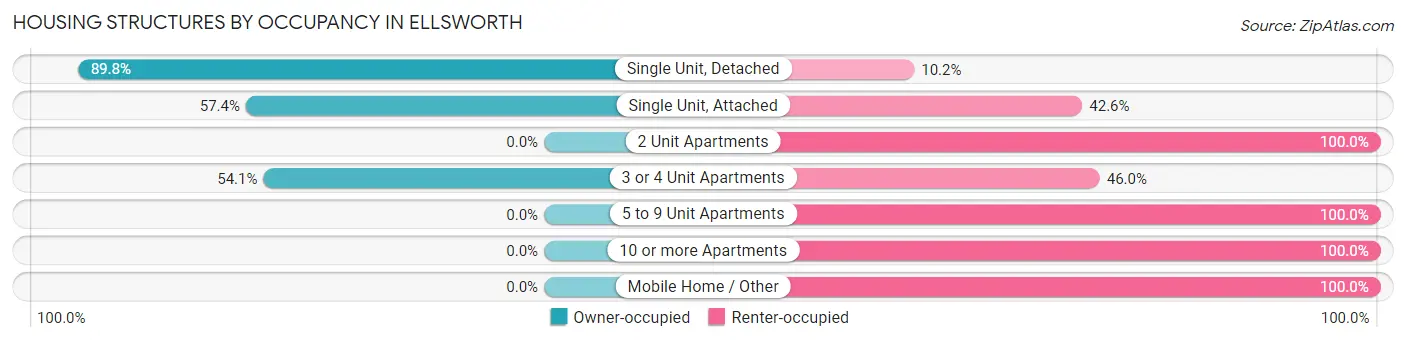
| Structure Type | Owner-occupied | Renter-occupied |
| Single Unit, Detached | 825 (89.8%) | 94 (10.2%) |
| Single Unit, Attached | 31 (57.4%) | 23 (42.6%) |
| 2 Unit Apartments | 0 (0.0%) | 150 (100.0%) |
| 3 or 4 Unit Apartments | 40 (54.0%) | 34 (46.0%) |
| 5 to 9 Unit Apartments | 0 (0.0%) | 81 (100.0%) |
| 10 or more Apartments | 0 (0.0%) | 113 (100.0%) |
| Mobile Home / Other | 0 (0.0%) | 39 (100.0%) |
| Total | 896 (62.7%) | 534 (37.3%) |
Housing Structures by Number of Rooms in Ellsworth
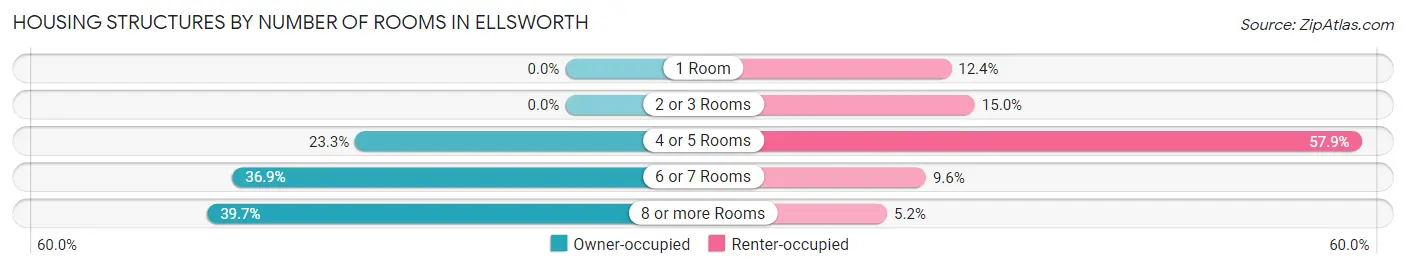
| Number of Rooms | Owner-occupied | Renter-occupied |
| 1 Room | 0 (0.0%) | 66 (12.4%) |
| 2 or 3 Rooms | 0 (0.0%) | 80 (15.0%) |
| 4 or 5 Rooms | 209 (23.3%) | 309 (57.9%) |
| 6 or 7 Rooms | 331 (36.9%) | 51 (9.6%) |
| 8 or more Rooms | 356 (39.7%) | 28 (5.2%) |
| Total | 896 (100.0%) | 534 (100.0%) |
Housing Structure by Heating Type in Ellsworth
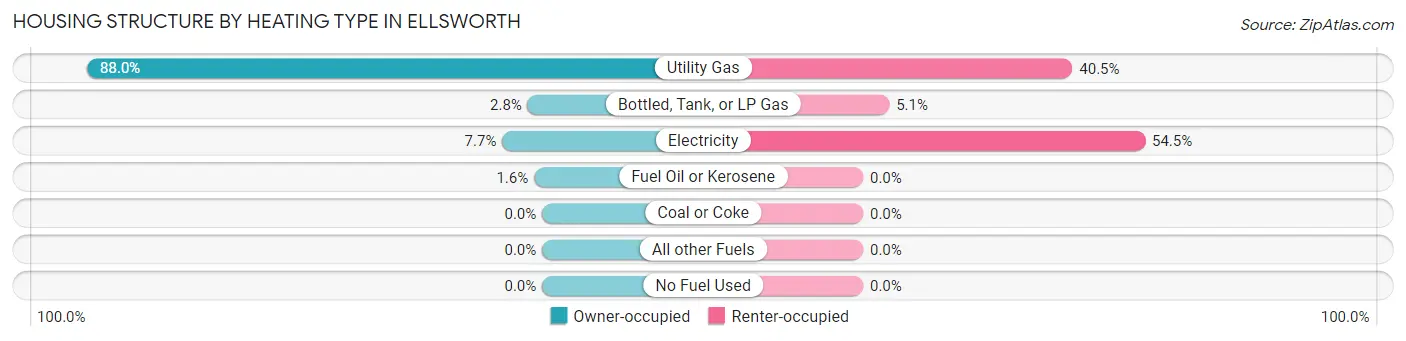
| Heating Type | Owner-occupied | Renter-occupied |
| Utility Gas | 788 (87.9%) | 216 (40.5%) |
| Bottled, Tank, or LP Gas | 25 (2.8%) | 27 (5.1%) |
| Electricity | 69 (7.7%) | 291 (54.5%) |
| Fuel Oil or Kerosene | 14 (1.6%) | 0 (0.0%) |
| Coal or Coke | 0 (0.0%) | 0 (0.0%) |
| All other Fuels | 0 (0.0%) | 0 (0.0%) |
| No Fuel Used | 0 (0.0%) | 0 (0.0%) |
| Total | 896 (100.0%) | 534 (100.0%) |
Household Vehicle Usage in Ellsworth
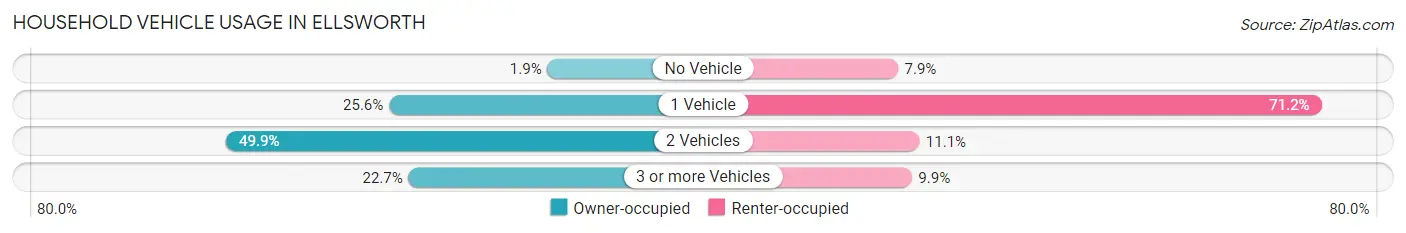
| Vehicles per Household | Owner-occupied | Renter-occupied |
| No Vehicle | 17 (1.9%) | 42 (7.9%) |
| 1 Vehicle | 229 (25.6%) | 380 (71.2%) |
| 2 Vehicles | 447 (49.9%) | 59 (11.1%) |
| 3 or more Vehicles | 203 (22.7%) | 53 (9.9%) |
| Total | 896 (100.0%) | 534 (100.0%) |
Real Estate & Mortgages in Ellsworth
Real Estate and Mortgage Overview in Ellsworth
| Characteristic | Without Mortgage | With Mortgage |
| Housing Units | 265 | 631 |
| Median Property Value | $209,600 | $198,100 |
| Median Household Income | $74,948 | $150 |
| Monthly Housing Costs | $660 | $0 |
| Real Estate Taxes | $3,970 | $0 |
Property Value by Mortgage Status in Ellsworth
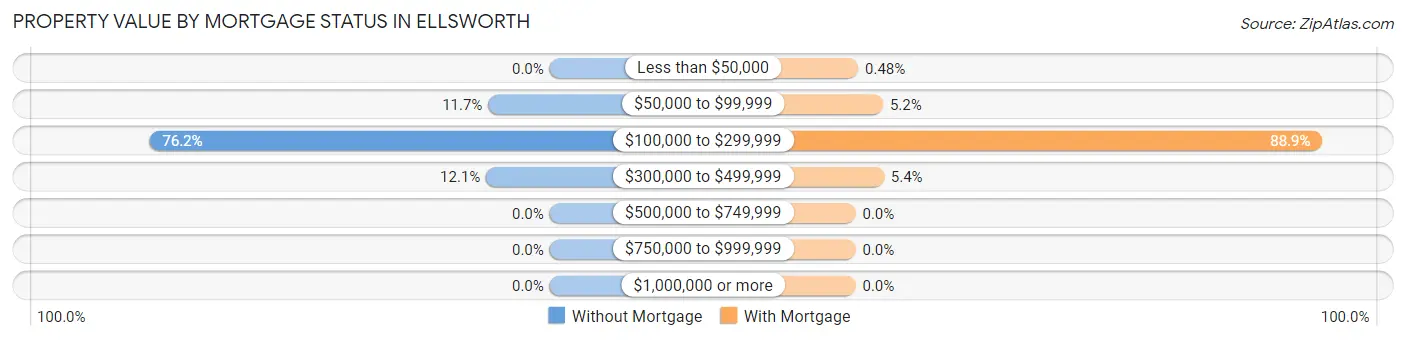
| Property Value | Without Mortgage | With Mortgage |
| Less than $50,000 | 0 (0.0%) | 3 (0.5%) |
| $50,000 to $99,999 | 31 (11.7%) | 33 (5.2%) |
| $100,000 to $299,999 | 202 (76.2%) | 561 (88.9%) |
| $300,000 to $499,999 | 32 (12.1%) | 34 (5.4%) |
| $500,000 to $749,999 | 0 (0.0%) | 0 (0.0%) |
| $750,000 to $999,999 | 0 (0.0%) | 0 (0.0%) |
| $1,000,000 or more | 0 (0.0%) | 0 (0.0%) |
| Total | 265 (100.0%) | 631 (100.0%) |
Household Income by Mortgage Status in Ellsworth
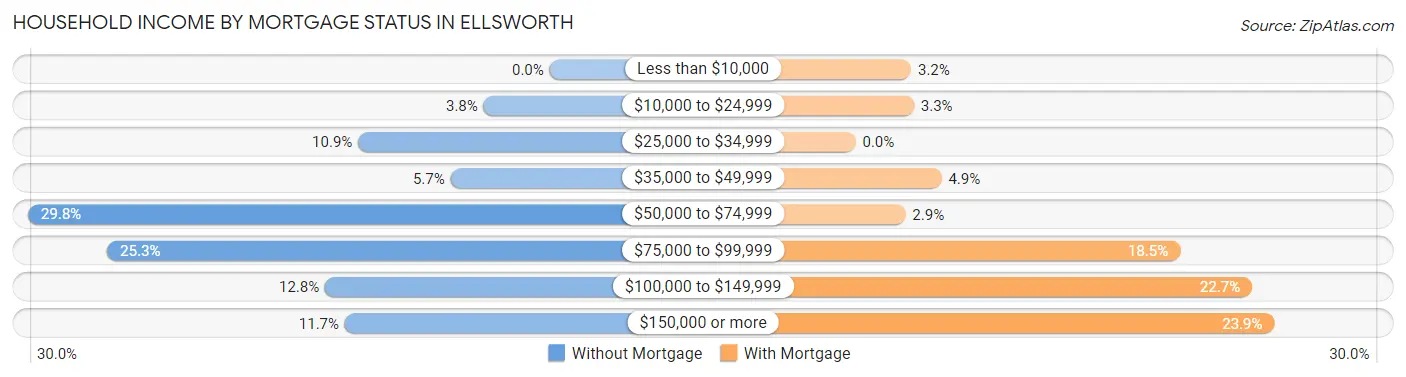
| Household Income | Without Mortgage | With Mortgage |
| Less than $10,000 | 0 (0.0%) | 20 (3.2%) |
| $10,000 to $24,999 | 10 (3.8%) | 21 (3.3%) |
| $25,000 to $34,999 | 29 (10.9%) | 0 (0.0%) |
| $35,000 to $49,999 | 15 (5.7%) | 31 (4.9%) |
| $50,000 to $74,999 | 79 (29.8%) | 18 (2.9%) |
| $75,000 to $99,999 | 67 (25.3%) | 117 (18.5%) |
| $100,000 to $149,999 | 34 (12.8%) | 143 (22.7%) |
| $150,000 or more | 31 (11.7%) | 151 (23.9%) |
| Total | 265 (100.0%) | 631 (100.0%) |
Property Value to Household Income Ratio in Ellsworth
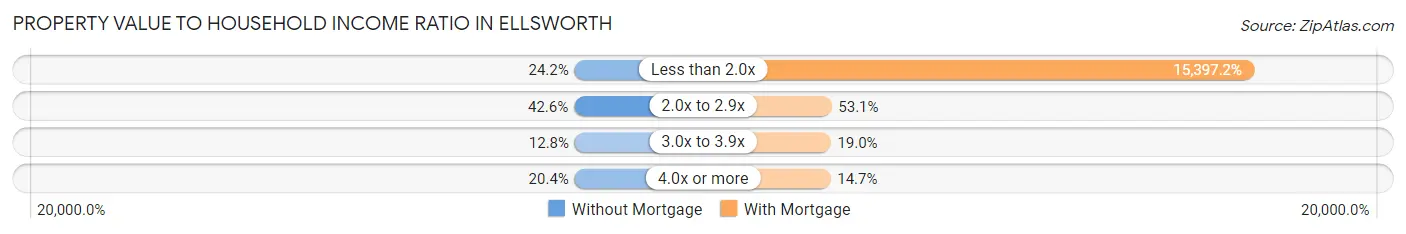
| Value-to-Income Ratio | Without Mortgage | With Mortgage |
| Less than 2.0x | 64 (24.1%) | 97,156 (15,397.1%) |
| 2.0x to 2.9x | 113 (42.6%) | 335 (53.1%) |
| 3.0x to 3.9x | 34 (12.8%) | 120 (19.0%) |
| 4.0x or more | 54 (20.4%) | 93 (14.7%) |
| Total | 265 (100.0%) | 631 (100.0%) |
Real Estate Taxes by Mortgage Status in Ellsworth
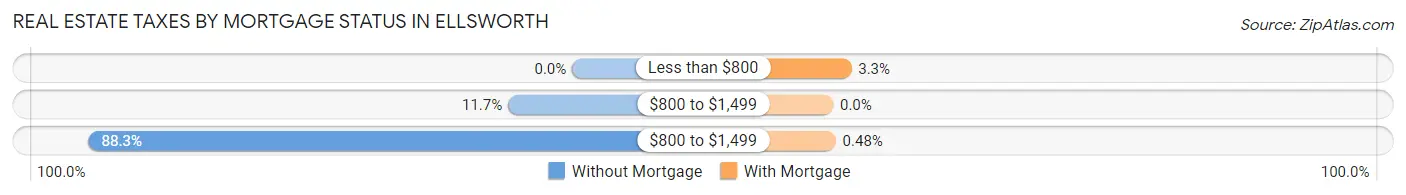
| Property Taxes | Without Mortgage | With Mortgage |
| Less than $800 | 0 (0.0%) | 21 (3.3%) |
| $800 to $1,499 | 31 (11.7%) | 0 (0.0%) |
| $800 to $1,499 | 234 (88.3%) | 3 (0.5%) |
| Total | 265 (100.0%) | 631 (100.0%) |
Health & Disability in Ellsworth
Health Insurance Coverage by Age in Ellsworth
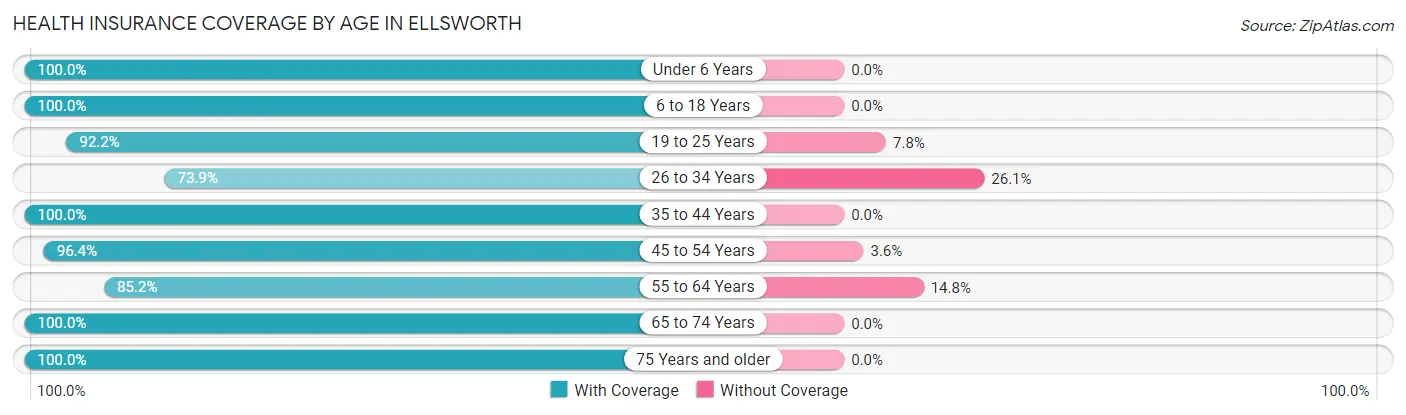
| Age Bracket | With Coverage | Without Coverage |
| Under 6 Years | 214 (100.0%) | 0 (0.0%) |
| 6 to 18 Years | 655 (100.0%) | 0 (0.0%) |
| 19 to 25 Years | 189 (92.2%) | 16 (7.8%) |
| 26 to 34 Years | 215 (73.9%) | 76 (26.1%) |
| 35 to 44 Years | 544 (100.0%) | 0 (0.0%) |
| 45 to 54 Years | 403 (96.4%) | 15 (3.6%) |
| 55 to 64 Years | 374 (85.2%) | 65 (14.8%) |
| 65 to 74 Years | 271 (100.0%) | 0 (0.0%) |
| 75 Years and older | 192 (100.0%) | 0 (0.0%) |
| Total | 3,057 (94.7%) | 172 (5.3%) |
Health Insurance Coverage by Citizenship Status in Ellsworth
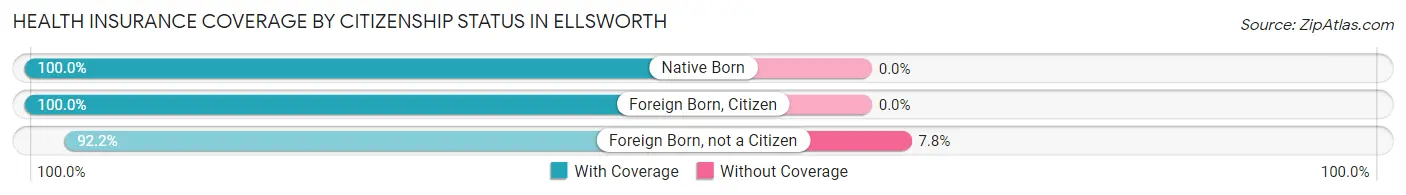
| Citizenship Status | With Coverage | Without Coverage |
| Native Born | 214 (100.0%) | 0 (0.0%) |
| Foreign Born, Citizen | 655 (100.0%) | 0 (0.0%) |
| Foreign Born, not a Citizen | 189 (92.2%) | 16 (7.8%) |
Health Insurance Coverage by Household Income in Ellsworth
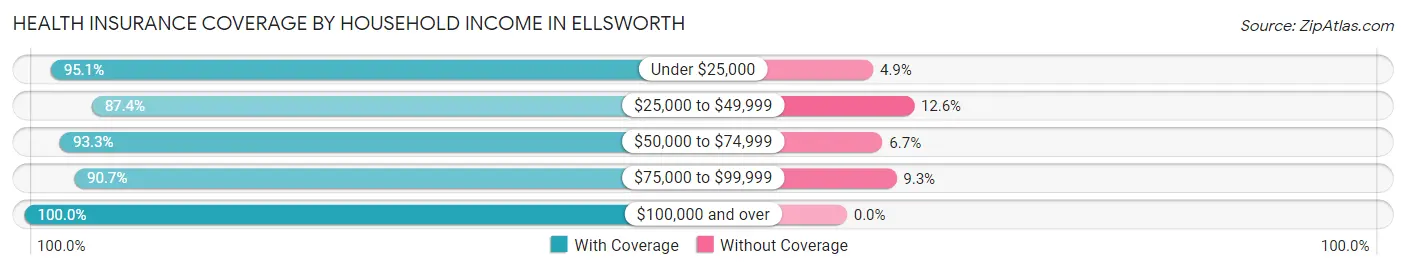
| Household Income | With Coverage | Without Coverage |
| Under $25,000 | 290 (95.1%) | 15 (4.9%) |
| $25,000 to $49,999 | 271 (87.4%) | 39 (12.6%) |
| $50,000 to $74,999 | 588 (93.3%) | 42 (6.7%) |
| $75,000 to $99,999 | 743 (90.7%) | 76 (9.3%) |
| $100,000 and over | 1,123 (100.0%) | 0 (0.0%) |
Public vs Private Health Insurance Coverage by Age in Ellsworth
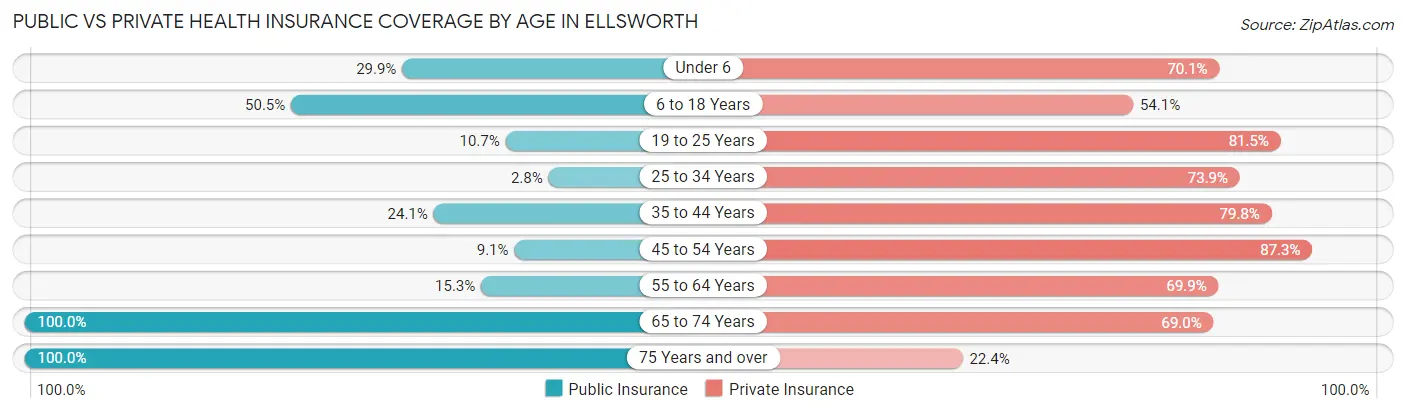
| Age Bracket | Public Insurance | Private Insurance |
| Under 6 | 64 (29.9%) | 150 (70.1%) |
| 6 to 18 Years | 331 (50.5%) | 354 (54.0%) |
| 19 to 25 Years | 22 (10.7%) | 167 (81.5%) |
| 25 to 34 Years | 8 (2.8%) | 215 (73.9%) |
| 35 to 44 Years | 131 (24.1%) | 434 (79.8%) |
| 45 to 54 Years | 38 (9.1%) | 365 (87.3%) |
| 55 to 64 Years | 67 (15.3%) | 307 (69.9%) |
| 65 to 74 Years | 271 (100.0%) | 187 (69.0%) |
| 75 Years and over | 192 (100.0%) | 43 (22.4%) |
| Total | 1,124 (34.8%) | 2,222 (68.8%) |
Disability Status by Sex by Age in Ellsworth
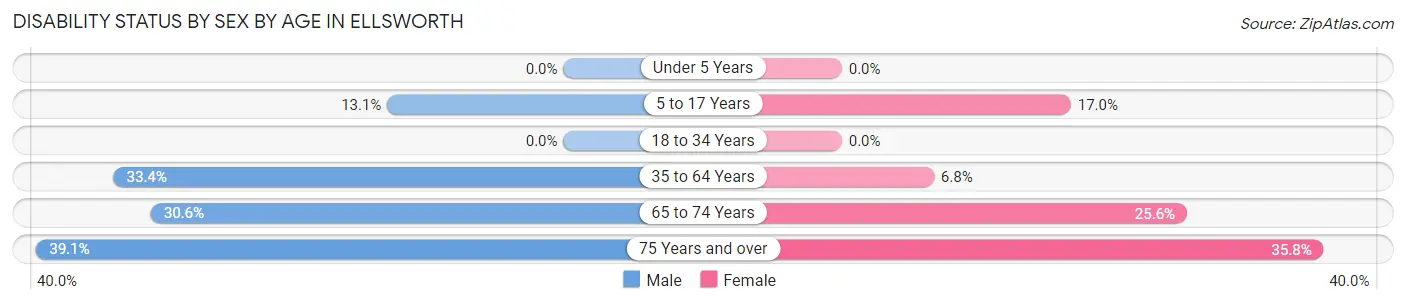
| Age Bracket | Male | Female |
| Under 5 Years | 0 (0.0%) | 0 (0.0%) |
| 5 to 17 Years | 34 (13.1%) | 60 (17.0%) |
| 18 to 34 Years | 0 (0.0%) | 0 (0.0%) |
| 35 to 64 Years | 214 (33.4%) | 52 (6.8%) |
| 65 to 74 Years | 34 (30.6%) | 41 (25.6%) |
| 75 Years and over | 27 (39.1%) | 44 (35.8%) |
Disability Class by Sex by Age in Ellsworth
Disability Class: Hearing Difficulty
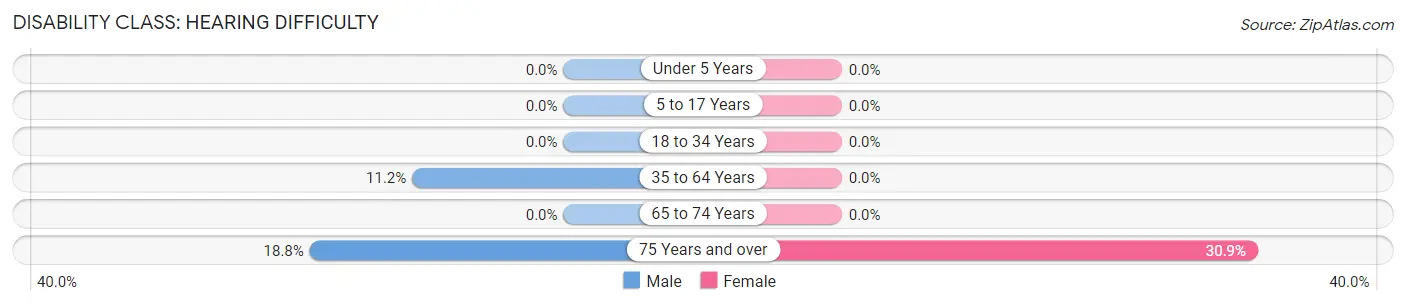
| Age Bracket | Male | Female |
| Under 5 Years | 0 (0.0%) | 0 (0.0%) |
| 5 to 17 Years | 0 (0.0%) | 0 (0.0%) |
| 18 to 34 Years | 0 (0.0%) | 0 (0.0%) |
| 35 to 64 Years | 72 (11.2%) | 0 (0.0%) |
| 65 to 74 Years | 0 (0.0%) | 0 (0.0%) |
| 75 Years and over | 13 (18.8%) | 38 (30.9%) |
Disability Class: Vision Difficulty
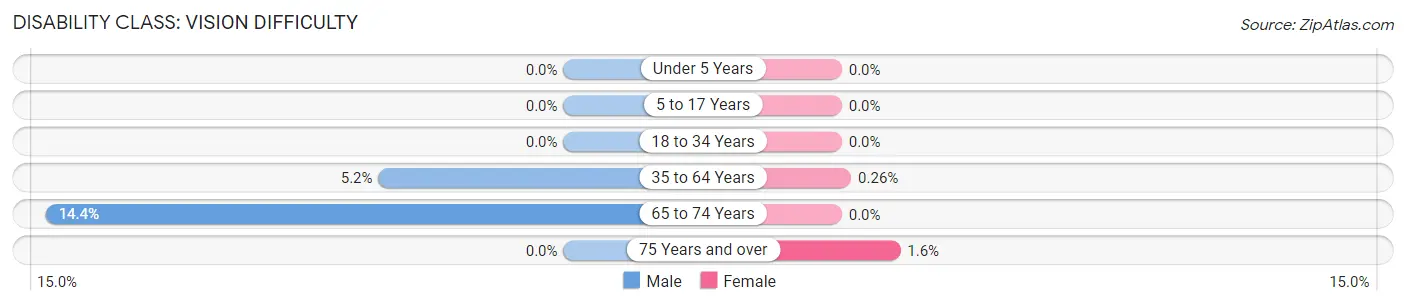
| Age Bracket | Male | Female |
| Under 5 Years | 0 (0.0%) | 0 (0.0%) |
| 5 to 17 Years | 0 (0.0%) | 0 (0.0%) |
| 18 to 34 Years | 0 (0.0%) | 0 (0.0%) |
| 35 to 64 Years | 33 (5.1%) | 2 (0.3%) |
| 65 to 74 Years | 16 (14.4%) | 0 (0.0%) |
| 75 Years and over | 0 (0.0%) | 2 (1.6%) |
Disability Class: Cognitive Difficulty
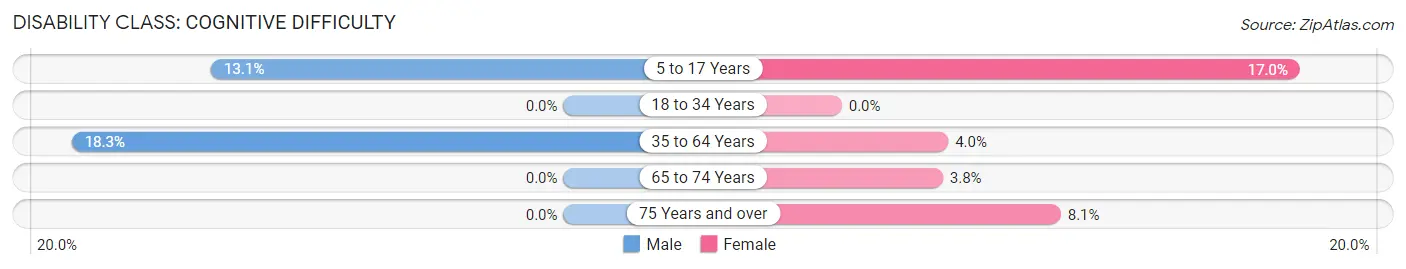
| Age Bracket | Male | Female |
| 5 to 17 Years | 34 (13.1%) | 60 (17.0%) |
| 18 to 34 Years | 0 (0.0%) | 0 (0.0%) |
| 35 to 64 Years | 117 (18.2%) | 30 (4.0%) |
| 65 to 74 Years | 0 (0.0%) | 6 (3.7%) |
| 75 Years and over | 0 (0.0%) | 10 (8.1%) |
Disability Class: Ambulatory Difficulty
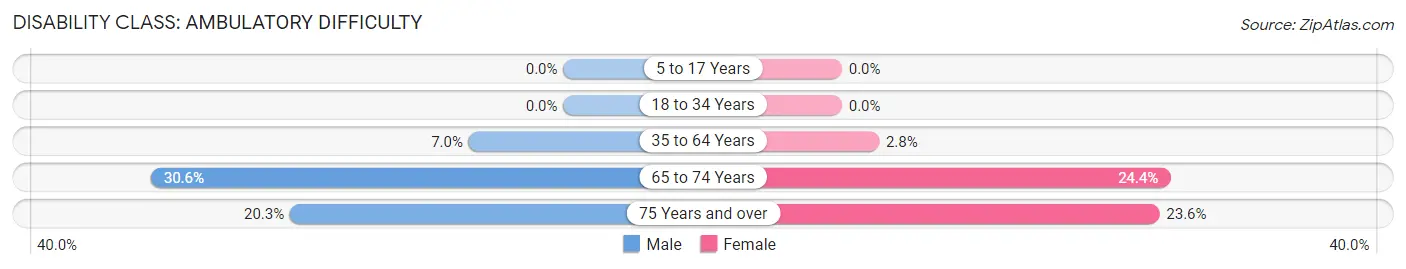
| Age Bracket | Male | Female |
| 5 to 17 Years | 0 (0.0%) | 0 (0.0%) |
| 18 to 34 Years | 0 (0.0%) | 0 (0.0%) |
| 35 to 64 Years | 45 (7.0%) | 21 (2.8%) |
| 65 to 74 Years | 34 (30.6%) | 39 (24.4%) |
| 75 Years and over | 14 (20.3%) | 29 (23.6%) |
Disability Class: Self-Care Difficulty
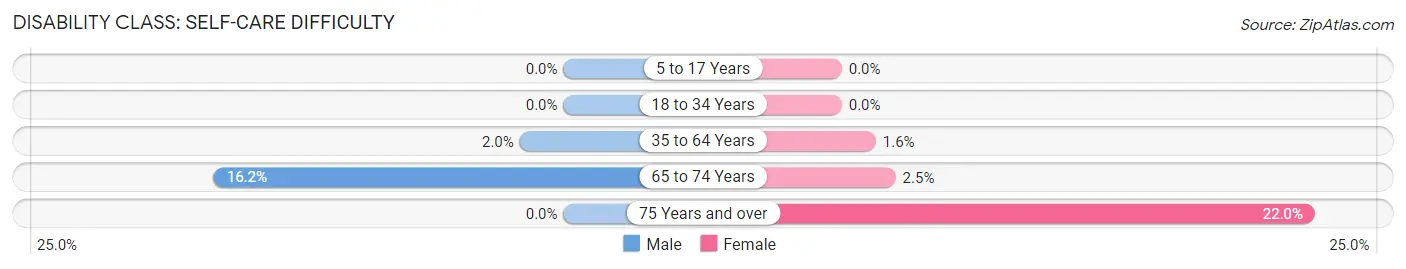
| Age Bracket | Male | Female |
| 5 to 17 Years | 0 (0.0%) | 0 (0.0%) |
| 18 to 34 Years | 0 (0.0%) | 0 (0.0%) |
| 35 to 64 Years | 13 (2.0%) | 12 (1.6%) |
| 65 to 74 Years | 18 (16.2%) | 4 (2.5%) |
| 75 Years and over | 0 (0.0%) | 27 (22.0%) |
Technology Access in Ellsworth
Computing Device Access in Ellsworth
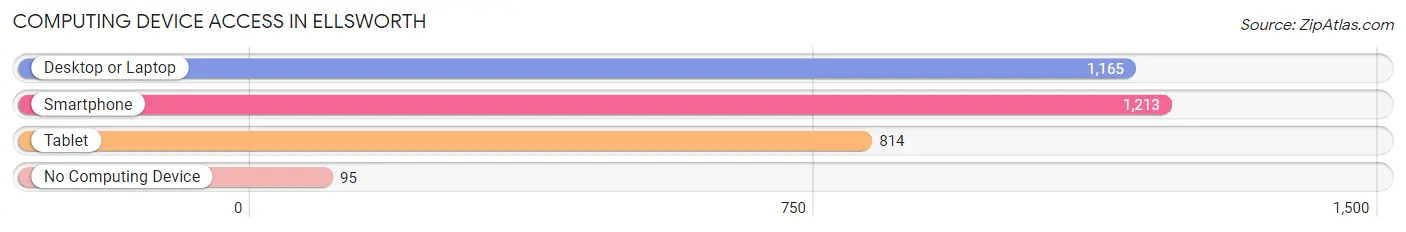
| Device Type | # Households | % Households |
| Desktop or Laptop | 1,165 | 81.5% |
| Smartphone | 1,213 | 84.8% |
| Tablet | 814 | 56.9% |
| No Computing Device | 95 | 6.6% |
| Total | 1,430 | 100.0% |
Internet Access in Ellsworth
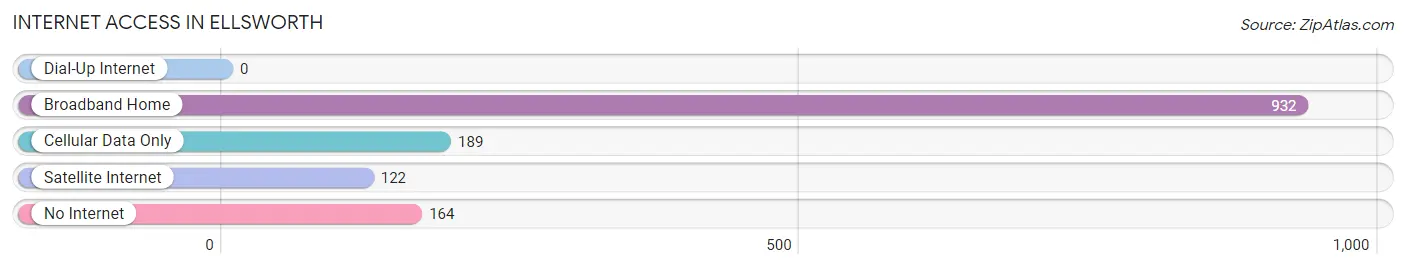
| Internet Type | # Households | % Households |
| Dial-Up Internet | 0 | 0.0% |
| Broadband Home | 932 | 65.2% |
| Cellular Data Only | 189 | 13.2% |
| Satellite Internet | 122 | 8.5% |
| No Internet | 164 | 11.5% |
| Total | 1,430 | 100.0% |
Ellsworth Summary
Ellsworth, Wisconsin is a small city located in Pierce County, Wisconsin. It is situated on the banks of the Rush River, and is part of the St. Croix Valley. The city has a population of approximately 3,000 people, and is the county seat of Pierce County.
History
The area that is now Ellsworth was first settled in 1854 by a group of settlers from New York. The settlers named the area Ellsworth after their hometown of Ellsworth, New York. The city was officially incorporated in 1872.
In the late 19th century, Ellsworth was a thriving agricultural community. The city was home to several grain mills, a creamery, and a cheese factory. The city also had a thriving lumber industry, and was home to several sawmills.
In the early 20th century, Ellsworth began to experience a decline in its agricultural and lumber industries. The city was hit hard by the Great Depression, and many of its businesses closed. In the 1950s, the city began to experience a resurgence in its economy, as it became a popular tourist destination.
Geography
Ellsworth is located in the St. Croix Valley, which is a region of Wisconsin that is known for its rolling hills and lush forests. The city is situated on the banks of the Rush River, and is surrounded by several small lakes. The city is located approximately 30 miles east of the Twin Cities of Minneapolis and St. Paul.
Economy
Ellsworth’s economy is largely based on tourism and agriculture. The city is home to several wineries, and is a popular destination for wine enthusiasts. The city is also home to several small businesses, including restaurants, retail stores, and service providers.
The city is also home to several manufacturing companies, including a paper mill and a plastics factory. The city is also home to several agricultural businesses, including dairy farms and crop farms.
Demographics
As of the 2010 census, Ellsworth had a population of 3,000 people. The city has a median household income of $45,000, and a median home value of $150,000. The city is predominantly white, with approximately 90% of the population identifying as Caucasian. The city also has a small Hispanic population, with approximately 5% of the population identifying as Hispanic or Latino.
Ellsworth is a small city with a rich history and a vibrant economy. The city is home to several small businesses, and is a popular tourist destination. The city is also home to several agricultural businesses, and is a great place to live for those who enjoy the outdoors.
Common Questions
What is Per Capita Income in Ellsworth?
Per Capita income in Ellsworth is $35,693.
What is the Median Family Income in Ellsworth?
Median Family Income in Ellsworth is $88,711.
What is the Median Household income in Ellsworth?
Median Household Income in Ellsworth is $72,326.
What is Income or Wage Gap in Ellsworth?
Income or Wage Gap in Ellsworth is 29.7%.
Women in Ellsworth earn 70.3 cents for every dollar earned by a man.
What is Family Income Deficit in Ellsworth?
Family Income Deficit in Ellsworth is $3,393.
Families that are below poverty line in Ellsworth earn $3,393 less on average than the poverty threshold level.
What is Inequality or Gini Index in Ellsworth?
Inequality or Gini Index in Ellsworth is 0.38.
What is the Total Population of Ellsworth?
Total Population of Ellsworth is 3,323.
What is the Total Male Population of Ellsworth?
Total Male Population of Ellsworth is 1,568.
What is the Total Female Population of Ellsworth?
Total Female Population of Ellsworth is 1,755.
What is the Ratio of Males per 100 Females in Ellsworth?
There are 89.34 Males per 100 Females in Ellsworth.
What is the Ratio of Females per 100 Males in Ellsworth?
There are 111.93 Females per 100 Males in Ellsworth.
What is the Median Population Age in Ellsworth?
Median Population Age in Ellsworth is 41.8 Years.
What is the Average Family Size in Ellsworth
Average Family Size in Ellsworth is 3.2 People.
What is the Average Household Size in Ellsworth
Average Household Size in Ellsworth is 2.2 People.
How Large is the Labor Force in Ellsworth?
There are 1,728 People in the Labor Forcein in Ellsworth.
What is the Percentage of People in the Labor Force in Ellsworth?
67.2% of People are in the Labor Force in Ellsworth.
What is the Unemployment Rate in Ellsworth?
Unemployment Rate in Ellsworth is 3.9%.