Cashton, WI Map & Demographics
Cashton Map
Cashton Overview
$30,557
PER CAPITA INCOME
$68,477
AVG FAMILY INCOME
$64,625
AVG HOUSEHOLD INCOME
37.2%
WAGE / INCOME GAP [ % ]
62.8¢/ $1
WAGE / INCOME GAP [ $ ]
0.37
INEQUALITY / GINI INDEX
1,303
TOTAL POPULATION
724
MALE POPULATION
579
FEMALE POPULATION
125.04
MALES / 100 FEMALES
79.97
FEMALES / 100 MALES
37.6
MEDIAN AGE
2.9
AVG FAMILY SIZE
2.4
AVG HOUSEHOLD SIZE
540
LABOR FORCE [ PEOPLE ]
58.3%
PERCENT IN LABOR FORCE
2.8%
UNEMPLOYMENT RATE
Cashton Zip Codes
Cashton Area Codes
Income in Cashton
Income Overview in Cashton
Per Capita Income in Cashton is $30,557, while median incomes of families and households are $68,477 and $64,625 respectively.
| Characteristic | Number | Measure |
| Per Capita Income | 1,303 | $30,557 |
| Median Family Income | 368 | $68,477 |
| Mean Family Income | 368 | $80,116 |
| Median Household Income | 549 | $64,625 |
| Mean Household Income | 549 | $71,383 |
| Income Deficit | 368 | $0 |
| Wage / Income Gap (%) | 1,303 | 37.20% |
| Wage / Income Gap ($) | 1,303 | 62.80¢ per $1 |
| Gini / Inequality Index | 1,303 | 0.37 |
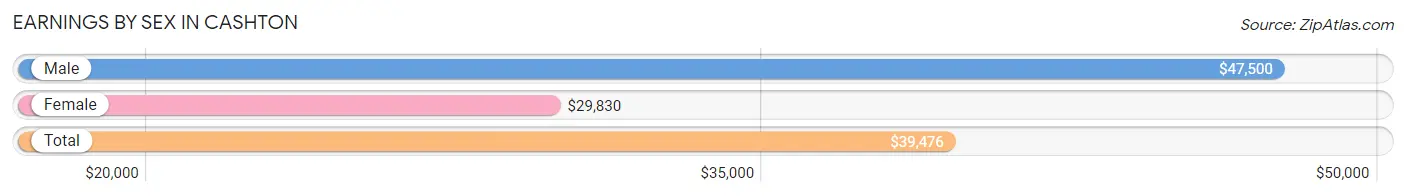
Earnings by Sex in Cashton
Average Earnings in Cashton are $39,476, $47,500 for men and $29,830 for women, a difference of 37.2%.
| Sex | Number | Average Earnings |
| Male | 334 (56.3%) | $47,500 |
| Female | 259 (43.7%) | $29,830 |
| Total | 593 (100.0%) | $39,476 |
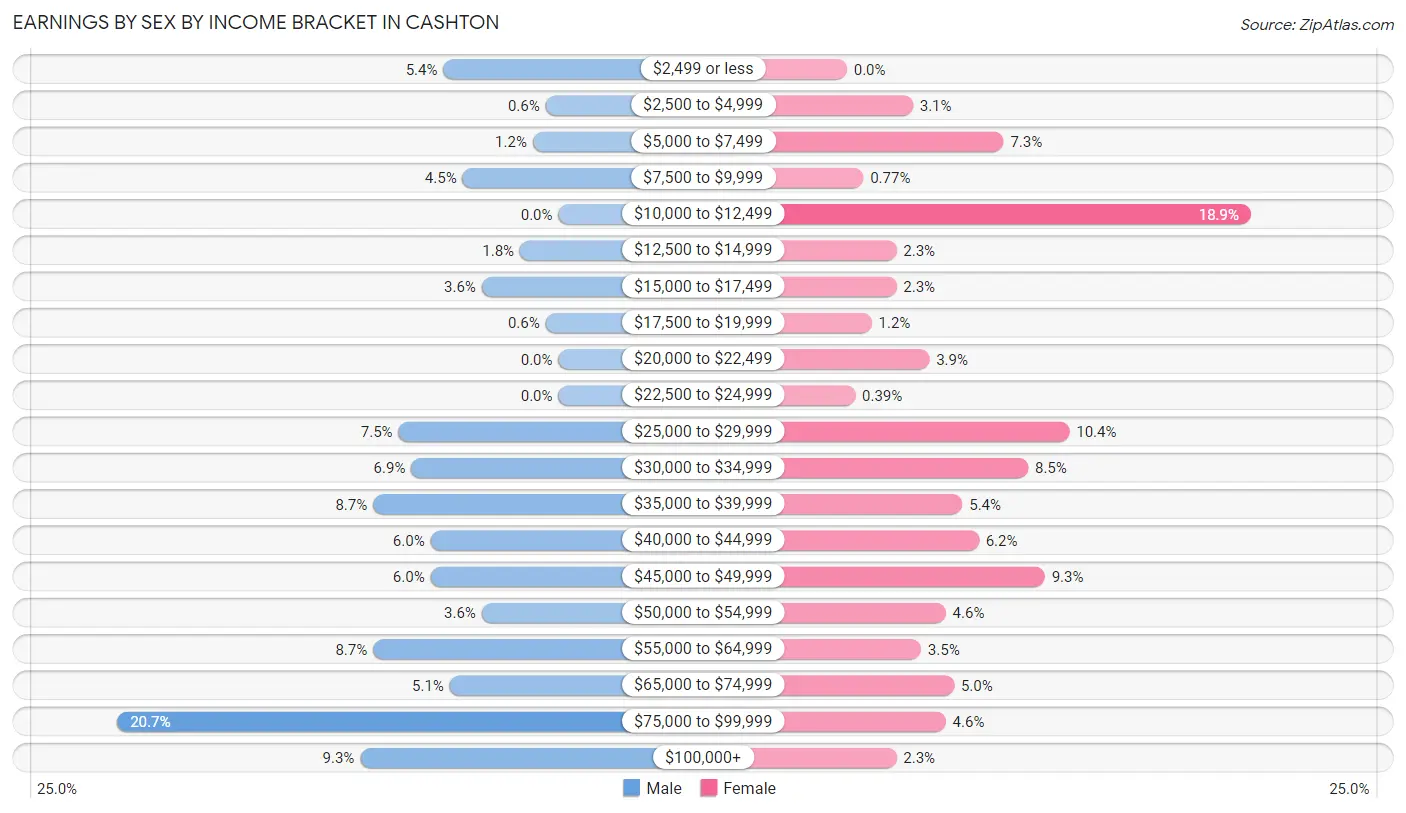
Earnings by Sex by Income Bracket in Cashton
The most common earnings brackets in Cashton are $75,000 to $99,999 for men (69 | 20.7%) and $10,000 to $12,499 for women (49 | 18.9%).
| Income | Male | Female |
| $2,499 or less | 18 (5.4%) | 0 (0.0%) |
| $2,500 to $4,999 | 2 (0.6%) | 8 (3.1%) |
| $5,000 to $7,499 | 4 (1.2%) | 19 (7.3%) |
| $7,500 to $9,999 | 15 (4.5%) | 2 (0.8%) |
| $10,000 to $12,499 | 0 (0.0%) | 49 (18.9%) |
| $12,500 to $14,999 | 6 (1.8%) | 6 (2.3%) |
| $15,000 to $17,499 | 12 (3.6%) | 6 (2.3%) |
| $17,500 to $19,999 | 2 (0.6%) | 3 (1.2%) |
| $20,000 to $22,499 | 0 (0.0%) | 10 (3.9%) |
| $22,500 to $24,999 | 0 (0.0%) | 1 (0.4%) |
| $25,000 to $29,999 | 25 (7.5%) | 27 (10.4%) |
| $30,000 to $34,999 | 23 (6.9%) | 22 (8.5%) |
| $35,000 to $39,999 | 29 (8.7%) | 14 (5.4%) |
| $40,000 to $44,999 | 20 (6.0%) | 16 (6.2%) |
| $45,000 to $49,999 | 20 (6.0%) | 24 (9.3%) |
| $50,000 to $54,999 | 12 (3.6%) | 12 (4.6%) |
| $55,000 to $64,999 | 29 (8.7%) | 9 (3.5%) |
| $65,000 to $74,999 | 17 (5.1%) | 13 (5.0%) |
| $75,000 to $99,999 | 69 (20.7%) | 12 (4.6%) |
| $100,000+ | 31 (9.3%) | 6 (2.3%) |
| Total | 334 (100.0%) | 259 (100.0%) |
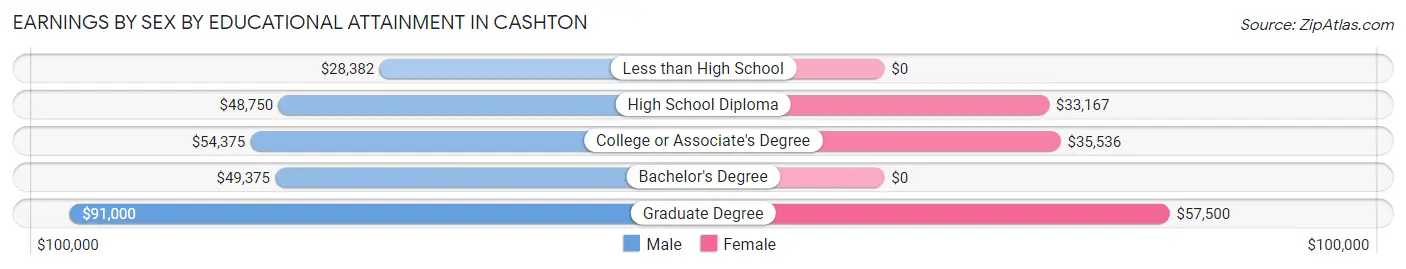
Earnings by Sex by Educational Attainment in Cashton
Average earnings in Cashton are $51,000 for men and $29,261 for women, a difference of 42.6%. Men with an educational attainment of graduate degree enjoy the highest average annual earnings of $91,000, while those with less than high school education earn the least with $28,382. Women with an educational attainment of graduate degree earn the most with the average annual earnings of $57,500, while those with high school diploma education have the smallest earnings of $33,167.
| Educational Attainment | Male Income | Female Income |
| Less than High School | $28,382 | $0 |
| High School Diploma | $48,750 | $33,167 |
| College or Associate's Degree | $54,375 | $35,536 |
| Bachelor's Degree | $49,375 | $0 |
| Graduate Degree | $91,000 | $57,500 |
| Total | $51,000 | $29,261 |
Family Income in Cashton
Family Income Brackets in Cashton
According to the Cashton family income data, there are 110 families falling into the $50,000 to $74,999 income range, which is the most common income bracket and makes up 29.9% of all families. Conversely, the less than $10,000 income bracket is the least frequent group with only 4 families (1.1%) belonging to this category.
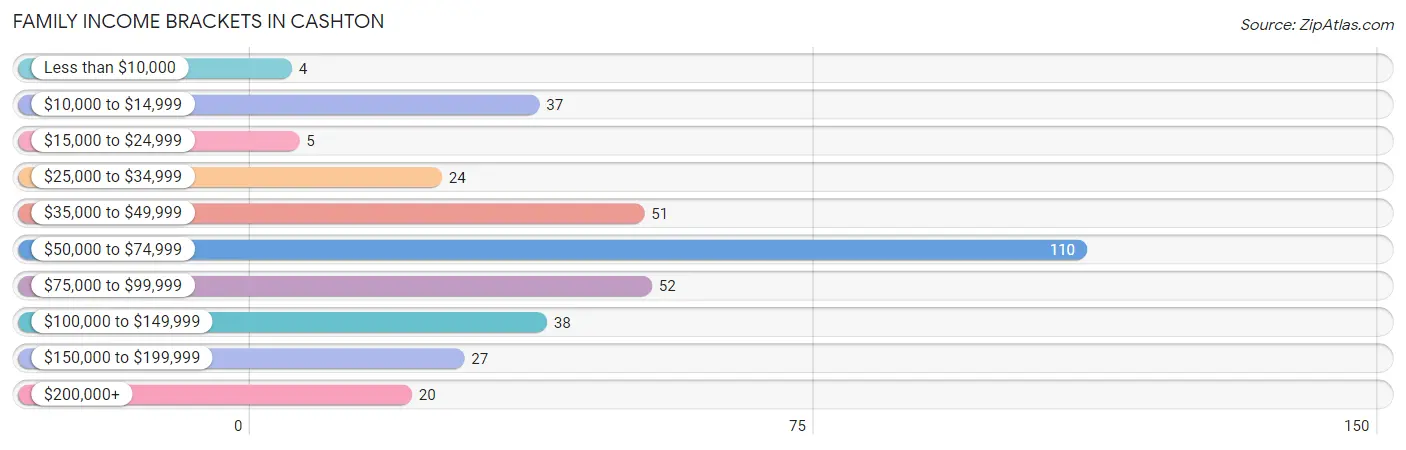
| Income Bracket | # Families | % Families |
| Less than $10,000 | 4 | 1.1% |
| $10,000 to $14,999 | 37 | 10.1% |
| $15,000 to $24,999 | 5 | 1.4% |
| $25,000 to $34,999 | 24 | 6.5% |
| $35,000 to $49,999 | 51 | 13.9% |
| $50,000 to $74,999 | 110 | 29.9% |
| $75,000 to $99,999 | 52 | 14.1% |
| $100,000 to $149,999 | 38 | 10.3% |
| $150,000 to $199,999 | 27 | 7.3% |
| $200,000+ | 20 | 5.4% |
Family Income by Famaliy Size in Cashton
3-person families (56 | 15.2%) account for the highest median family income in Cashton with $98,333 per family, while 2-person families (172 | 46.7%) have the highest median income of $34,238 per family member.
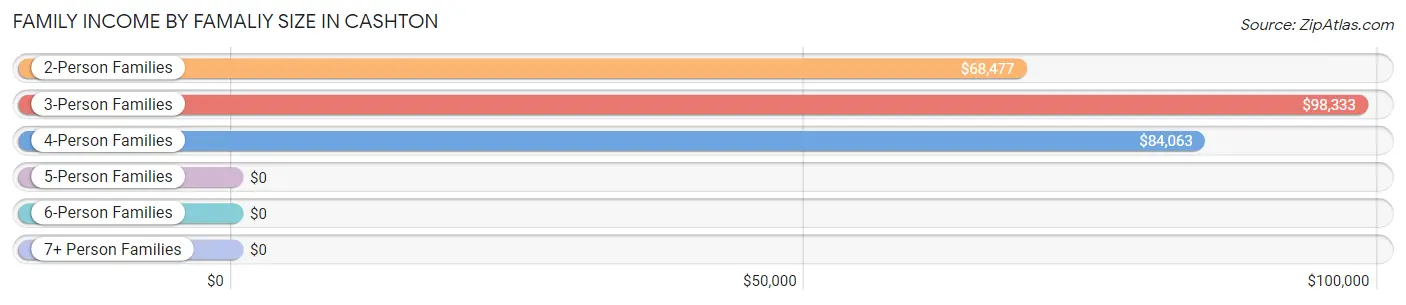
| Income Bracket | # Families | Median Income |
| 2-Person Families | 172 (46.7%) | $68,477 |
| 3-Person Families | 56 (15.2%) | $98,333 |
| 4-Person Families | 68 (18.5%) | $84,063 |
| 5-Person Families | 70 (19.0%) | $0 |
| 6-Person Families | 2 (0.5%) | $0 |
| 7+ Person Families | 0 (0.0%) | $0 |
| Total | 368 (100.0%) | $68,477 |
Family Income by Number of Earners in Cashton
The median family income in Cashton is $68,477, with families comprising 3+ earners (18) having the highest median family income of $116,667, while families with 1 earner (79) have the lowest median family income of $39,716, accounting for 4.9% and 21.5% of families, respectively.
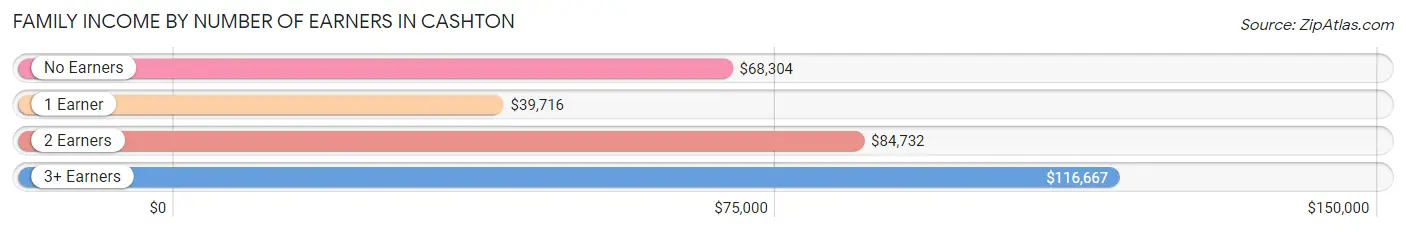
| Number of Earners | # Families | Median Income |
| No Earners | 88 (23.9%) | $68,304 |
| 1 Earner | 79 (21.5%) | $39,716 |
| 2 Earners | 183 (49.7%) | $84,732 |
| 3+ Earners | 18 (4.9%) | $116,667 |
| Total | 368 (100.0%) | $68,477 |
Household Income in Cashton
Household Income Brackets in Cashton
With 185 households falling in the category, the $50,000 to $74,999 income range is the most frequent in Cashton, accounting for 33.7% of all households. In contrast, only 15 households (2.7%) fall into the less than $10,000 income bracket, making it the least populous group.
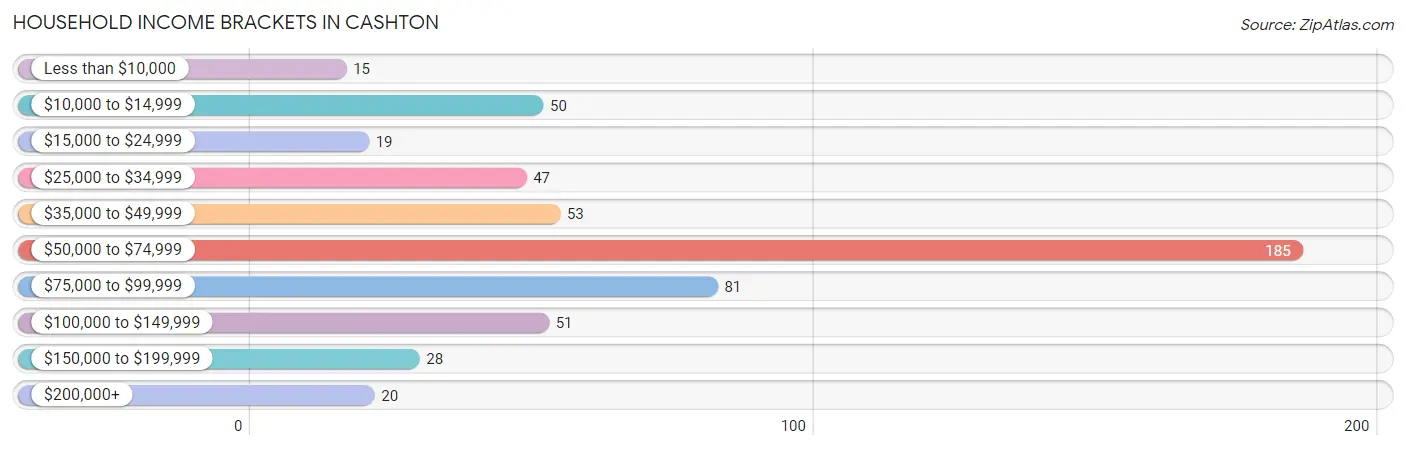
| Income Bracket | # Households | % Households |
| Less than $10,000 | 15 | 2.7% |
| $10,000 to $14,999 | 50 | 9.1% |
| $15,000 to $24,999 | 19 | 3.5% |
| $25,000 to $34,999 | 47 | 8.6% |
| $35,000 to $49,999 | 53 | 9.7% |
| $50,000 to $74,999 | 185 | 33.7% |
| $75,000 to $99,999 | 81 | 14.8% |
| $100,000 to $149,999 | 51 | 9.3% |
| $150,000 to $199,999 | 28 | 5.1% |
| $200,000+ | 20 | 3.6% |
Household Income by Householder Age in Cashton
The median household income in Cashton is $64,625, with the highest median household income of $77,554 found in the 25 to 44 years age bracket for the primary householder. A total of 177 households (32.2%) fall into this category. Meanwhile, the 15 to 24 years age bracket for the primary householder has the lowest median household income of $0, with 25 households (4.5%) in this group.
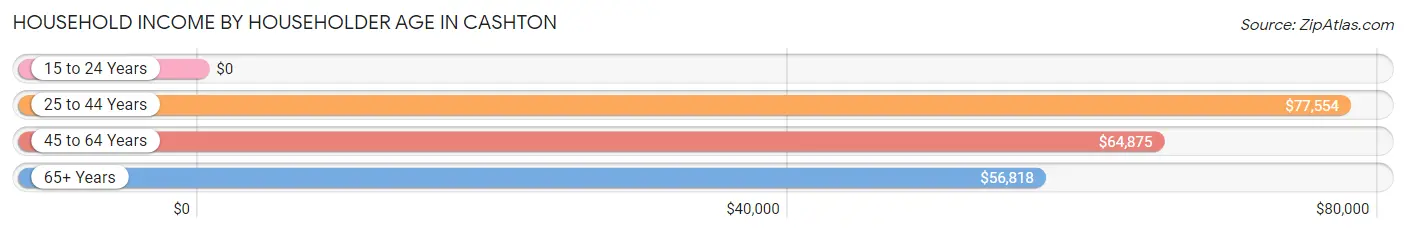
| Income Bracket | # Households | Median Income |
| 15 to 24 Years | 25 (4.5%) | $0 |
| 25 to 44 Years | 177 (32.2%) | $77,554 |
| 45 to 64 Years | 155 (28.2%) | $64,875 |
| 65+ Years | 192 (35.0%) | $56,818 |
| Total | 549 (100.0%) | $64,625 |
Poverty in Cashton
Income Below Poverty by Sex and Age in Cashton
With 17.0% poverty level for males and 17.3% for females among the residents of Cashton, 12 to 14 year old males and under 5 year old females are the most vulnerable to poverty, with 33 males (71.7%) and 28 females (51.8%) in their respective age groups living below the poverty level.
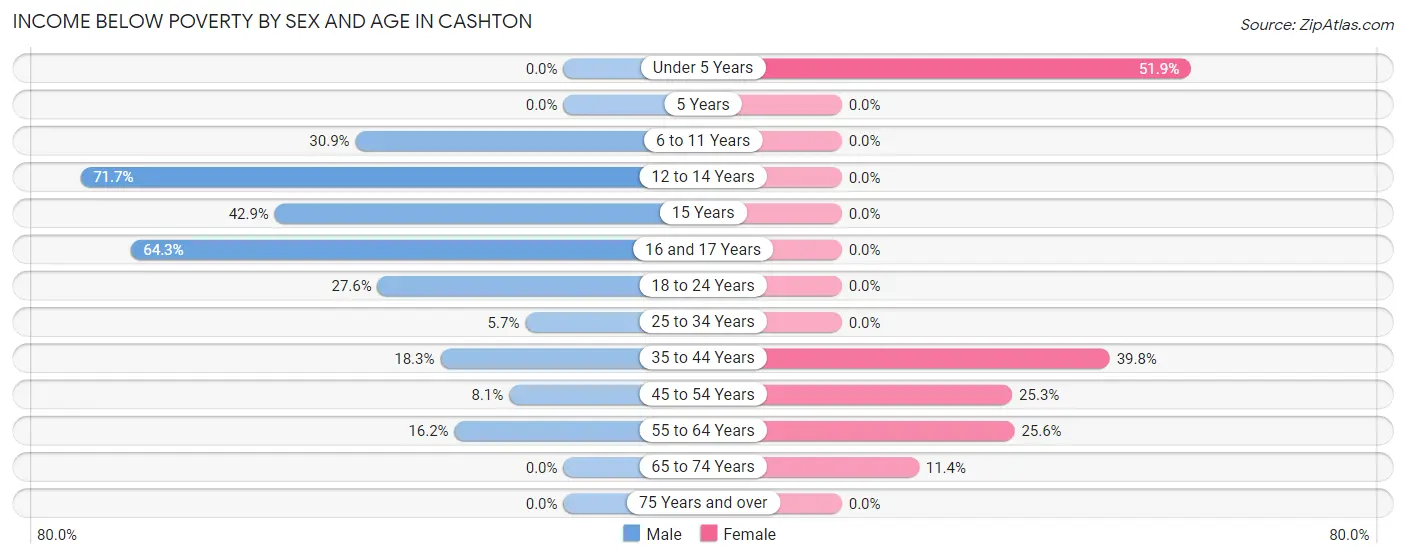
| Age Bracket | Male | Female |
| Under 5 Years | 0 (0.0%) | 28 (51.8%) |
| 5 Years | 0 (0.0%) | 0 (0.0%) |
| 6 to 11 Years | 21 (30.9%) | 0 (0.0%) |
| 12 to 14 Years | 33 (71.7%) | 0 (0.0%) |
| 15 Years | 3 (42.9%) | 0 (0.0%) |
| 16 and 17 Years | 18 (64.3%) | 0 (0.0%) |
| 18 to 24 Years | 8 (27.6%) | 0 (0.0%) |
| 25 to 34 Years | 3 (5.7%) | 0 (0.0%) |
| 35 to 44 Years | 19 (18.3%) | 37 (39.8%) |
| 45 to 54 Years | 7 (8.1%) | 21 (25.3%) |
| 55 to 64 Years | 11 (16.2%) | 10 (25.6%) |
| 65 to 74 Years | 0 (0.0%) | 4 (11.4%) |
| 75 Years and over | 0 (0.0%) | 0 (0.0%) |
| Total | 123 (17.0%) | 100 (17.3%) |
Income Above Poverty by Sex and Age in Cashton
According to the poverty statistics in Cashton, males aged under 5 years and females aged 5 years are the age groups that are most secure financially, with 100.0% of males and 100.0% of females in these age groups living above the poverty line.
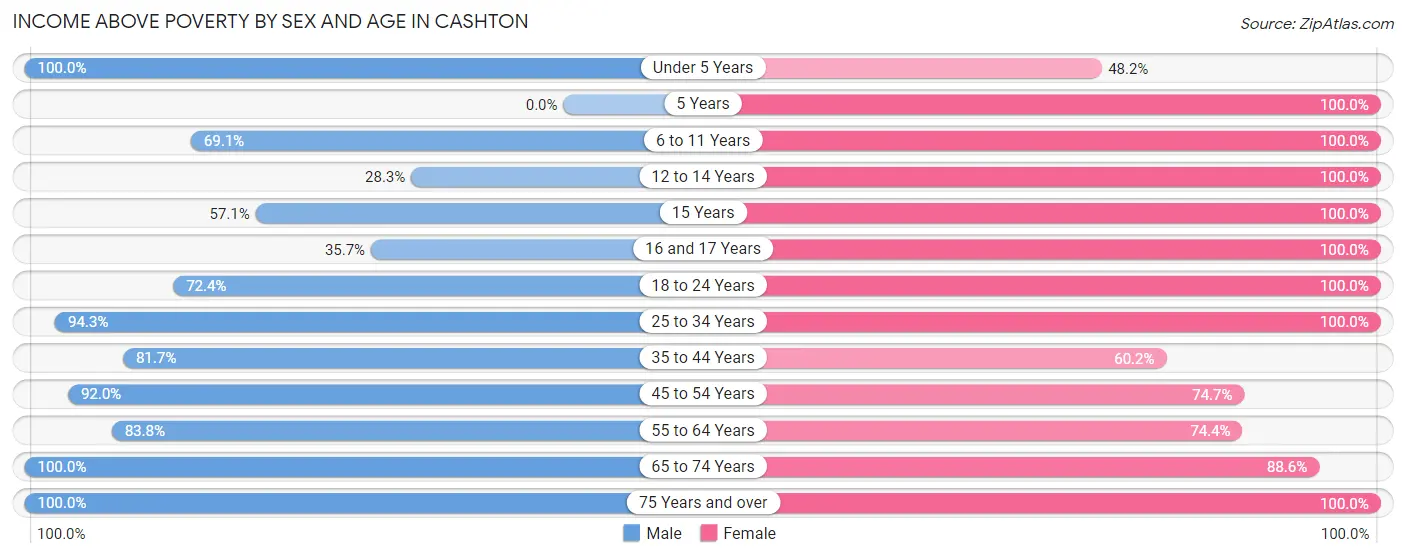
| Age Bracket | Male | Female |
| Under 5 Years | 63 (100.0%) | 26 (48.1%) |
| 5 Years | 0 (0.0%) | 6 (100.0%) |
| 6 to 11 Years | 47 (69.1%) | 72 (100.0%) |
| 12 to 14 Years | 13 (28.3%) | 48 (100.0%) |
| 15 Years | 4 (57.1%) | 13 (100.0%) |
| 16 and 17 Years | 10 (35.7%) | 13 (100.0%) |
| 18 to 24 Years | 21 (72.4%) | 28 (100.0%) |
| 25 to 34 Years | 50 (94.3%) | 56 (100.0%) |
| 35 to 44 Years | 85 (81.7%) | 56 (60.2%) |
| 45 to 54 Years | 80 (91.9%) | 62 (74.7%) |
| 55 to 64 Years | 57 (83.8%) | 29 (74.4%) |
| 65 to 74 Years | 135 (100.0%) | 31 (88.6%) |
| 75 Years and over | 36 (100.0%) | 39 (100.0%) |
| Total | 601 (83.0%) | 479 (82.7%) |
Income Below Poverty Among Married-Couple Families in Cashton
The poverty statistics for married-couple families in Cashton show that 6.4% or 17 of the total 265 families live below the poverty line. Families with 3 or 4 children have the highest poverty rate of 48.6%, comprising of 17 families. On the other hand, families with no children have the lowest poverty rate of 0.0%, which includes 0 families.
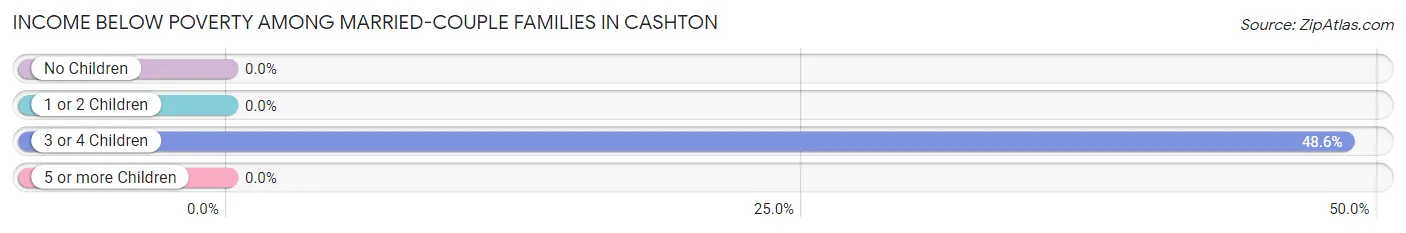
| Children | Above Poverty | Below Poverty |
| No Children | 143 (100.0%) | 0 (0.0%) |
| 1 or 2 Children | 87 (100.0%) | 0 (0.0%) |
| 3 or 4 Children | 18 (51.4%) | 17 (48.6%) |
| 5 or more Children | 0 (0.0%) | 0 (0.0%) |
| Total | 248 (93.6%) | 17 (6.4%) |
Income Below Poverty Among Single-Parent Households in Cashton
According to the poverty data in Cashton, 13.2% or 7 single-father households and 74.0% or 37 single-mother households are living below the poverty line. Among single-father households, those with 1 or 2 children have the highest poverty rate, with 4 households (19.1%) experiencing poverty. Likewise, among single-mother households, those with 1 or 2 children have the highest poverty rate, with 37 households (82.2%) falling below the poverty line.
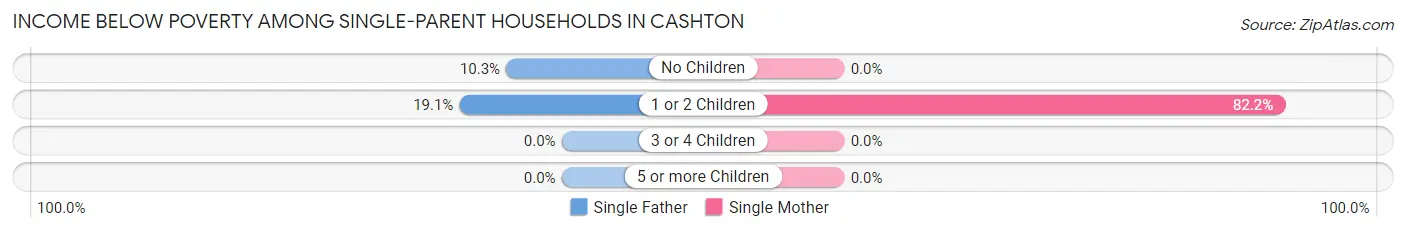
| Children | Single Father | Single Mother |
| No Children | 3 (10.3%) | 0 (0.0%) |
| 1 or 2 Children | 4 (19.1%) | 37 (82.2%) |
| 3 or 4 Children | 0 (0.0%) | 0 (0.0%) |
| 5 or more Children | 0 (0.0%) | 0 (0.0%) |
| Total | 7 (13.2%) | 37 (74.0%) |
Income Below Poverty Among Married-Couple vs Single-Parent Households in Cashton
The poverty data for Cashton shows that 17 of the married-couple family households (6.4%) and 44 of the single-parent households (42.7%) are living below the poverty level. Within the married-couple family households, those with 3 or 4 children have the highest poverty rate, with 17 households (48.6%) falling below the poverty line. Among the single-parent households, those with 1 or 2 children have the highest poverty rate, with 41 household (62.1%) living below poverty.
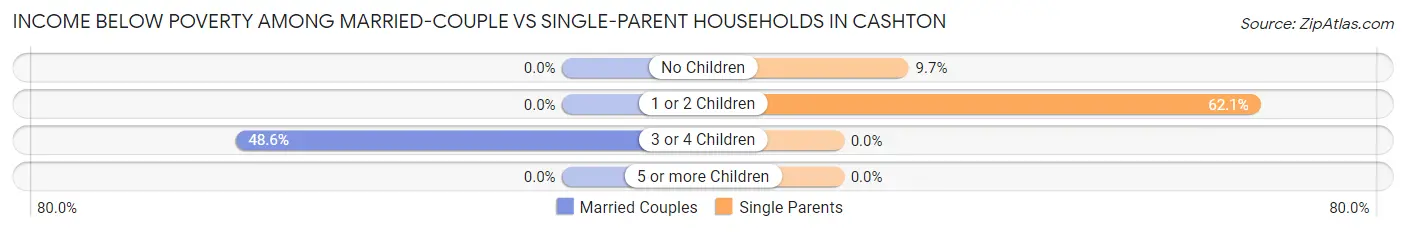
| Children | Married-Couple Families | Single-Parent Households |
| No Children | 0 (0.0%) | 3 (9.7%) |
| 1 or 2 Children | 0 (0.0%) | 41 (62.1%) |
| 3 or 4 Children | 17 (48.6%) | 0 (0.0%) |
| 5 or more Children | 0 (0.0%) | 0 (0.0%) |
| Total | 17 (6.4%) | 44 (42.7%) |
Race in Cashton
The most populous races in Cashton are White / Caucasian (990 | 76.0%), Hispanic or Latino (355 | 27.2%), and Some other Race (240 | 18.4%).
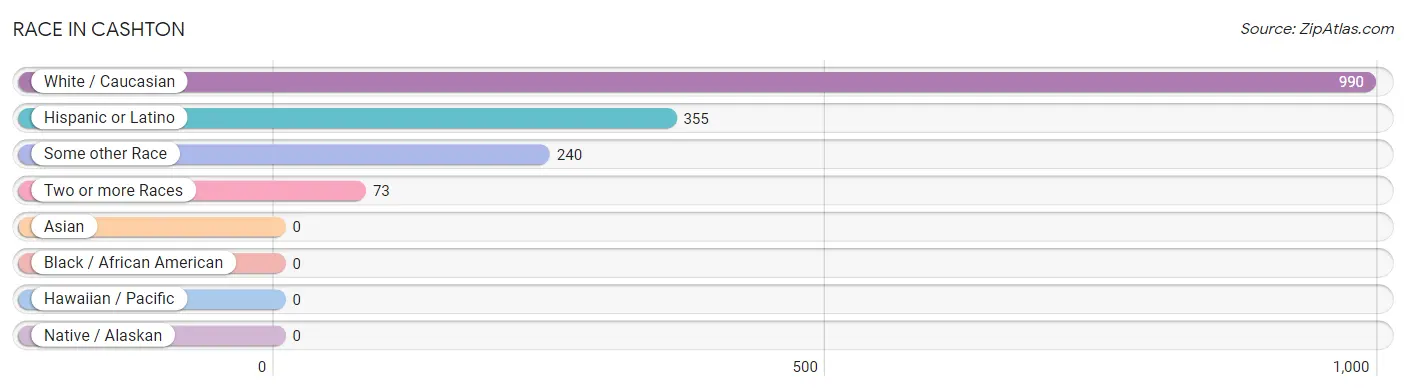
| Race | # Population | % Population |
| Asian | 0 | 0.0% |
| Black / African American | 0 | 0.0% |
| Hawaiian / Pacific | 0 | 0.0% |
| Hispanic or Latino | 355 | 27.2% |
| Native / Alaskan | 0 | 0.0% |
| White / Caucasian | 990 | 76.0% |
| Two or more Races | 73 | 5.6% |
| Some other Race | 240 | 18.4% |
| Total | 1,303 | 100.0% |
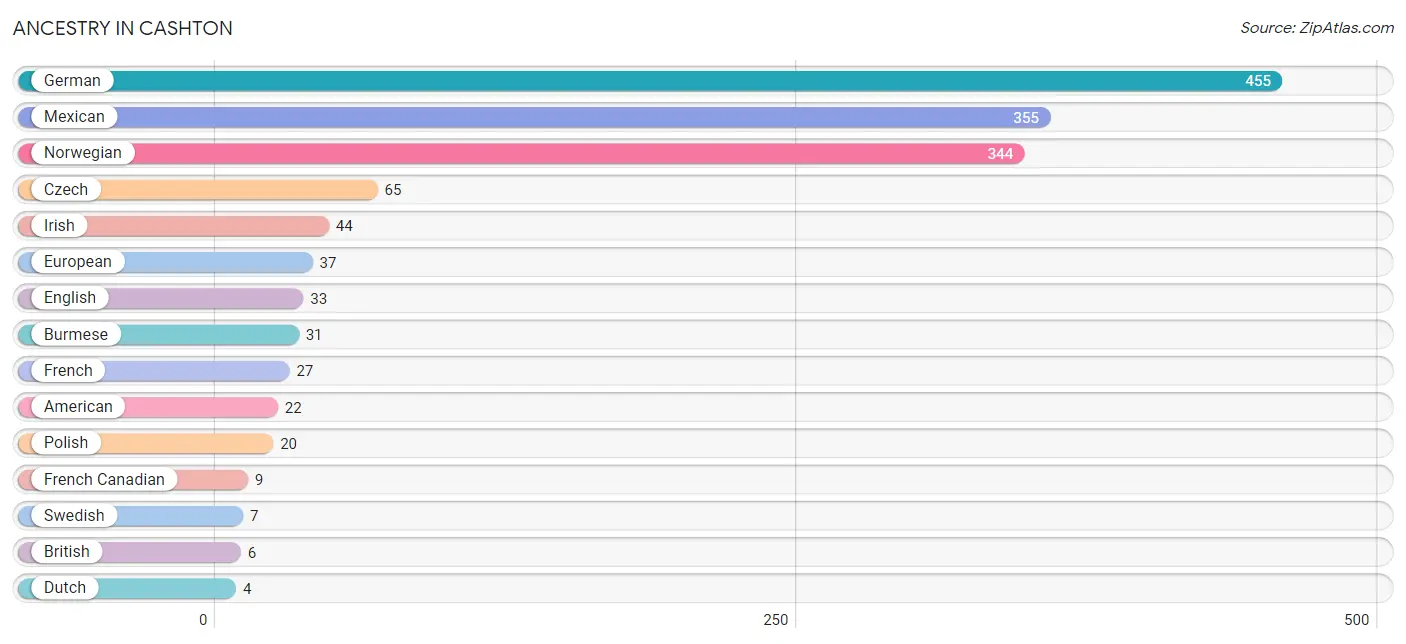
Ancestry in Cashton
The most populous ancestries reported in Cashton are German (455 | 34.9%), Mexican (355 | 27.2%), Norwegian (344 | 26.4%), Czech (65 | 5.0%), and Irish (44 | 3.4%), together accounting for 96.9% of all Cashton residents.
| Ancestry | # Population | % Population |
| American | 22 | 1.7% |
| British | 6 | 0.5% |
| Burmese | 31 | 2.4% |
| Canadian | 3 | 0.2% |
| Czech | 65 | 5.0% |
| Dutch | 4 | 0.3% |
| English | 33 | 2.5% |
| European | 37 | 2.8% |
| French | 27 | 2.1% |
| French Canadian | 9 | 0.7% |
| German | 455 | 34.9% |
| Greek | 3 | 0.2% |
| Irish | 44 | 3.4% |
| Italian | 3 | 0.2% |
| Mexican | 355 | 27.2% |
| Norwegian | 344 | 26.4% |
| Polish | 20 | 1.5% |
| Russian | 3 | 0.2% |
| Scandinavian | 1 | 0.1% |
| Scottish | 2 | 0.2% |
| Swedish | 7 | 0.5% |
| Welsh | 3 | 0.2% | View All 22 Rows |
Immigrants in Cashton
The most numerous immigrant groups reported in Cashton came from Latin America (88 | 6.8%), Central America (84 | 6.5%), Mexico (84 | 6.5%), Europe (15 | 1.1%), and Northern Europe (12 | 0.9%), together accounting for 21.7% of all Cashton residents.
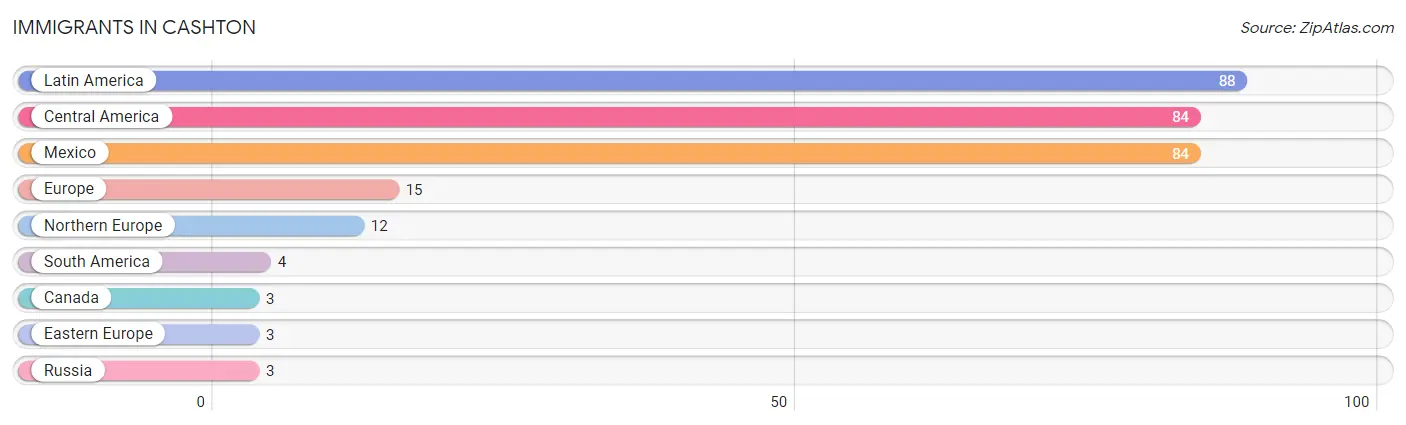
| Immigration Origin | # Population | % Population |
| Canada | 3 | 0.2% |
| Central America | 84 | 6.5% |
| Eastern Europe | 3 | 0.2% |
| Europe | 15 | 1.1% |
| Latin America | 88 | 6.8% |
| Mexico | 84 | 6.5% |
| Northern Europe | 12 | 0.9% |
| Russia | 3 | 0.2% |
| South America | 4 | 0.3% | View All 9 Rows |
Sex and Age in Cashton
Sex and Age in Cashton
The most populous age groups in Cashton are 70 to 74 Years (114 | 15.8%) for men and 10 to 14 Years (67 | 11.6%) for women.
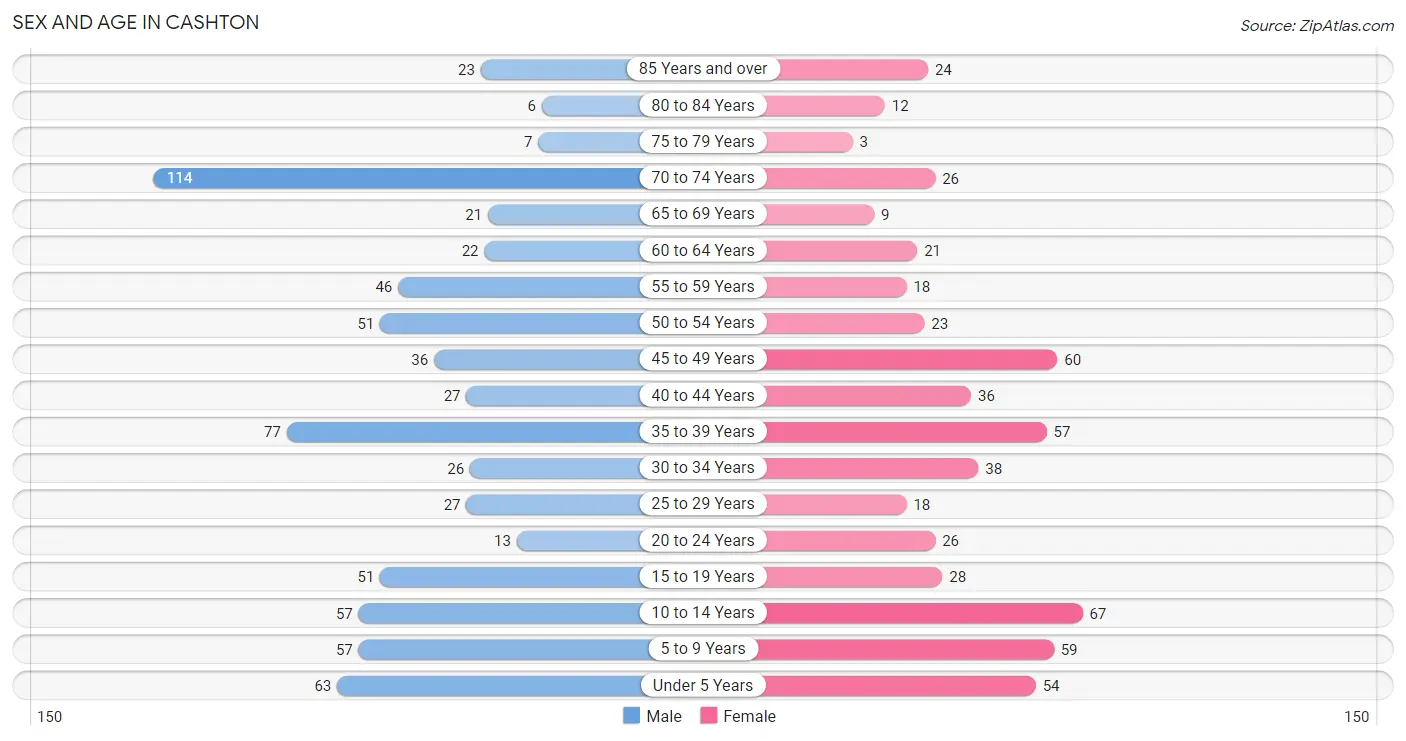
| Age Bracket | Male | Female |
| Under 5 Years | 63 (8.7%) | 54 (9.3%) |
| 5 to 9 Years | 57 (7.9%) | 59 (10.2%) |
| 10 to 14 Years | 57 (7.9%) | 67 (11.6%) |
| 15 to 19 Years | 51 (7.0%) | 28 (4.8%) |
| 20 to 24 Years | 13 (1.8%) | 26 (4.5%) |
| 25 to 29 Years | 27 (3.7%) | 18 (3.1%) |
| 30 to 34 Years | 26 (3.6%) | 38 (6.6%) |
| 35 to 39 Years | 77 (10.6%) | 57 (9.8%) |
| 40 to 44 Years | 27 (3.7%) | 36 (6.2%) |
| 45 to 49 Years | 36 (5.0%) | 60 (10.4%) |
| 50 to 54 Years | 51 (7.0%) | 23 (4.0%) |
| 55 to 59 Years | 46 (6.4%) | 18 (3.1%) |
| 60 to 64 Years | 22 (3.0%) | 21 (3.6%) |
| 65 to 69 Years | 21 (2.9%) | 9 (1.5%) |
| 70 to 74 Years | 114 (15.8%) | 26 (4.5%) |
| 75 to 79 Years | 7 (1.0%) | 3 (0.5%) |
| 80 to 84 Years | 6 (0.8%) | 12 (2.1%) |
| 85 Years and over | 23 (3.2%) | 24 (4.2%) |
| Total | 724 (100.0%) | 579 (100.0%) |
Families and Households in Cashton
Median Family Size in Cashton
The median family size in Cashton is 2.93 persons per family, with married-couple families (265 | 72.0%) accounting for the largest median family size of 3.12 persons per family. On the other hand, single male/father families (53 | 14.4%) represent the smallest median family size with 2.43 persons per family.
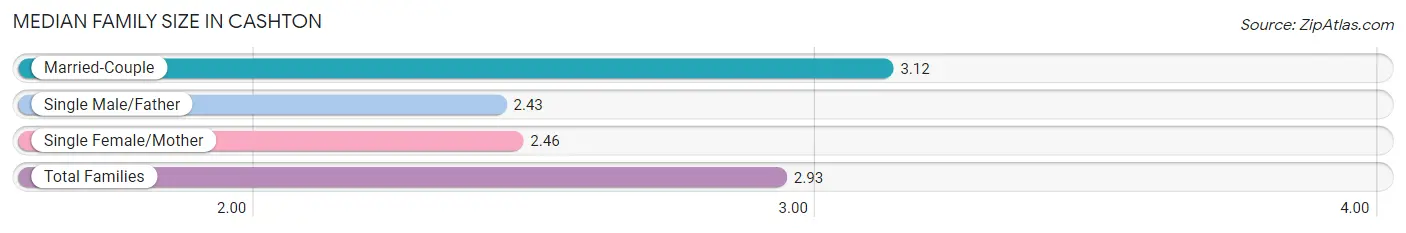
| Family Type | # Families | Family Size |
| Married-Couple | 265 (72.0%) | 3.12 |
| Single Male/Father | 53 (14.4%) | 2.43 |
| Single Female/Mother | 50 (13.6%) | 2.46 |
| Total Families | 368 (100.0%) | 2.93 |
Median Household Size in Cashton
The median household size in Cashton is 2.37 persons per household, with married-couple households (265 | 48.3%) accounting for the largest median household size of 3.15 persons per household. non-family households (181 | 33.0%) represent the smallest median household size with 1.08 persons per household.
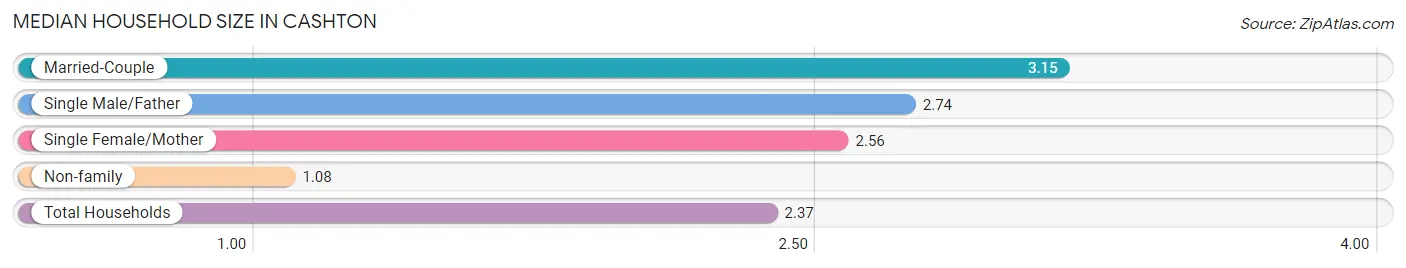
| Household Type | # Households | Household Size |
| Married-Couple | 265 (48.3%) | 3.15 |
| Single Male/Father | 53 (9.7%) | 2.74 |
| Single Female/Mother | 50 (9.1%) | 2.56 |
| Non-family | 181 (33.0%) | 1.08 |
| Total Households | 549 (100.0%) | 2.37 |
Household Size by Marriage Status in Cashton
Out of a total of 549 households in Cashton, 368 (67.0%) are family households, while 181 (33.0%) are nonfamily households. The most numerous type of family households are 2-person households, comprising 169, and the most common type of nonfamily households are 1-person households, comprising 170.
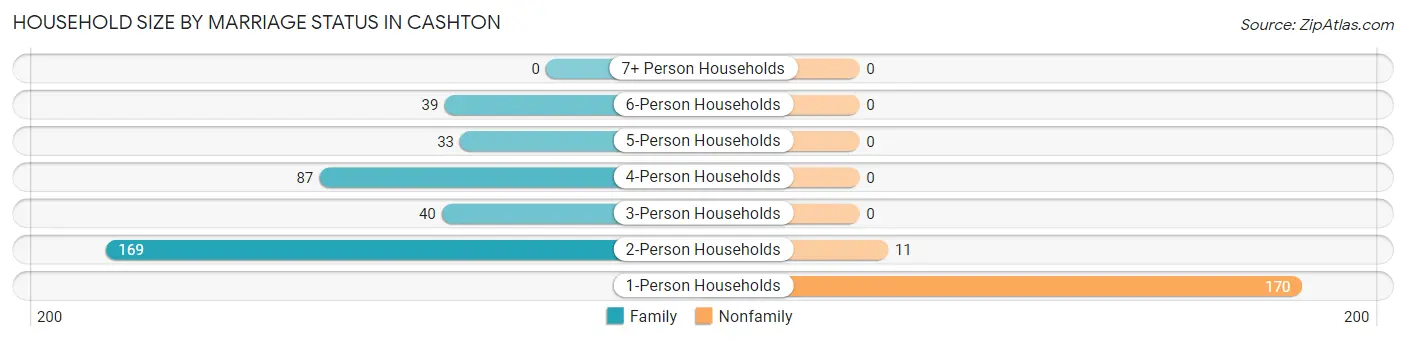
| Household Size | Family Households | Nonfamily Households |
| 1-Person Households | - | 170 (31.0%) |
| 2-Person Households | 169 (30.8%) | 11 (2.0%) |
| 3-Person Households | 40 (7.3%) | 0 (0.0%) |
| 4-Person Households | 87 (15.9%) | 0 (0.0%) |
| 5-Person Households | 33 (6.0%) | 0 (0.0%) |
| 6-Person Households | 39 (7.1%) | 0 (0.0%) |
| 7+ Person Households | 0 (0.0%) | 0 (0.0%) |
| Total | 368 (67.0%) | 181 (33.0%) |
Female Fertility in Cashton
Fertility by Age in Cashton
Average fertility rate in Cashton is 44.0 births per 1,000 women. Women in the age bracket of 20 to 34 years have the highest fertility rate with 146.0 births per 1,000 women. Women in the age bracket of 20 to 34 years acount for 100.0% of all women with births.
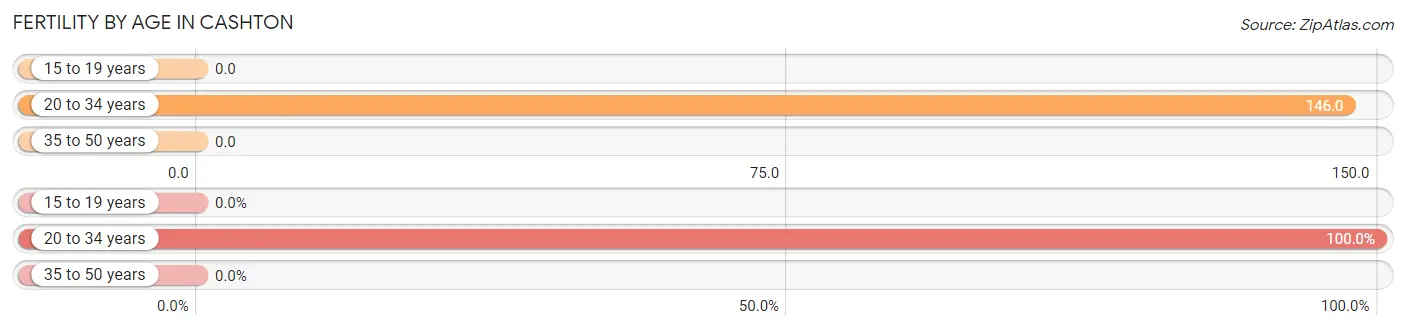
| Age Bracket | Women with Births | Births / 1,000 Women |
| 15 to 19 years | 0 (0.0%) | 0.0 |
| 20 to 34 years | 12 (100.0%) | 146.0 |
| 35 to 50 years | 0 (0.0%) | 0.0 |
| Total | 12 (100.0%) | 44.0 |
Fertility by Age by Marriage Status in Cashton
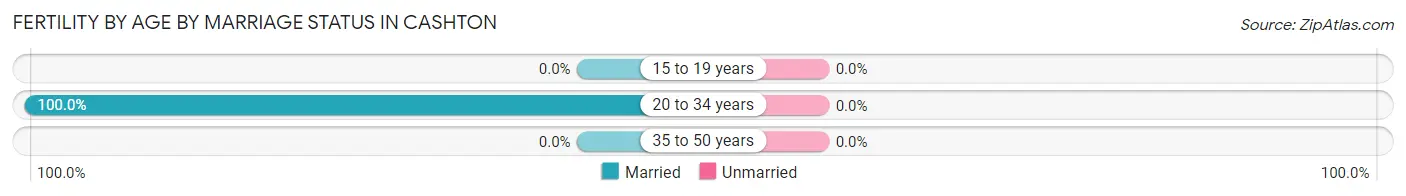
| Age Bracket | Married | Unmarried |
| 15 to 19 years | 0 (0.0%) | 0 (0.0%) |
| 20 to 34 years | 12 (100.0%) | 0 (0.0%) |
| 35 to 50 years | 0 (0.0%) | 0 (0.0%) |
| Total | 12 (100.0%) | 0 (0.0%) |
Fertility by Education in Cashton
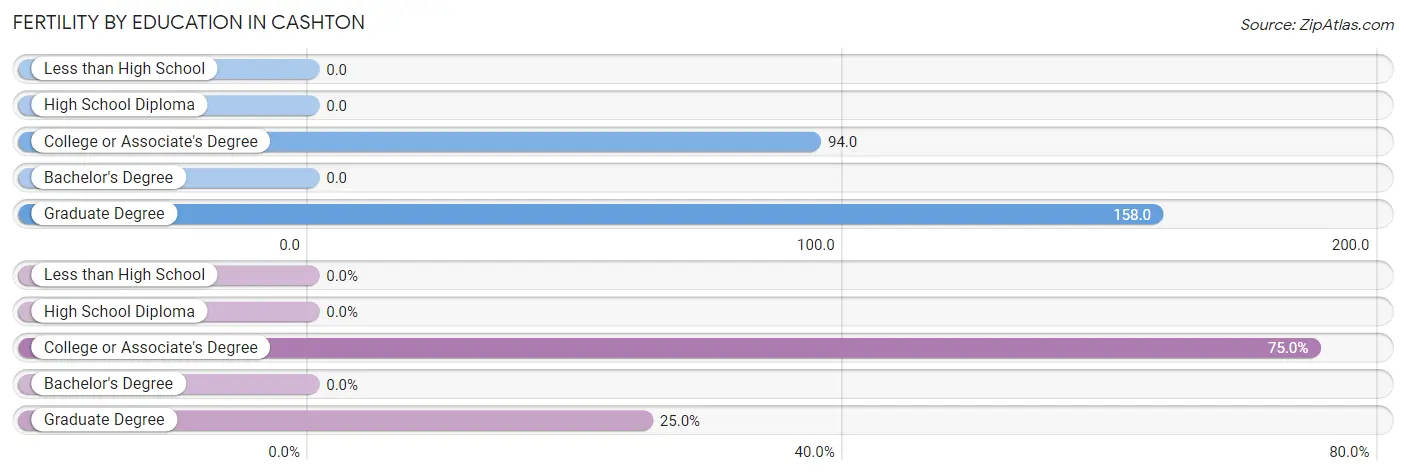
| Educational Attainment | Women with Births | Births / 1,000 Women |
| Less than High School | 0 (0.0%) | 0.0 |
| High School Diploma | 0 (0.0%) | 0.0 |
| College or Associate's Degree | 9 (75.0%) | 94.0 |
| Bachelor's Degree | 0 (0.0%) | 0.0 |
| Graduate Degree | 3 (25.0%) | 158.0 |
| Total | 12 (100.0%) | 44.0 |
Fertility by Education by Marriage Status in Cashton
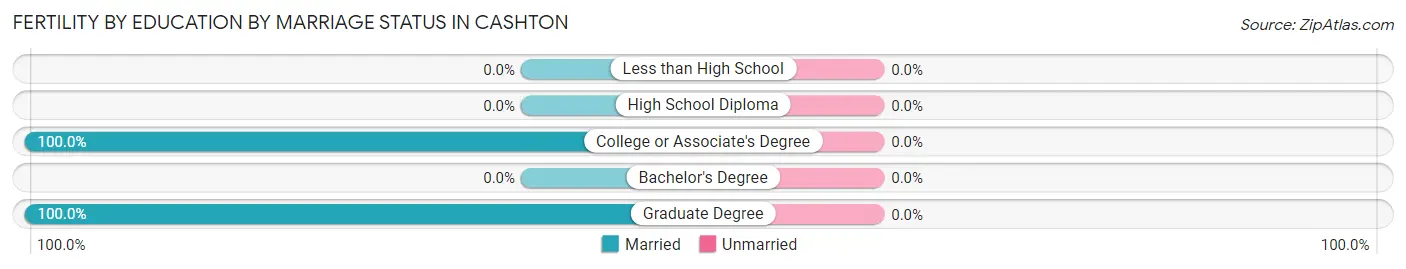
| Educational Attainment | Married | Unmarried |
| Less than High School | 0 (0.0%) | 0 (0.0%) |
| High School Diploma | 0 (0.0%) | 0 (0.0%) |
| College or Associate's Degree | 9 (100.0%) | 0 (0.0%) |
| Bachelor's Degree | 0 (0.0%) | 0 (0.0%) |
| Graduate Degree | 3 (100.0%) | 0 (0.0%) |
| Total | 12 (100.0%) | 0 (0.0%) |
Employment Characteristics in Cashton
Employment by Class of Employer in Cashton
Among the 515 employed individuals in Cashton, private company employees (374 | 72.6%), local government employees (56 | 10.9%), and self-employed (not incorporated) (32 | 6.2%) make up the most common classes of employment.
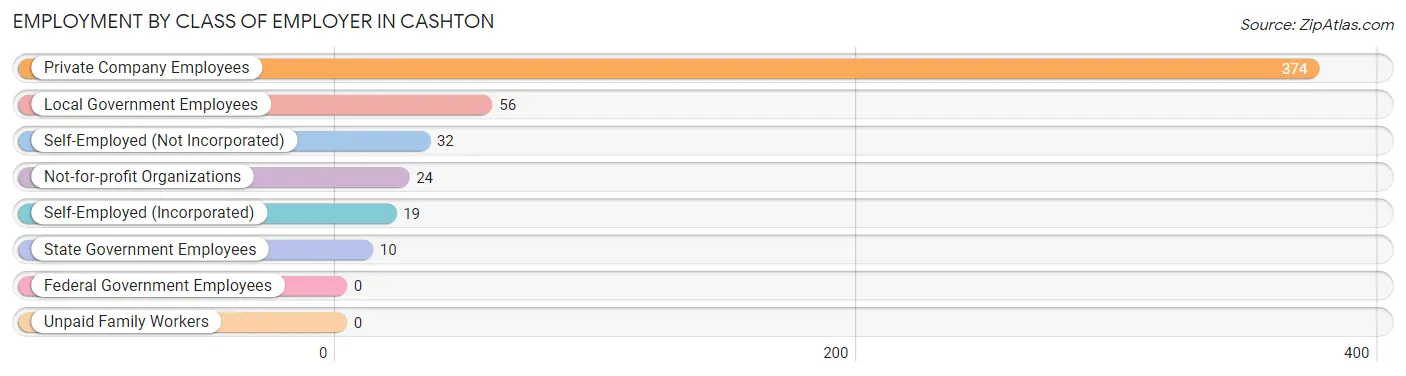
| Employer Class | # Employees | % Employees |
| Private Company Employees | 374 | 72.6% |
| Self-Employed (Incorporated) | 19 | 3.7% |
| Self-Employed (Not Incorporated) | 32 | 6.2% |
| Not-for-profit Organizations | 24 | 4.7% |
| Local Government Employees | 56 | 10.9% |
| State Government Employees | 10 | 1.9% |
| Federal Government Employees | 0 | 0.0% |
| Unpaid Family Workers | 0 | 0.0% |
| Total | 515 | 100.0% |
Employment Status by Age in Cashton
According to the labor force statistics for Cashton, out of the total population over 16 years of age (926), 58.3% or 540 individuals are in the labor force, with 2.8% or 15 of them unemployed. The age group with the highest labor force participation rate is 30 to 34 years, with 100.0% or 64 individuals in the labor force. Within the labor force, the 30 to 34 years age range has the highest percentage of unemployed individuals, with 23.4% or 15 of them being unemployed.
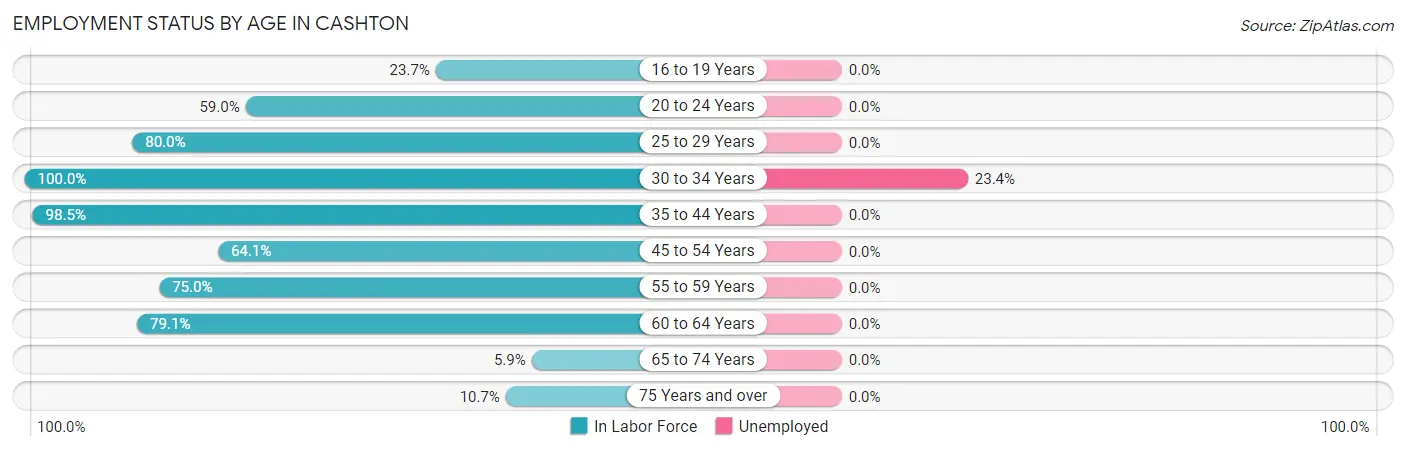
| Age Bracket | In Labor Force | Unemployed |
| 16 to 19 Years | 14 (23.7%) | 0 (0.0%) |
| 20 to 24 Years | 23 (59.0%) | 0 (0.0%) |
| 25 to 29 Years | 36 (80.0%) | 0 (0.0%) |
| 30 to 34 Years | 64 (100.0%) | 15 (23.4%) |
| 35 to 44 Years | 194 (98.5%) | 0 (0.0%) |
| 45 to 54 Years | 109 (64.1%) | 0 (0.0%) |
| 55 to 59 Years | 48 (75.0%) | 0 (0.0%) |
| 60 to 64 Years | 34 (79.1%) | 0 (0.0%) |
| 65 to 74 Years | 10 (5.9%) | 0 (0.0%) |
| 75 Years and over | 8 (10.7%) | 0 (0.0%) |
| Total | 540 (58.3%) | 15 (2.8%) |
Employment Status by Educational Attainment in Cashton
According to labor force statistics for Cashton, 83.2% of individuals (485) out of the total population between 25 and 64 years of age (583) are in the labor force, with 3.1% or 15 of them being unemployed. The group with the highest labor force participation rate are those with the educational attainment of high school diploma, with 94.3% or 148 individuals in the labor force. Within the labor force, individuals with college / associate degree education have the highest percentage of unemployment, with 5.8% or 9 of them being unemployed.
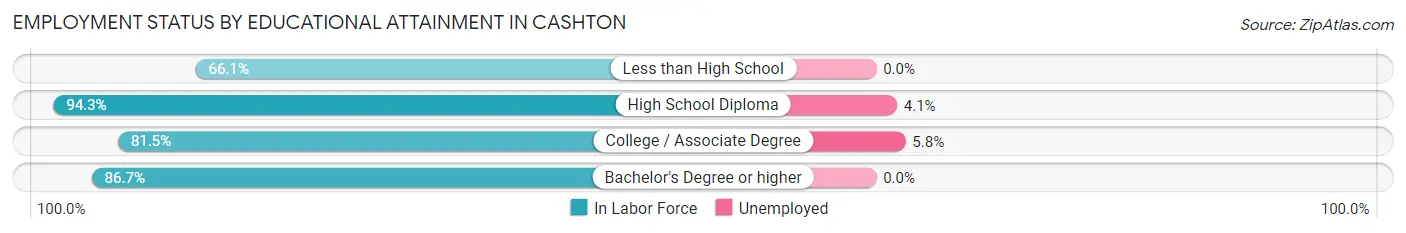
| Educational Attainment | In Labor Force | Unemployed |
| Less than High School | 72 (66.1%) | 0 (0.0%) |
| High School Diploma | 148 (94.3%) | 6 (4.1%) |
| College / Associate Degree | 154 (81.5%) | 11 (5.8%) |
| Bachelor's Degree or higher | 111 (86.7%) | 0 (0.0%) |
| Total | 485 (83.2%) | 18 (3.1%) |
Employment Occupations by Sex in Cashton
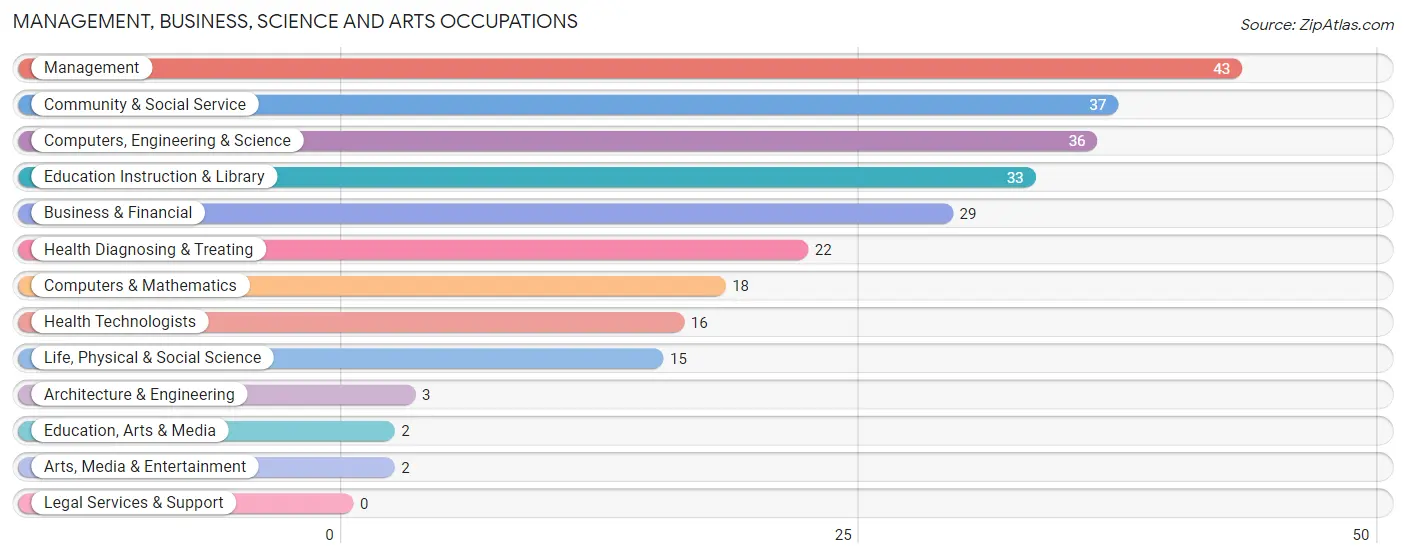
Management, Business, Science and Arts Occupations
The most common Management, Business, Science and Arts occupations in Cashton are Management (43 | 8.2%), Community & Social Service (37 | 7.0%), Computers, Engineering & Science (36 | 6.9%), Education Instruction & Library (33 | 6.3%), and Business & Financial (29 | 5.5%).
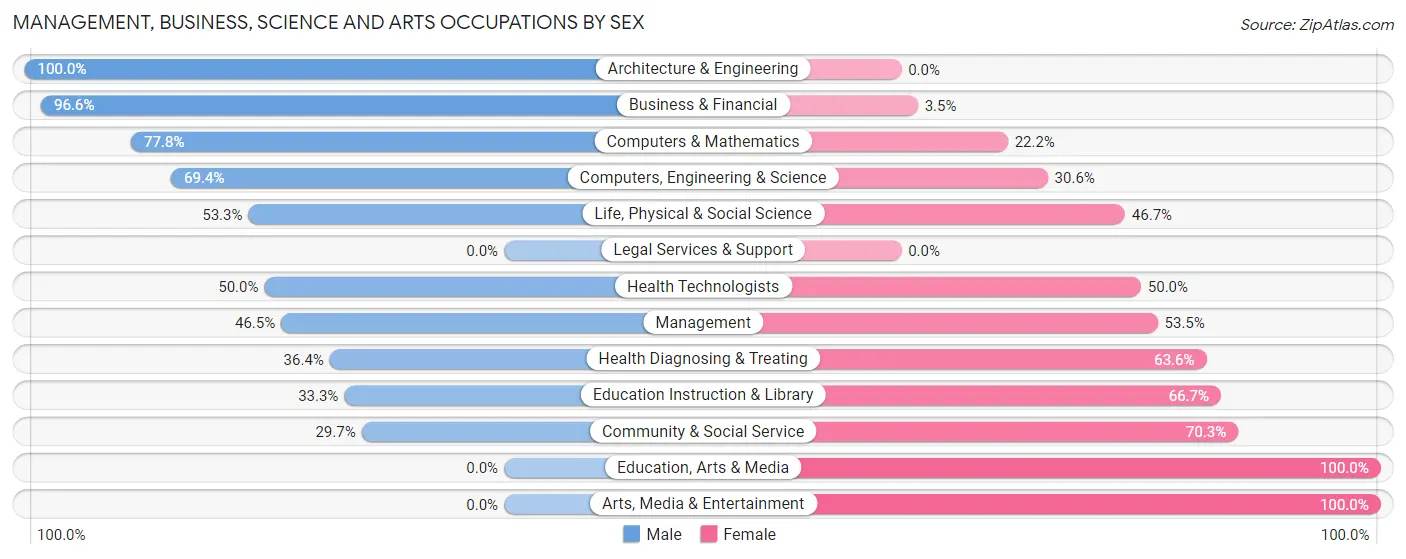
Management, Business, Science and Arts Occupations by Sex
Within the Management, Business, Science and Arts occupations in Cashton, the most male-oriented occupations are Architecture & Engineering (100.0%), Business & Financial (96.6%), and Computers & Mathematics (77.8%), while the most female-oriented occupations are Education, Arts & Media (100.0%), Arts, Media & Entertainment (100.0%), and Community & Social Service (70.3%).
| Occupation | Male | Female |
| Management | 20 (46.5%) | 23 (53.5%) |
| Business & Financial | 28 (96.6%) | 1 (3.5%) |
| Computers, Engineering & Science | 25 (69.4%) | 11 (30.6%) |
| Computers & Mathematics | 14 (77.8%) | 4 (22.2%) |
| Architecture & Engineering | 3 (100.0%) | 0 (0.0%) |
| Life, Physical & Social Science | 8 (53.3%) | 7 (46.7%) |
| Community & Social Service | 11 (29.7%) | 26 (70.3%) |
| Education, Arts & Media | 0 (0.0%) | 2 (100.0%) |
| Legal Services & Support | 0 (0.0%) | 0 (0.0%) |
| Education Instruction & Library | 11 (33.3%) | 22 (66.7%) |
| Arts, Media & Entertainment | 0 (0.0%) | 2 (100.0%) |
| Health Diagnosing & Treating | 8 (36.4%) | 14 (63.6%) |
| Health Technologists | 8 (50.0%) | 8 (50.0%) |
| Total (Category) | 92 (55.1%) | 75 (44.9%) |
| Total (Overall) | 309 (58.9%) | 216 (41.1%) |
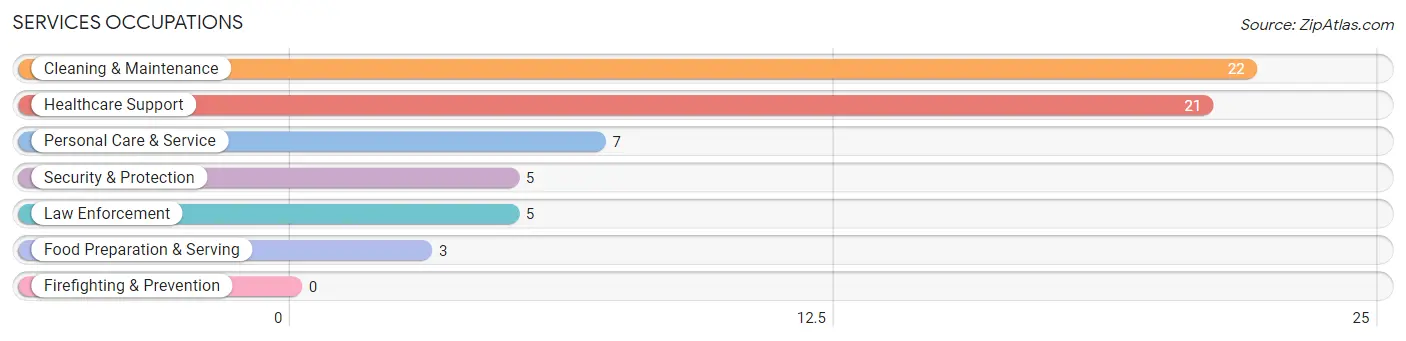
Services Occupations
The most common Services occupations in Cashton are Cleaning & Maintenance (22 | 4.2%), Healthcare Support (21 | 4.0%), Personal Care & Service (7 | 1.3%), Security & Protection (5 | 0.9%), and Law Enforcement (5 | 0.9%).
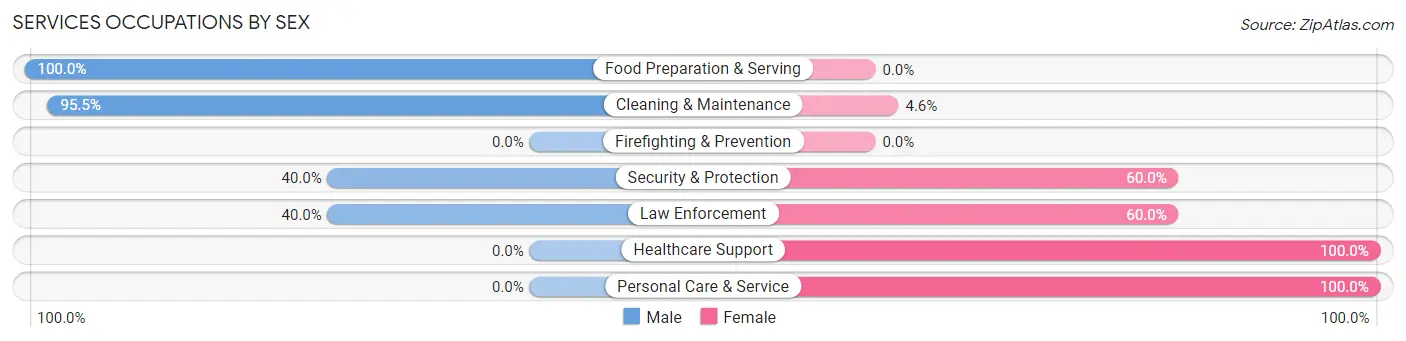
Services Occupations by Sex
Within the Services occupations in Cashton, the most male-oriented occupations are Food Preparation & Serving (100.0%), Cleaning & Maintenance (95.5%), and Security & Protection (40.0%), while the most female-oriented occupations are Healthcare Support (100.0%), Personal Care & Service (100.0%), and Security & Protection (60.0%).
| Occupation | Male | Female |
| Healthcare Support | 0 (0.0%) | 21 (100.0%) |
| Security & Protection | 2 (40.0%) | 3 (60.0%) |
| Firefighting & Prevention | 0 (0.0%) | 0 (0.0%) |
| Law Enforcement | 2 (40.0%) | 3 (60.0%) |
| Food Preparation & Serving | 3 (100.0%) | 0 (0.0%) |
| Cleaning & Maintenance | 21 (95.5%) | 1 (4.5%) |
| Personal Care & Service | 0 (0.0%) | 7 (100.0%) |
| Total (Category) | 26 (44.8%) | 32 (55.2%) |
| Total (Overall) | 309 (58.9%) | 216 (41.1%) |
Sales and Office Occupations
The most common Sales and Office occupations in Cashton are Sales & Related (48 | 9.1%), and Office & Administration (39 | 7.4%).
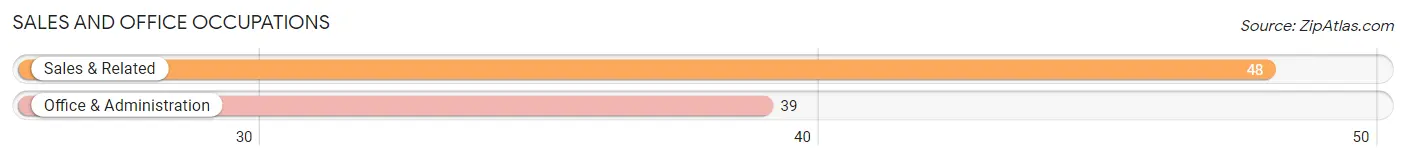
Sales and Office Occupations by Sex
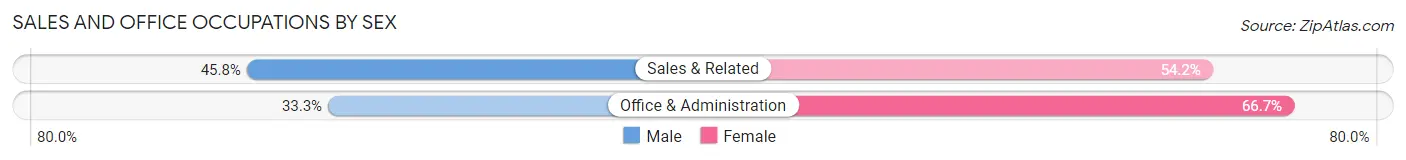
| Occupation | Male | Female |
| Sales & Related | 22 (45.8%) | 26 (54.2%) |
| Office & Administration | 13 (33.3%) | 26 (66.7%) |
| Total (Category) | 35 (40.2%) | 52 (59.8%) |
| Total (Overall) | 309 (58.9%) | 216 (41.1%) |
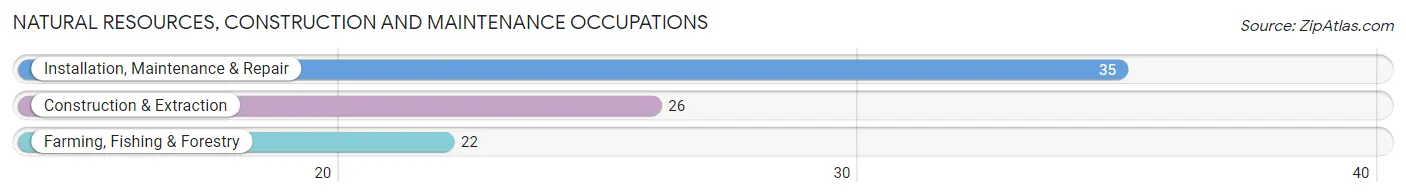
Natural Resources, Construction and Maintenance Occupations
The most common Natural Resources, Construction and Maintenance occupations in Cashton are Installation, Maintenance & Repair (35 | 6.7%), Construction & Extraction (26 | 5.0%), and Farming, Fishing & Forestry (22 | 4.2%).
Natural Resources, Construction and Maintenance Occupations by Sex
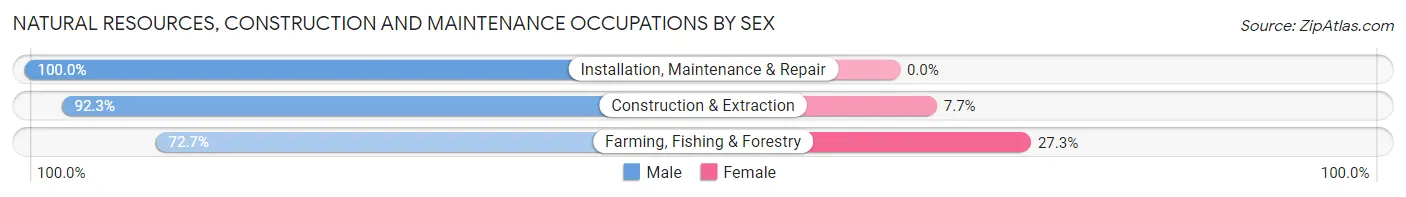
| Occupation | Male | Female |
| Farming, Fishing & Forestry | 16 (72.7%) | 6 (27.3%) |
| Construction & Extraction | 24 (92.3%) | 2 (7.7%) |
| Installation, Maintenance & Repair | 35 (100.0%) | 0 (0.0%) |
| Total (Category) | 75 (90.4%) | 8 (9.6%) |
| Total (Overall) | 309 (58.9%) | 216 (41.1%) |
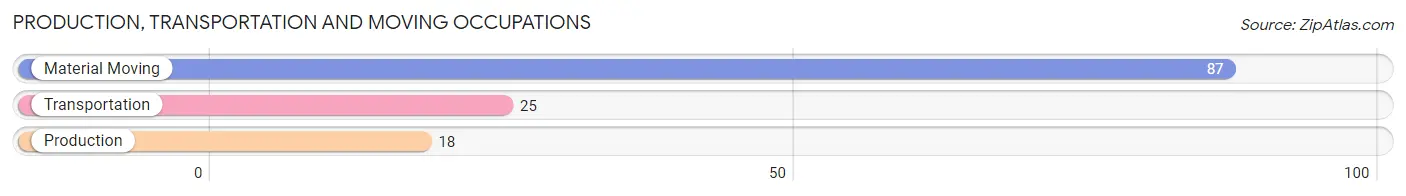
Production, Transportation and Moving Occupations
The most common Production, Transportation and Moving occupations in Cashton are Material Moving (87 | 16.6%), Transportation (25 | 4.8%), and Production (18 | 3.4%).
Production, Transportation and Moving Occupations by Sex
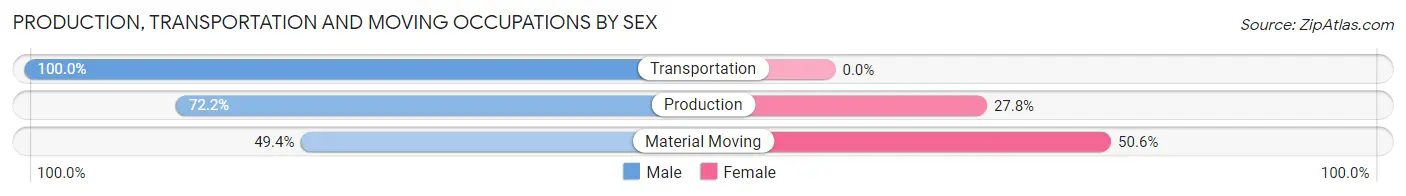
| Occupation | Male | Female |
| Production | 13 (72.2%) | 5 (27.8%) |
| Transportation | 25 (100.0%) | 0 (0.0%) |
| Material Moving | 43 (49.4%) | 44 (50.6%) |
| Total (Category) | 81 (62.3%) | 49 (37.7%) |
| Total (Overall) | 309 (58.9%) | 216 (41.1%) |
Employment Industries by Sex in Cashton
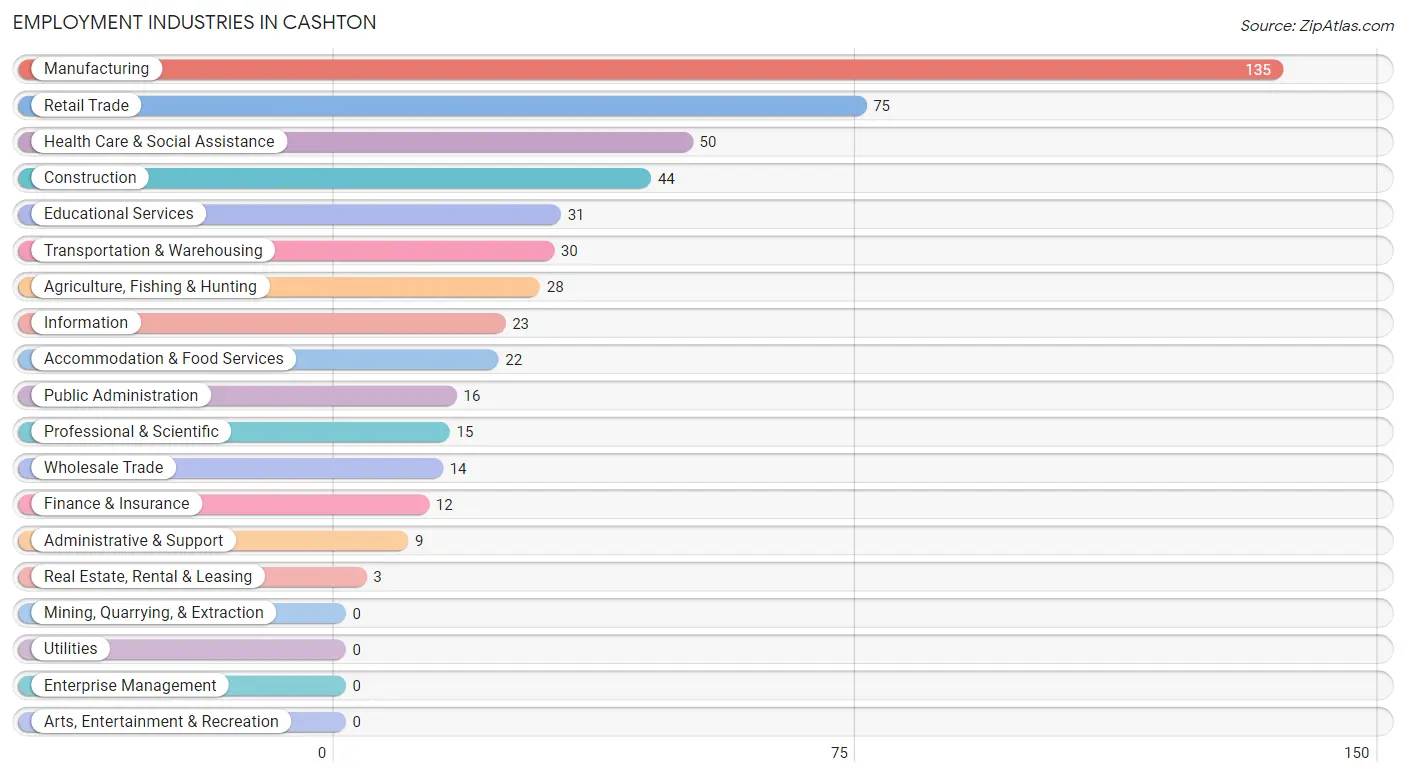
Employment Industries in Cashton
The major employment industries in Cashton include Manufacturing (135 | 25.7%), Retail Trade (75 | 14.3%), Health Care & Social Assistance (50 | 9.5%), Construction (44 | 8.4%), and Educational Services (31 | 5.9%).
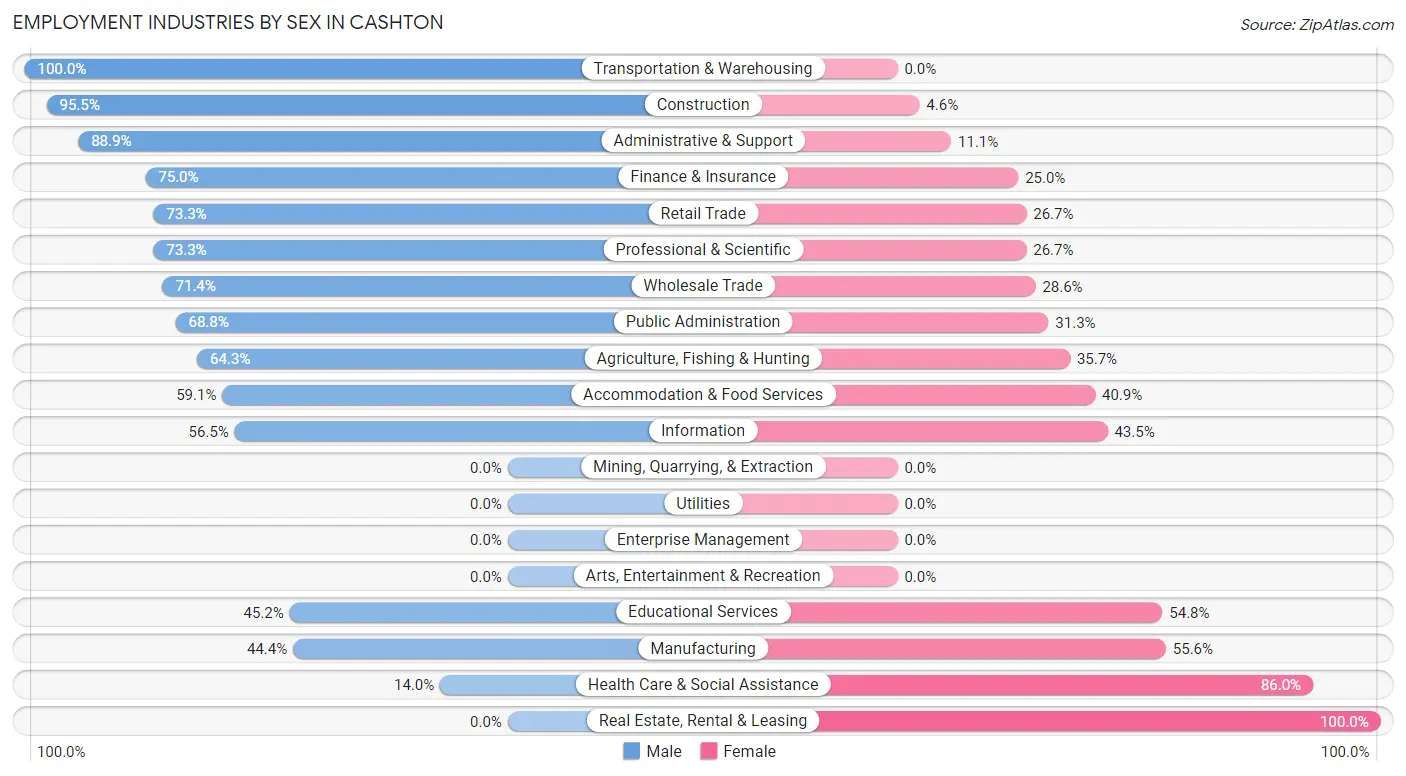
Employment Industries by Sex in Cashton
The Cashton industries that see more men than women are Transportation & Warehousing (100.0%), Construction (95.5%), and Administrative & Support (88.9%), whereas the industries that tend to have a higher number of women are Real Estate, Rental & Leasing (100.0%), Health Care & Social Assistance (86.0%), and Manufacturing (55.6%).
| Industry | Male | Female |
| Agriculture, Fishing & Hunting | 18 (64.3%) | 10 (35.7%) |
| Mining, Quarrying, & Extraction | 0 (0.0%) | 0 (0.0%) |
| Construction | 42 (95.5%) | 2 (4.5%) |
| Manufacturing | 60 (44.4%) | 75 (55.6%) |
| Wholesale Trade | 10 (71.4%) | 4 (28.6%) |
| Retail Trade | 55 (73.3%) | 20 (26.7%) |
| Transportation & Warehousing | 30 (100.0%) | 0 (0.0%) |
| Utilities | 0 (0.0%) | 0 (0.0%) |
| Information | 13 (56.5%) | 10 (43.5%) |
| Finance & Insurance | 9 (75.0%) | 3 (25.0%) |
| Real Estate, Rental & Leasing | 0 (0.0%) | 3 (100.0%) |
| Professional & Scientific | 11 (73.3%) | 4 (26.7%) |
| Enterprise Management | 0 (0.0%) | 0 (0.0%) |
| Administrative & Support | 8 (88.9%) | 1 (11.1%) |
| Educational Services | 14 (45.2%) | 17 (54.8%) |
| Health Care & Social Assistance | 7 (14.0%) | 43 (86.0%) |
| Arts, Entertainment & Recreation | 0 (0.0%) | 0 (0.0%) |
| Accommodation & Food Services | 13 (59.1%) | 9 (40.9%) |
| Public Administration | 11 (68.8%) | 5 (31.2%) |
| Total | 309 (58.9%) | 216 (41.1%) |
Education in Cashton
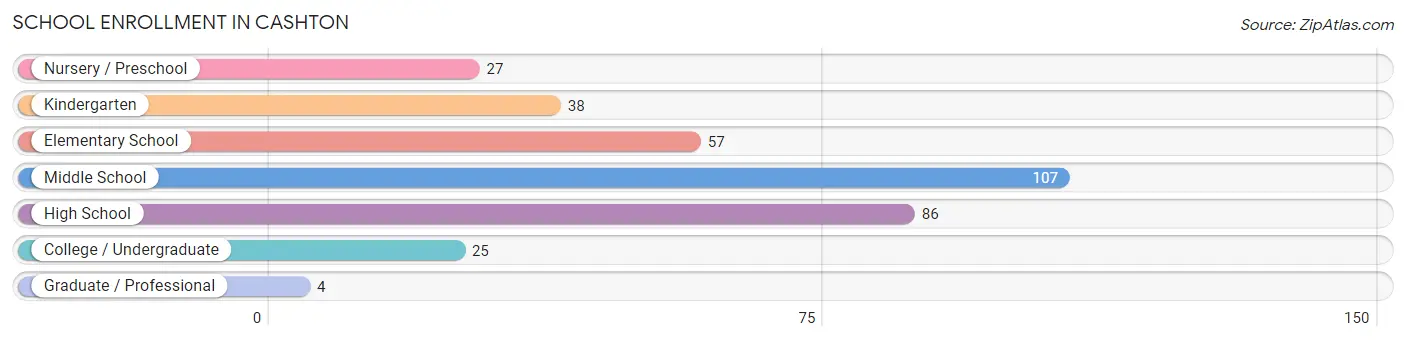
School Enrollment in Cashton
The most common levels of schooling among the 344 students in Cashton are middle school (107 | 31.1%), high school (86 | 25.0%), and elementary school (57 | 16.6%).
| School Level | # Students | % Students |
| Nursery / Preschool | 27 | 7.9% |
| Kindergarten | 38 | 11.1% |
| Elementary School | 57 | 16.6% |
| Middle School | 107 | 31.1% |
| High School | 86 | 25.0% |
| College / Undergraduate | 25 | 7.3% |
| Graduate / Professional | 4 | 1.2% |
| Total | 344 | 100.0% |
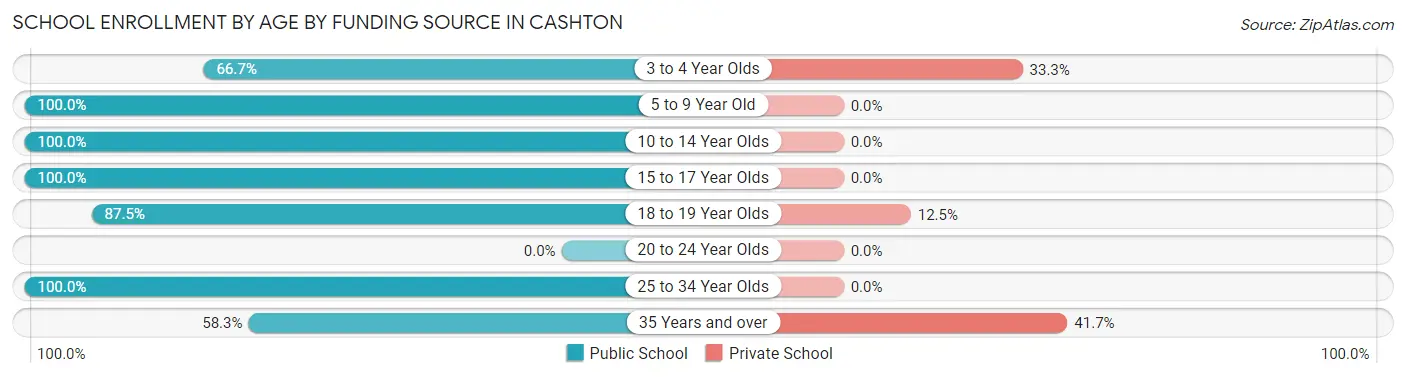
School Enrollment by Age by Funding Source in Cashton
Out of a total of 344 students who are enrolled in schools in Cashton, 15 (4.4%) attend a private institution, while the remaining 329 (95.6%) are enrolled in public schools. The age group of 35 years and over has the highest likelihood of being enrolled in private schools, with 5 (41.7% in the age bracket) enrolled. Conversely, the age group of 5 to 9 year old has the lowest likelihood of being enrolled in a private school, with 116 (100.0% in the age bracket) attending a public institution.
| Age Bracket | Public School | Private School |
| 3 to 4 Year Olds | 16 (66.7%) | 8 (33.3%) |
| 5 to 9 Year Old | 116 (100.0%) | 0 (0.0%) |
| 10 to 14 Year Olds | 104 (100.0%) | 0 (0.0%) |
| 15 to 17 Year Olds | 61 (100.0%) | 0 (0.0%) |
| 18 to 19 Year Olds | 14 (87.5%) | 2 (12.5%) |
| 20 to 24 Year Olds | 0 (0.0%) | 0 (0.0%) |
| 25 to 34 Year Olds | 11 (100.0%) | 0 (0.0%) |
| 35 Years and over | 7 (58.3%) | 5 (41.7%) |
| Total | 329 (95.6%) | 15 (4.4%) |
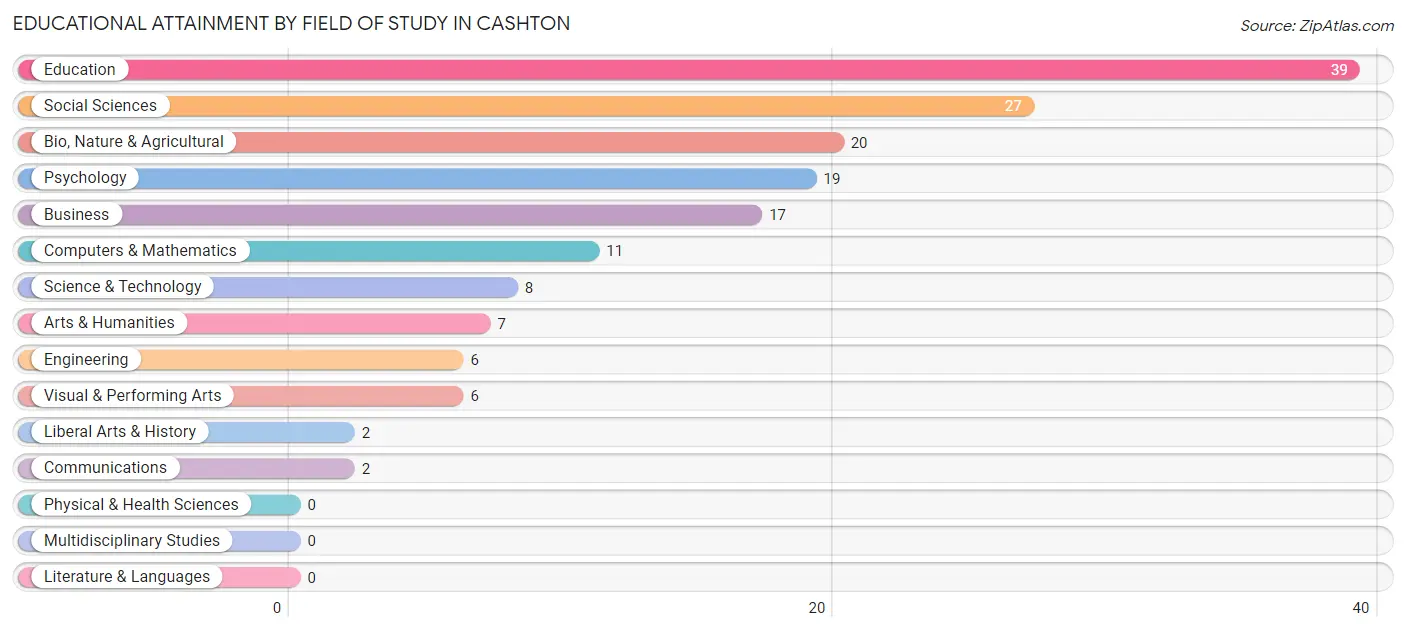
Educational Attainment by Field of Study in Cashton
Education (39 | 23.8%), social sciences (27 | 16.5%), bio, nature & agricultural (20 | 12.2%), psychology (19 | 11.6%), and business (17 | 10.4%) are the most common fields of study among 164 individuals in Cashton who have obtained a bachelor's degree or higher.
| Field of Study | # Graduates | % Graduates |
| Computers & Mathematics | 11 | 6.7% |
| Bio, Nature & Agricultural | 20 | 12.2% |
| Physical & Health Sciences | 0 | 0.0% |
| Psychology | 19 | 11.6% |
| Social Sciences | 27 | 16.5% |
| Engineering | 6 | 3.7% |
| Multidisciplinary Studies | 0 | 0.0% |
| Science & Technology | 8 | 4.9% |
| Business | 17 | 10.4% |
| Education | 39 | 23.8% |
| Literature & Languages | 0 | 0.0% |
| Liberal Arts & History | 2 | 1.2% |
| Visual & Performing Arts | 6 | 3.7% |
| Communications | 2 | 1.2% |
| Arts & Humanities | 7 | 4.3% |
| Total | 164 | 100.0% |
Transportation & Commute in Cashton
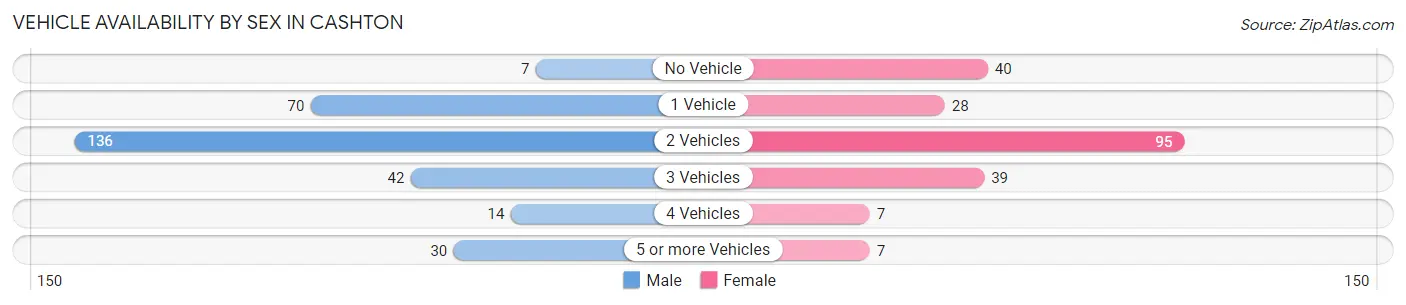
Vehicle Availability by Sex in Cashton
The most prevalent vehicle ownership categories in Cashton are males with 2 vehicles (136, accounting for 45.5%) and females with 2 vehicles (95, making up 63.0%).
| Vehicles Available | Male | Female |
| No Vehicle | 7 (2.3%) | 40 (18.5%) |
| 1 Vehicle | 70 (23.4%) | 28 (13.0%) |
| 2 Vehicles | 136 (45.5%) | 95 (44.0%) |
| 3 Vehicles | 42 (14.1%) | 39 (18.1%) |
| 4 Vehicles | 14 (4.7%) | 7 (3.2%) |
| 5 or more Vehicles | 30 (10.0%) | 7 (3.2%) |
| Total | 299 (100.0%) | 216 (100.0%) |
Commute Time in Cashton
The most frequently occuring commute durations in Cashton are 5 to 9 minutes (103 commuters, 20.8%), 45 to 59 minutes (69 commuters, 13.9%), and less than 5 minutes (68 commuters, 13.7%).
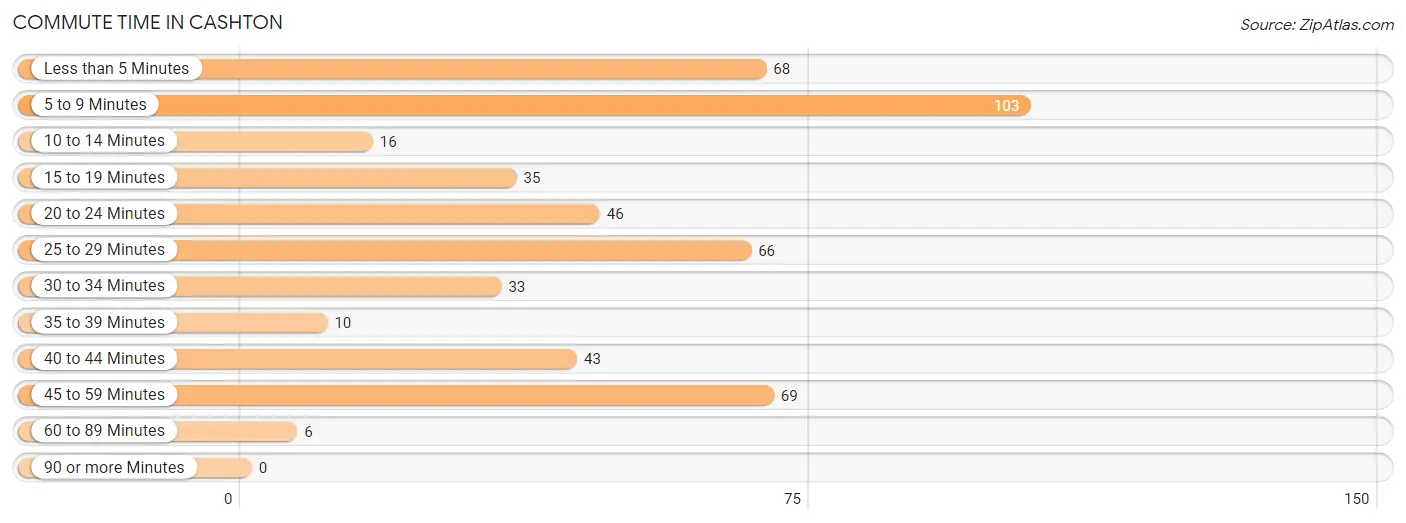
| Commute Time | # Commuters | % Commuters |
| Less than 5 Minutes | 68 | 13.7% |
| 5 to 9 Minutes | 103 | 20.8% |
| 10 to 14 Minutes | 16 | 3.2% |
| 15 to 19 Minutes | 35 | 7.1% |
| 20 to 24 Minutes | 46 | 9.3% |
| 25 to 29 Minutes | 66 | 13.3% |
| 30 to 34 Minutes | 33 | 6.7% |
| 35 to 39 Minutes | 10 | 2.0% |
| 40 to 44 Minutes | 43 | 8.7% |
| 45 to 59 Minutes | 69 | 13.9% |
| 60 to 89 Minutes | 6 | 1.2% |
| 90 or more Minutes | 0 | 0.0% |
Commute Time by Sex in Cashton
The most common commute times in Cashton are 5 to 9 minutes (70 commuters, 24.1%) for males and 45 to 59 minutes (54 commuters, 26.3%) for females.
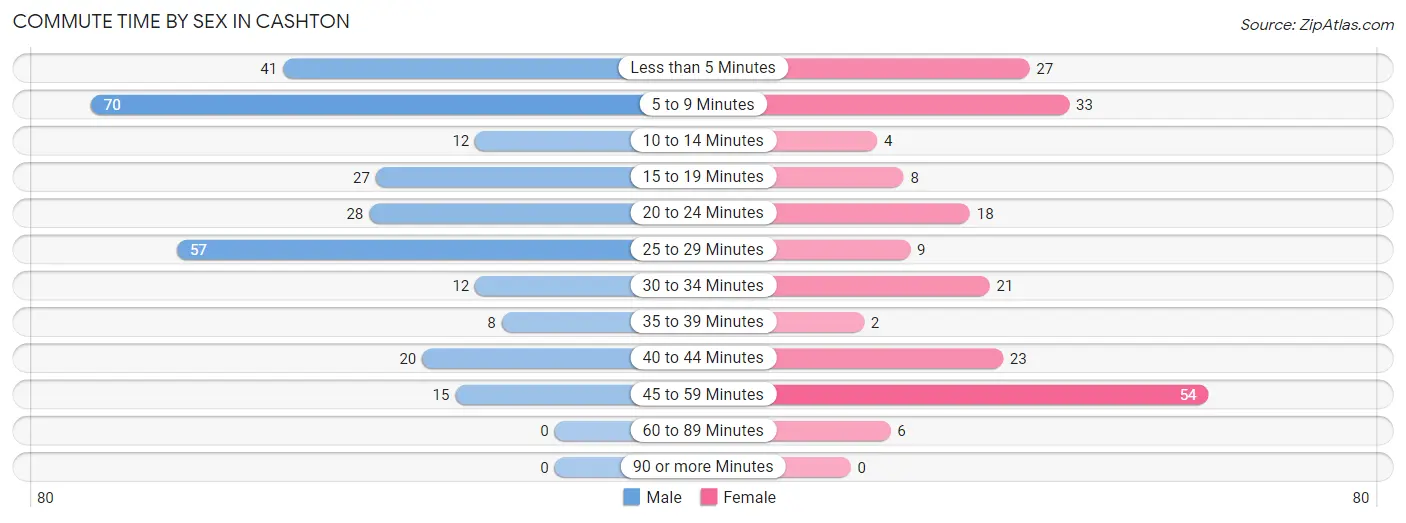
| Commute Time | Male | Female |
| Less than 5 Minutes | 41 (14.1%) | 27 (13.2%) |
| 5 to 9 Minutes | 70 (24.1%) | 33 (16.1%) |
| 10 to 14 Minutes | 12 (4.1%) | 4 (1.9%) |
| 15 to 19 Minutes | 27 (9.3%) | 8 (3.9%) |
| 20 to 24 Minutes | 28 (9.7%) | 18 (8.8%) |
| 25 to 29 Minutes | 57 (19.7%) | 9 (4.4%) |
| 30 to 34 Minutes | 12 (4.1%) | 21 (10.2%) |
| 35 to 39 Minutes | 8 (2.8%) | 2 (1.0%) |
| 40 to 44 Minutes | 20 (6.9%) | 23 (11.2%) |
| 45 to 59 Minutes | 15 (5.2%) | 54 (26.3%) |
| 60 to 89 Minutes | 0 (0.0%) | 6 (2.9%) |
| 90 or more Minutes | 0 (0.0%) | 0 (0.0%) |
Time of Departure to Work by Sex in Cashton
The most frequent times of departure to work in Cashton are 7:00 AM to 7:29 AM (71, 24.5%) for males and 7:30 AM to 7:59 AM (60, 29.3%) for females.
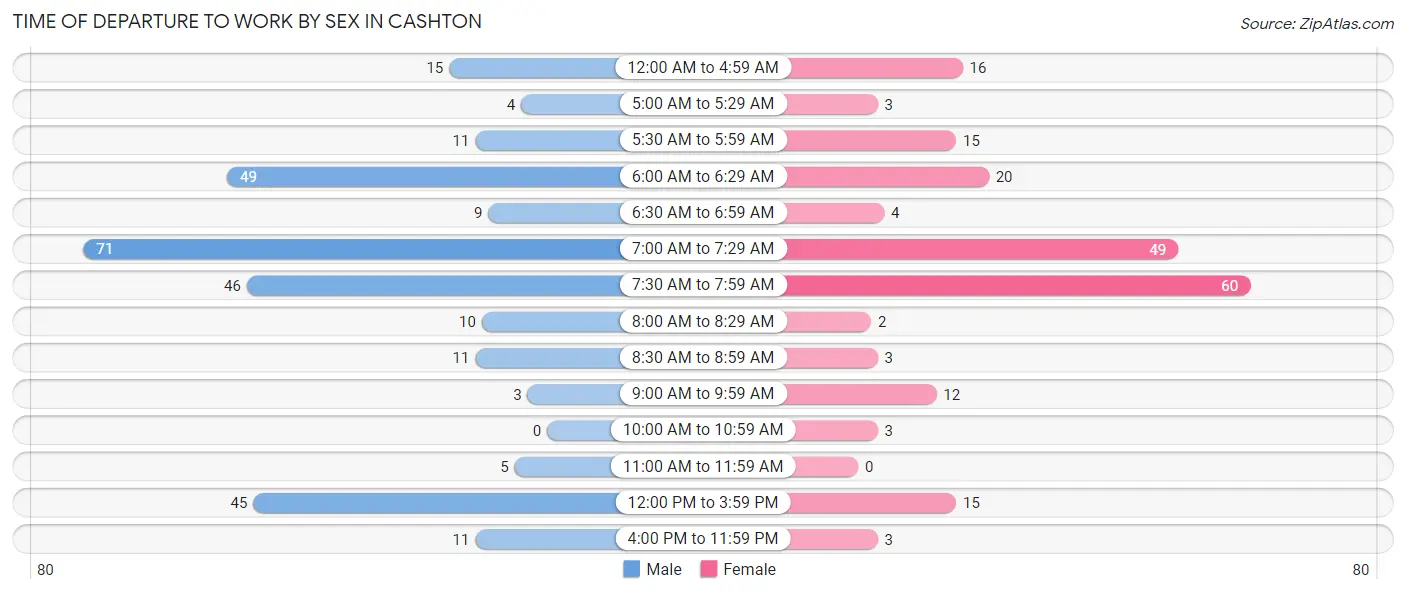
| Time of Departure | Male | Female |
| 12:00 AM to 4:59 AM | 15 (5.2%) | 16 (7.8%) |
| 5:00 AM to 5:29 AM | 4 (1.4%) | 3 (1.5%) |
| 5:30 AM to 5:59 AM | 11 (3.8%) | 15 (7.3%) |
| 6:00 AM to 6:29 AM | 49 (16.9%) | 20 (9.8%) |
| 6:30 AM to 6:59 AM | 9 (3.1%) | 4 (1.9%) |
| 7:00 AM to 7:29 AM | 71 (24.5%) | 49 (23.9%) |
| 7:30 AM to 7:59 AM | 46 (15.9%) | 60 (29.3%) |
| 8:00 AM to 8:29 AM | 10 (3.5%) | 2 (1.0%) |
| 8:30 AM to 8:59 AM | 11 (3.8%) | 3 (1.5%) |
| 9:00 AM to 9:59 AM | 3 (1.0%) | 12 (5.9%) |
| 10:00 AM to 10:59 AM | 0 (0.0%) | 3 (1.5%) |
| 11:00 AM to 11:59 AM | 5 (1.7%) | 0 (0.0%) |
| 12:00 PM to 3:59 PM | 45 (15.5%) | 15 (7.3%) |
| 4:00 PM to 11:59 PM | 11 (3.8%) | 3 (1.5%) |
| Total | 290 (100.0%) | 205 (100.0%) |
Housing Occupancy in Cashton
Occupancy by Ownership in Cashton
Of the total 549 dwellings in Cashton, owner-occupied units account for 468 (85.3%), while renter-occupied units make up 81 (14.7%).
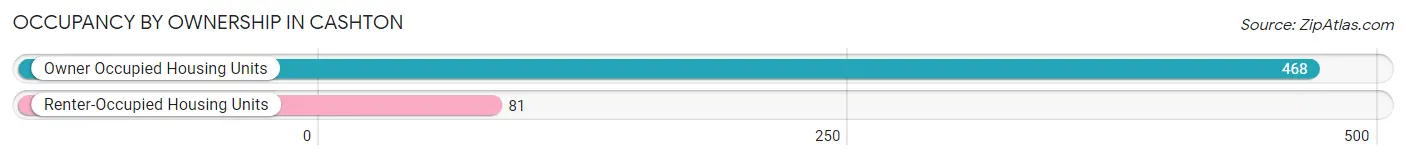
| Occupancy | # Housing Units | % Housing Units |
| Owner Occupied Housing Units | 468 | 85.3% |
| Renter-Occupied Housing Units | 81 | 14.7% |
| Total Occupied Housing Units | 549 | 100.0% |
Occupancy by Household Size in Cashton
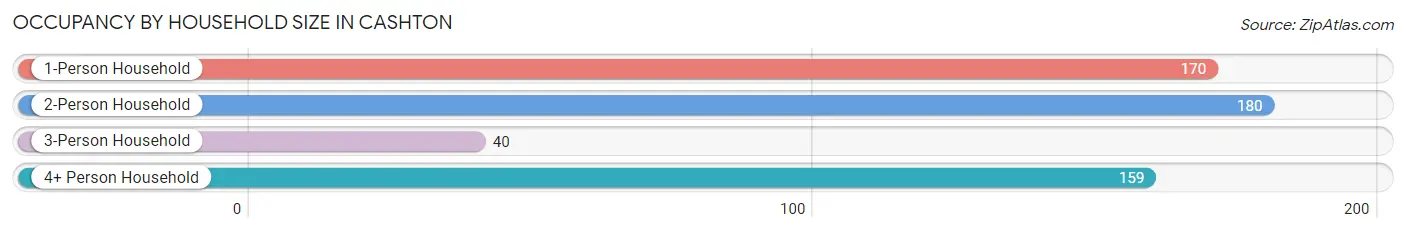
| Household Size | # Housing Units | % Housing Units |
| 1-Person Household | 170 | 31.0% |
| 2-Person Household | 180 | 32.8% |
| 3-Person Household | 40 | 7.3% |
| 4+ Person Household | 159 | 29.0% |
| Total Housing Units | 549 | 100.0% |
Occupancy by Ownership by Household Size in Cashton
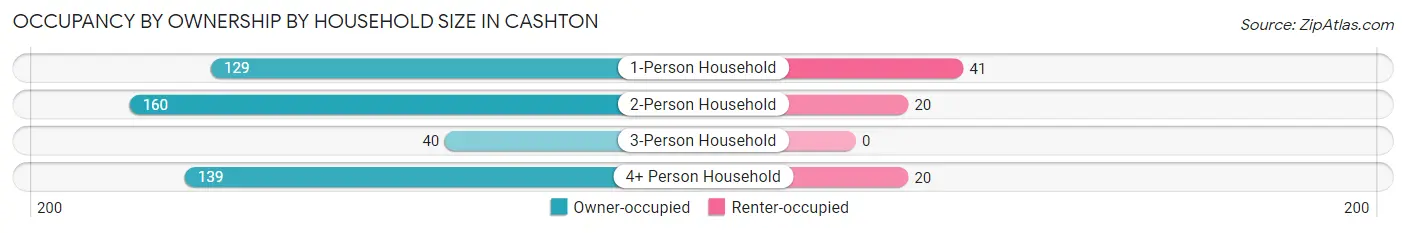
| Household Size | Owner-occupied | Renter-occupied |
| 1-Person Household | 129 (75.9%) | 41 (24.1%) |
| 2-Person Household | 160 (88.9%) | 20 (11.1%) |
| 3-Person Household | 40 (100.0%) | 0 (0.0%) |
| 4+ Person Household | 139 (87.4%) | 20 (12.6%) |
| Total Housing Units | 468 (85.3%) | 81 (14.7%) |
Occupancy by Educational Attainment in Cashton
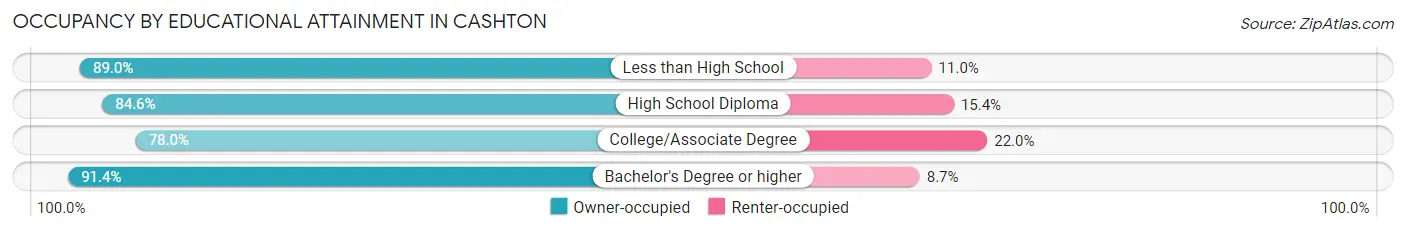
| Household Size | Owner-occupied | Renter-occupied |
| Less than High School | 89 (89.0%) | 11 (11.0%) |
| High School Diploma | 192 (84.6%) | 35 (15.4%) |
| College/Associate Degree | 92 (78.0%) | 26 (22.0%) |
| Bachelor's Degree or higher | 95 (91.3%) | 9 (8.6%) |
Occupancy by Age of Householder in Cashton
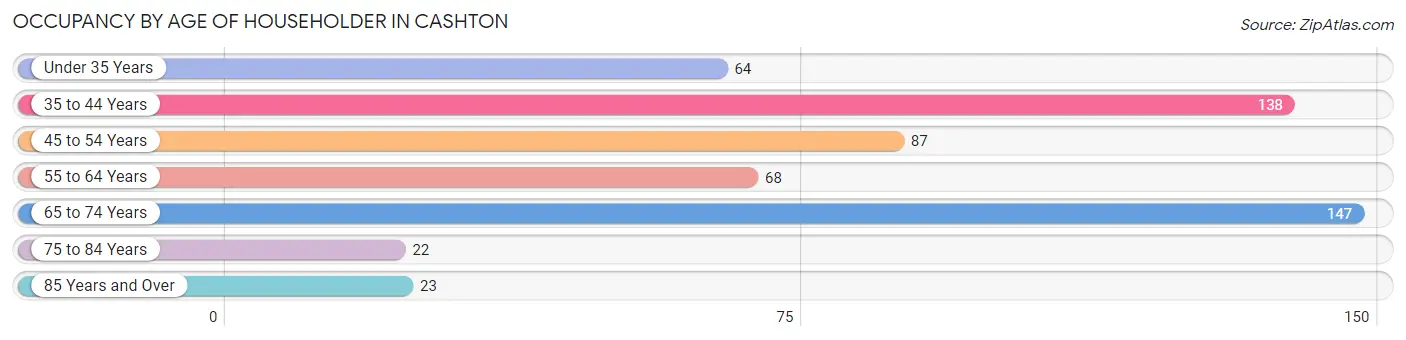
| Age Bracket | # Households | % Households |
| Under 35 Years | 64 | 11.7% |
| 35 to 44 Years | 138 | 25.1% |
| 45 to 54 Years | 87 | 15.9% |
| 55 to 64 Years | 68 | 12.4% |
| 65 to 74 Years | 147 | 26.8% |
| 75 to 84 Years | 22 | 4.0% |
| 85 Years and Over | 23 | 4.2% |
| Total | 549 | 100.0% |
Housing Finances in Cashton
Median Income by Occupancy in Cashton
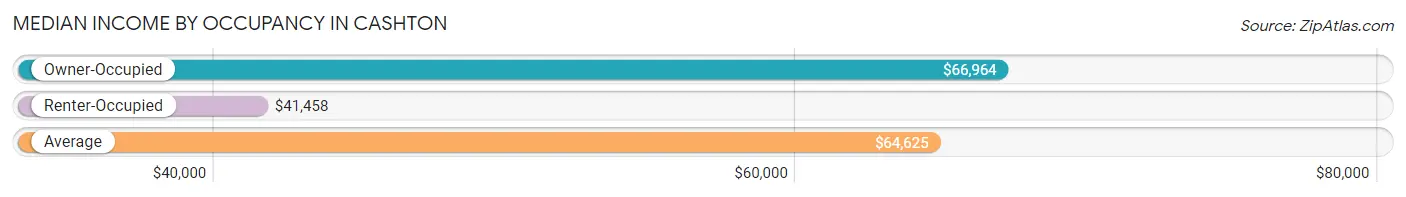
| Occupancy Type | # Households | Median Income |
| Owner-Occupied | 468 (85.3%) | $66,964 |
| Renter-Occupied | 81 (14.7%) | $41,458 |
| Average | 549 (100.0%) | $64,625 |
Occupancy by Householder Income Bracket in Cashton
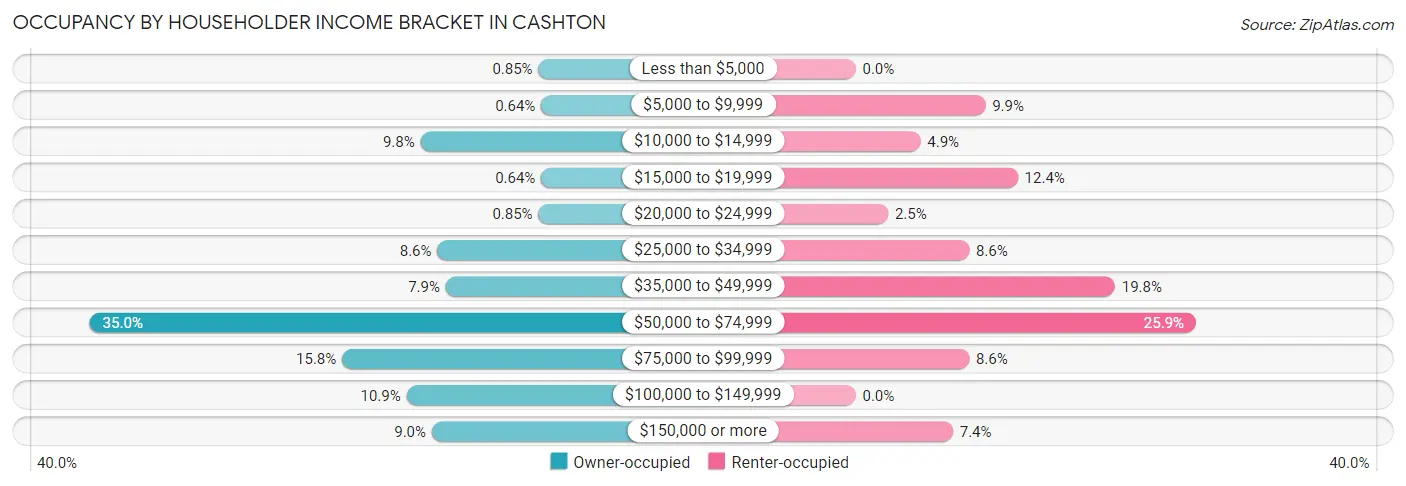
| Income Bracket | Owner-occupied | Renter-occupied |
| Less than $5,000 | 4 (0.9%) | 0 (0.0%) |
| $5,000 to $9,999 | 3 (0.6%) | 8 (9.9%) |
| $10,000 to $14,999 | 46 (9.8%) | 4 (4.9%) |
| $15,000 to $19,999 | 3 (0.6%) | 10 (12.3%) |
| $20,000 to $24,999 | 4 (0.9%) | 2 (2.5%) |
| $25,000 to $34,999 | 40 (8.6%) | 7 (8.6%) |
| $35,000 to $49,999 | 37 (7.9%) | 16 (19.8%) |
| $50,000 to $74,999 | 164 (35.0%) | 21 (25.9%) |
| $75,000 to $99,999 | 74 (15.8%) | 7 (8.6%) |
| $100,000 to $149,999 | 51 (10.9%) | 0 (0.0%) |
| $150,000 or more | 42 (9.0%) | 6 (7.4%) |
| Total | 468 (100.0%) | 81 (100.0%) |
Monthly Housing Cost Tiers in Cashton
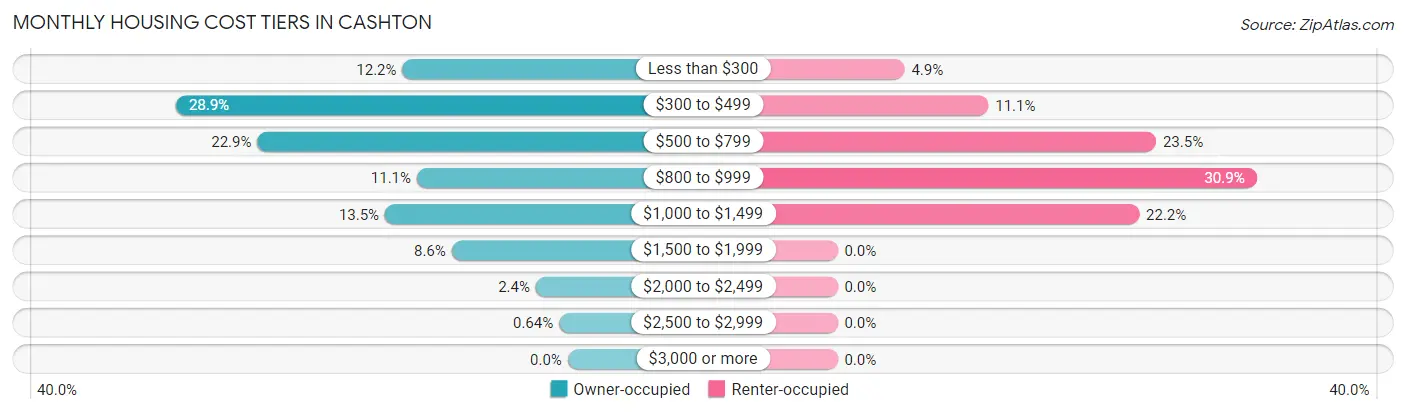
| Monthly Cost | Owner-occupied | Renter-occupied |
| Less than $300 | 57 (12.2%) | 4 (4.9%) |
| $300 to $499 | 135 (28.8%) | 9 (11.1%) |
| $500 to $799 | 107 (22.9%) | 19 (23.5%) |
| $800 to $999 | 52 (11.1%) | 25 (30.9%) |
| $1,000 to $1,499 | 63 (13.5%) | 18 (22.2%) |
| $1,500 to $1,999 | 40 (8.6%) | 0 (0.0%) |
| $2,000 to $2,499 | 11 (2.4%) | 0 (0.0%) |
| $2,500 to $2,999 | 3 (0.6%) | 0 (0.0%) |
| $3,000 or more | 0 (0.0%) | 0 (0.0%) |
| Total | 468 (100.0%) | 81 (100.0%) |
Physical Housing Characteristics in Cashton
Housing Structures in Cashton
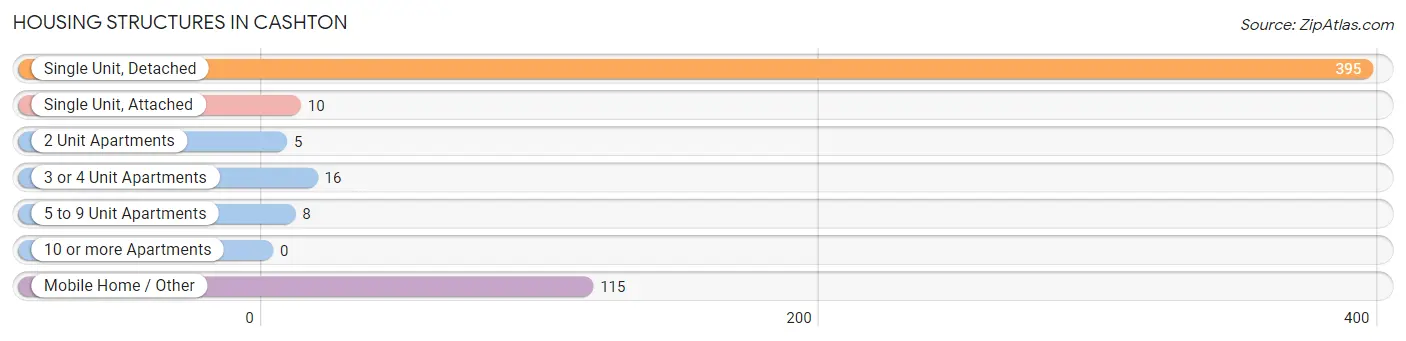
| Structure Type | # Housing Units | % Housing Units |
| Single Unit, Detached | 395 | 72.0% |
| Single Unit, Attached | 10 | 1.8% |
| 2 Unit Apartments | 5 | 0.9% |
| 3 or 4 Unit Apartments | 16 | 2.9% |
| 5 to 9 Unit Apartments | 8 | 1.5% |
| 10 or more Apartments | 0 | 0.0% |
| Mobile Home / Other | 115 | 20.9% |
| Total | 549 | 100.0% |
Housing Structures by Occupancy in Cashton
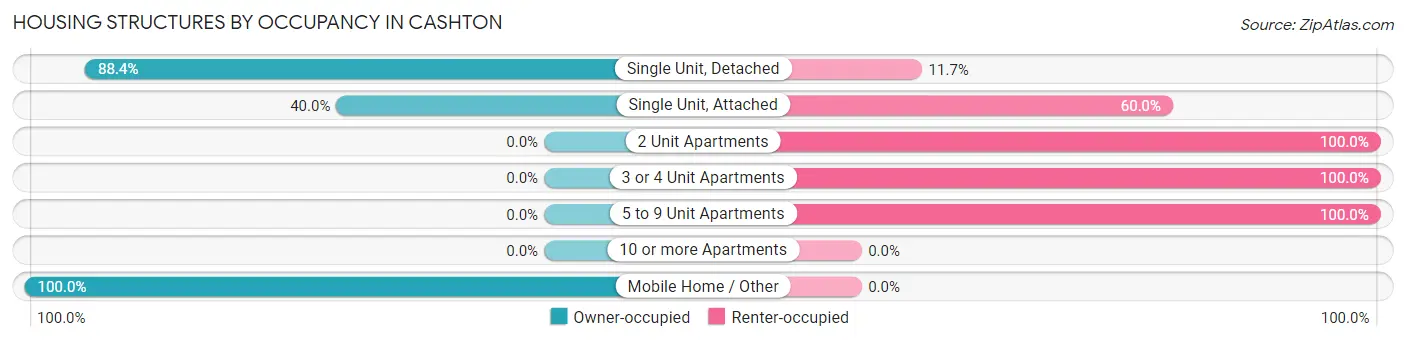
| Structure Type | Owner-occupied | Renter-occupied |
| Single Unit, Detached | 349 (88.3%) | 46 (11.7%) |
| Single Unit, Attached | 4 (40.0%) | 6 (60.0%) |
| 2 Unit Apartments | 0 (0.0%) | 5 (100.0%) |
| 3 or 4 Unit Apartments | 0 (0.0%) | 16 (100.0%) |
| 5 to 9 Unit Apartments | 0 (0.0%) | 8 (100.0%) |
| 10 or more Apartments | 0 (0.0%) | 0 (0.0%) |
| Mobile Home / Other | 115 (100.0%) | 0 (0.0%) |
| Total | 468 (85.3%) | 81 (14.7%) |
Housing Structures by Number of Rooms in Cashton
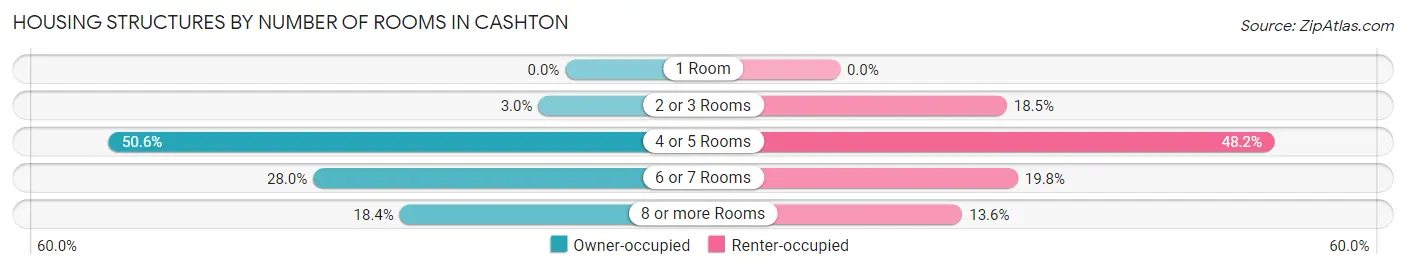
| Number of Rooms | Owner-occupied | Renter-occupied |
| 1 Room | 0 (0.0%) | 0 (0.0%) |
| 2 or 3 Rooms | 14 (3.0%) | 15 (18.5%) |
| 4 or 5 Rooms | 237 (50.6%) | 39 (48.1%) |
| 6 or 7 Rooms | 131 (28.0%) | 16 (19.8%) |
| 8 or more Rooms | 86 (18.4%) | 11 (13.6%) |
| Total | 468 (100.0%) | 81 (100.0%) |
Housing Structure by Heating Type in Cashton
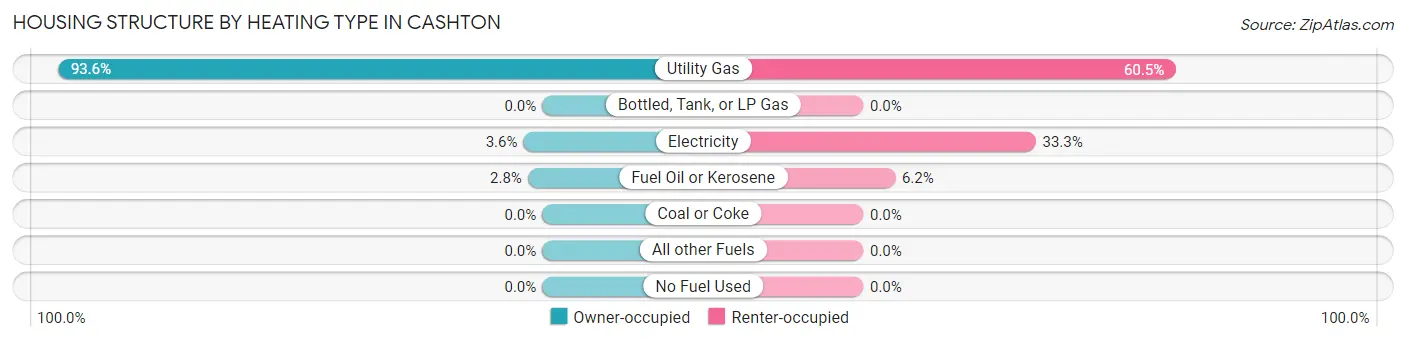
| Heating Type | Owner-occupied | Renter-occupied |
| Utility Gas | 438 (93.6%) | 49 (60.5%) |
| Bottled, Tank, or LP Gas | 0 (0.0%) | 0 (0.0%) |
| Electricity | 17 (3.6%) | 27 (33.3%) |
| Fuel Oil or Kerosene | 13 (2.8%) | 5 (6.2%) |
| Coal or Coke | 0 (0.0%) | 0 (0.0%) |
| All other Fuels | 0 (0.0%) | 0 (0.0%) |
| No Fuel Used | 0 (0.0%) | 0 (0.0%) |
| Total | 468 (100.0%) | 81 (100.0%) |
Household Vehicle Usage in Cashton
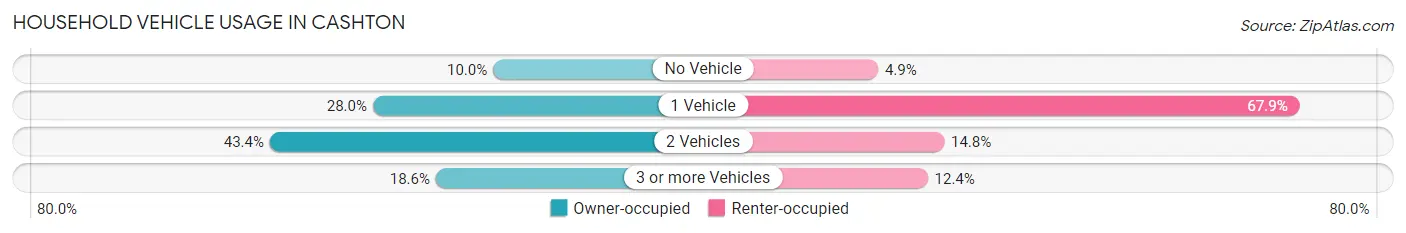
| Vehicles per Household | Owner-occupied | Renter-occupied |
| No Vehicle | 47 (10.0%) | 4 (4.9%) |
| 1 Vehicle | 131 (28.0%) | 55 (67.9%) |
| 2 Vehicles | 203 (43.4%) | 12 (14.8%) |
| 3 or more Vehicles | 87 (18.6%) | 10 (12.3%) |
| Total | 468 (100.0%) | 81 (100.0%) |
Real Estate & Mortgages in Cashton
Real Estate and Mortgage Overview in Cashton
| Characteristic | Without Mortgage | With Mortgage |
| Housing Units | 305 | 163 |
| Median Property Value | $96,300 | $156,500 |
| Median Household Income | $56,131 | $36 |
| Monthly Housing Costs | $394 | $0 |
| Real Estate Taxes | $1,951 | $10 |
Property Value by Mortgage Status in Cashton
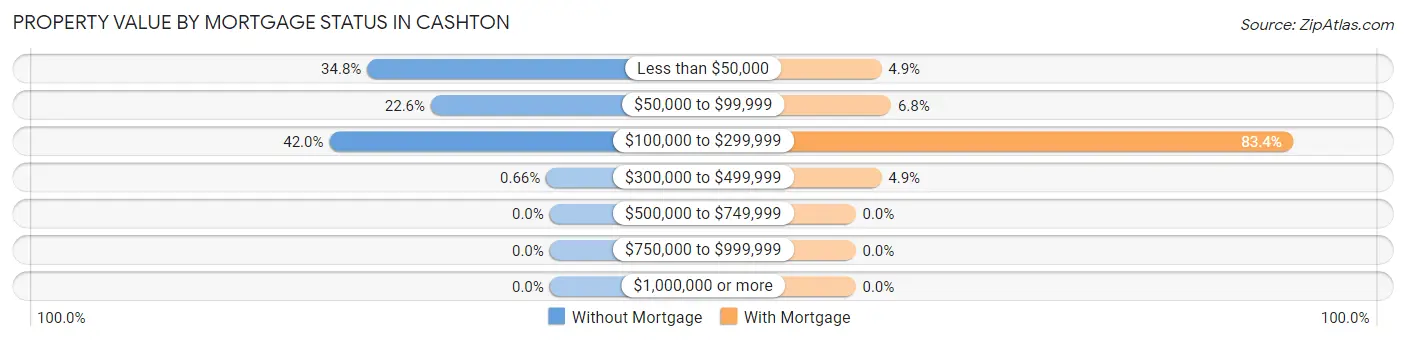
| Property Value | Without Mortgage | With Mortgage |
| Less than $50,000 | 106 (34.7%) | 8 (4.9%) |
| $50,000 to $99,999 | 69 (22.6%) | 11 (6.8%) |
| $100,000 to $299,999 | 128 (42.0%) | 136 (83.4%) |
| $300,000 to $499,999 | 2 (0.7%) | 8 (4.9%) |
| $500,000 to $749,999 | 0 (0.0%) | 0 (0.0%) |
| $750,000 to $999,999 | 0 (0.0%) | 0 (0.0%) |
| $1,000,000 or more | 0 (0.0%) | 0 (0.0%) |
| Total | 305 (100.0%) | 163 (100.0%) |
Household Income by Mortgage Status in Cashton
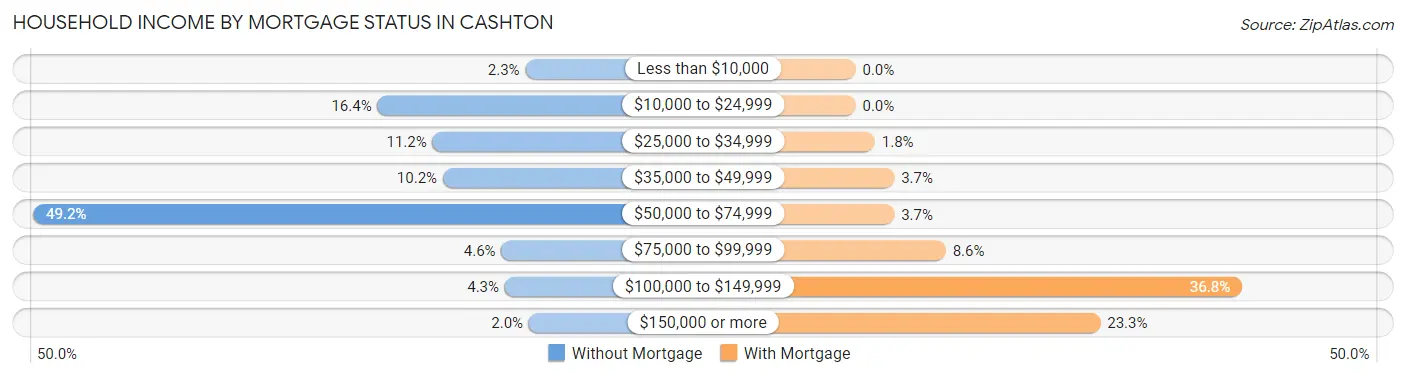
| Household Income | Without Mortgage | With Mortgage |
| Less than $10,000 | 7 (2.3%) | 0 (0.0%) |
| $10,000 to $24,999 | 50 (16.4%) | 0 (0.0%) |
| $25,000 to $34,999 | 34 (11.2%) | 3 (1.8%) |
| $35,000 to $49,999 | 31 (10.2%) | 6 (3.7%) |
| $50,000 to $74,999 | 150 (49.2%) | 6 (3.7%) |
| $75,000 to $99,999 | 14 (4.6%) | 14 (8.6%) |
| $100,000 to $149,999 | 13 (4.3%) | 60 (36.8%) |
| $150,000 or more | 6 (2.0%) | 38 (23.3%) |
| Total | 305 (100.0%) | 163 (100.0%) |
Property Value to Household Income Ratio in Cashton
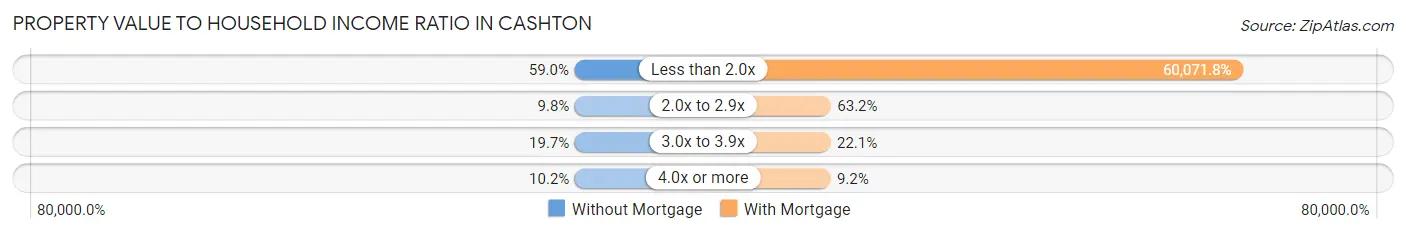
| Value-to-Income Ratio | Without Mortgage | With Mortgage |
| Less than 2.0x | 180 (59.0%) | 97,917 (60,071.8%) |
| 2.0x to 2.9x | 30 (9.8%) | 103 (63.2%) |
| 3.0x to 3.9x | 60 (19.7%) | 36 (22.1%) |
| 4.0x or more | 31 (10.2%) | 15 (9.2%) |
| Total | 305 (100.0%) | 163 (100.0%) |
Real Estate Taxes by Mortgage Status in Cashton
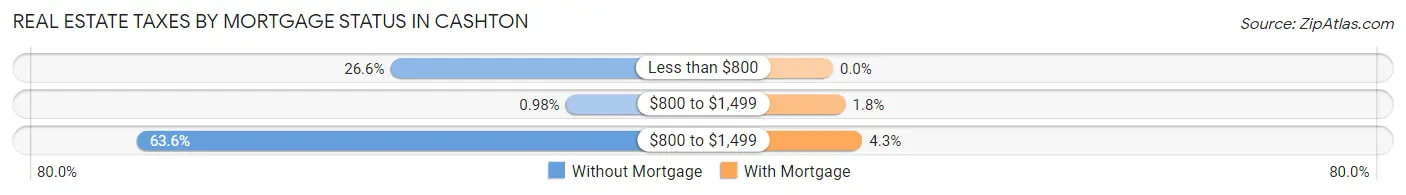
| Property Taxes | Without Mortgage | With Mortgage |
| Less than $800 | 81 (26.6%) | 0 (0.0%) |
| $800 to $1,499 | 3 (1.0%) | 3 (1.8%) |
| $800 to $1,499 | 194 (63.6%) | 7 (4.3%) |
| Total | 305 (100.0%) | 163 (100.0%) |
Health & Disability in Cashton
Health Insurance Coverage by Age in Cashton
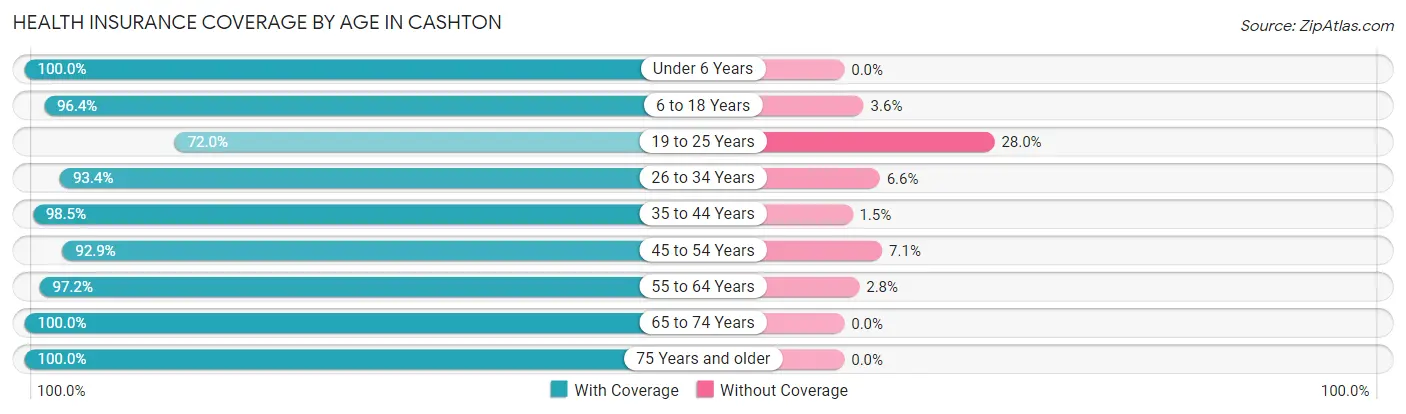
| Age Bracket | With Coverage | Without Coverage |
| Under 6 Years | 123 (100.0%) | 0 (0.0%) |
| 6 to 18 Years | 294 (96.4%) | 11 (3.6%) |
| 19 to 25 Years | 36 (72.0%) | 14 (28.0%) |
| 26 to 34 Years | 99 (93.4%) | 7 (6.6%) |
| 35 to 44 Years | 194 (98.5%) | 3 (1.5%) |
| 45 to 54 Years | 158 (92.9%) | 12 (7.1%) |
| 55 to 64 Years | 104 (97.2%) | 3 (2.8%) |
| 65 to 74 Years | 170 (100.0%) | 0 (0.0%) |
| 75 Years and older | 75 (100.0%) | 0 (0.0%) |
| Total | 1,253 (96.2%) | 50 (3.8%) |
Health Insurance Coverage by Citizenship Status in Cashton
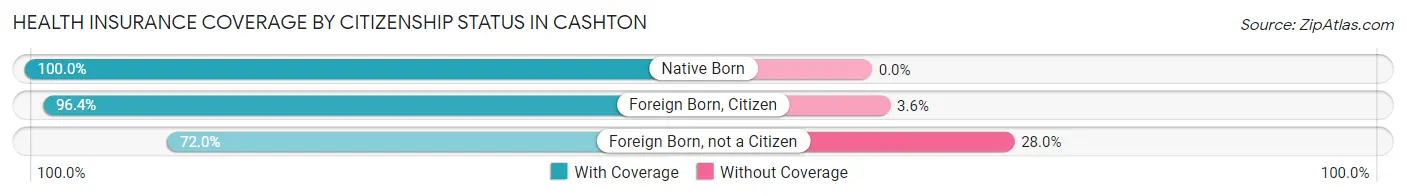
| Citizenship Status | With Coverage | Without Coverage |
| Native Born | 123 (100.0%) | 0 (0.0%) |
| Foreign Born, Citizen | 294 (96.4%) | 11 (3.6%) |
| Foreign Born, not a Citizen | 36 (72.0%) | 14 (28.0%) |
Health Insurance Coverage by Household Income in Cashton
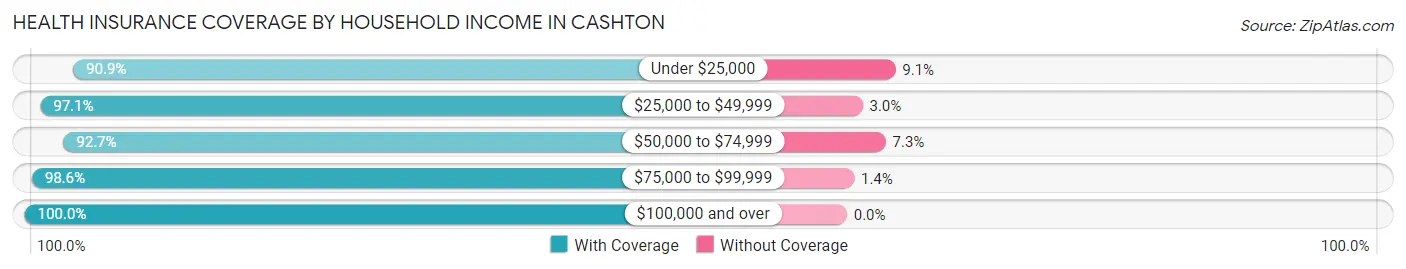
| Household Income | With Coverage | Without Coverage |
| Under $25,000 | 120 (90.9%) | 12 (9.1%) |
| $25,000 to $49,999 | 230 (97.1%) | 7 (2.9%) |
| $50,000 to $74,999 | 357 (92.7%) | 28 (7.3%) |
| $75,000 to $99,999 | 218 (98.6%) | 3 (1.4%) |
| $100,000 and over | 328 (100.0%) | 0 (0.0%) |
Public vs Private Health Insurance Coverage by Age in Cashton
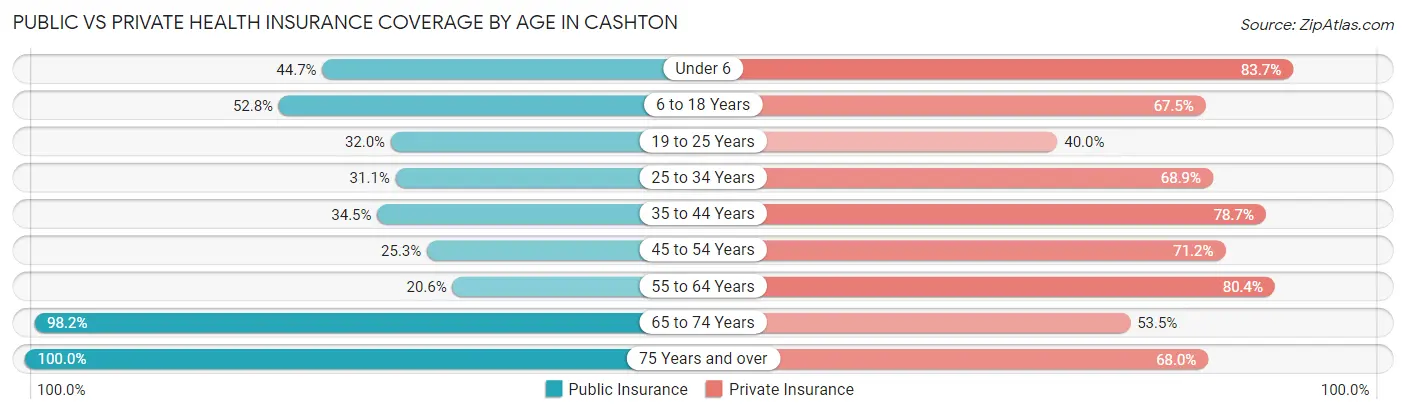
| Age Bracket | Public Insurance | Private Insurance |
| Under 6 | 55 (44.7%) | 103 (83.7%) |
| 6 to 18 Years | 161 (52.8%) | 206 (67.5%) |
| 19 to 25 Years | 16 (32.0%) | 20 (40.0%) |
| 25 to 34 Years | 33 (31.1%) | 73 (68.9%) |
| 35 to 44 Years | 68 (34.5%) | 155 (78.7%) |
| 45 to 54 Years | 43 (25.3%) | 121 (71.2%) |
| 55 to 64 Years | 22 (20.6%) | 86 (80.4%) |
| 65 to 74 Years | 167 (98.2%) | 91 (53.5%) |
| 75 Years and over | 75 (100.0%) | 51 (68.0%) |
| Total | 640 (49.1%) | 906 (69.5%) |
Disability Status by Sex by Age in Cashton
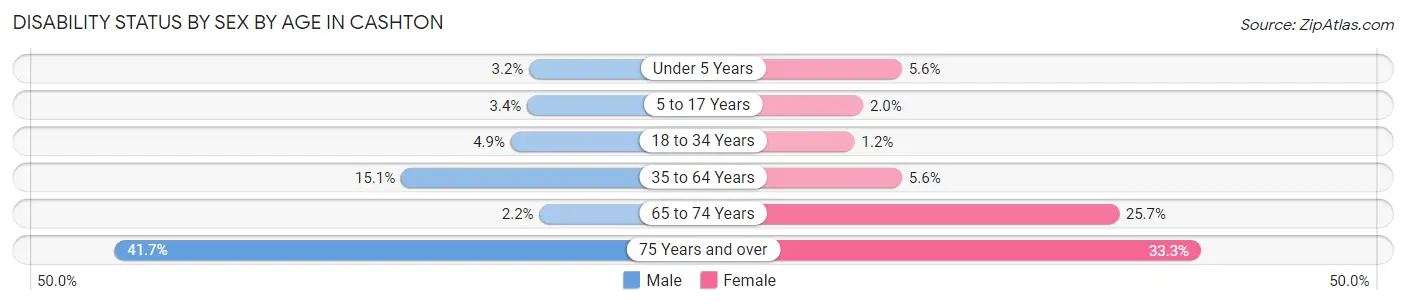
| Age Bracket | Male | Female |
| Under 5 Years | 2 (3.2%) | 3 (5.6%) |
| 5 to 17 Years | 5 (3.4%) | 3 (2.0%) |
| 18 to 34 Years | 4 (4.9%) | 1 (1.2%) |
| 35 to 64 Years | 39 (15.1%) | 12 (5.6%) |
| 65 to 74 Years | 3 (2.2%) | 9 (25.7%) |
| 75 Years and over | 15 (41.7%) | 13 (33.3%) |
Disability Class by Sex by Age in Cashton
Disability Class: Hearing Difficulty
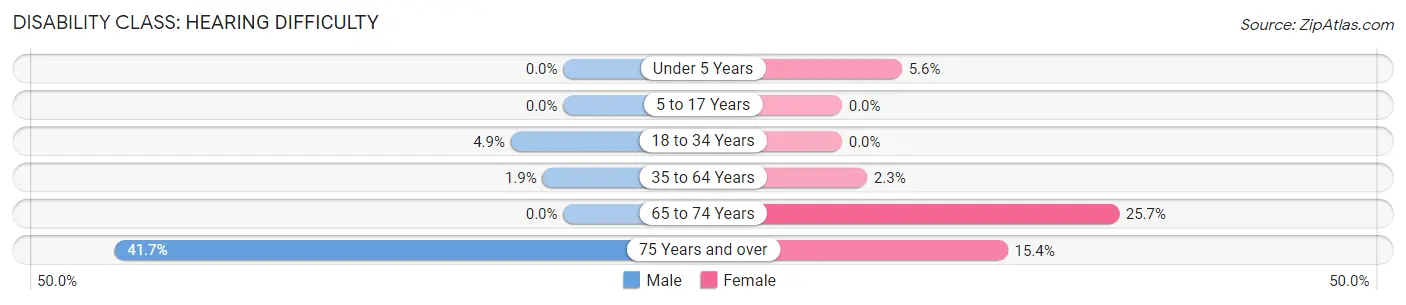
| Age Bracket | Male | Female |
| Under 5 Years | 0 (0.0%) | 3 (5.6%) |
| 5 to 17 Years | 0 (0.0%) | 0 (0.0%) |
| 18 to 34 Years | 4 (4.9%) | 0 (0.0%) |
| 35 to 64 Years | 5 (1.9%) | 5 (2.3%) |
| 65 to 74 Years | 0 (0.0%) | 9 (25.7%) |
| 75 Years and over | 15 (41.7%) | 6 (15.4%) |
Disability Class: Vision Difficulty
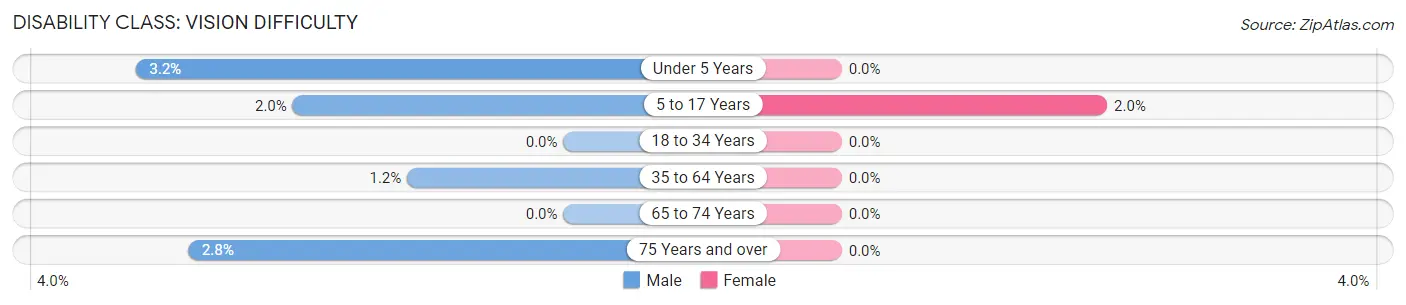
| Age Bracket | Male | Female |
| Under 5 Years | 2 (3.2%) | 0 (0.0%) |
| 5 to 17 Years | 3 (2.0%) | 3 (2.0%) |
| 18 to 34 Years | 0 (0.0%) | 0 (0.0%) |
| 35 to 64 Years | 3 (1.2%) | 0 (0.0%) |
| 65 to 74 Years | 0 (0.0%) | 0 (0.0%) |
| 75 Years and over | 1 (2.8%) | 0 (0.0%) |
Disability Class: Cognitive Difficulty
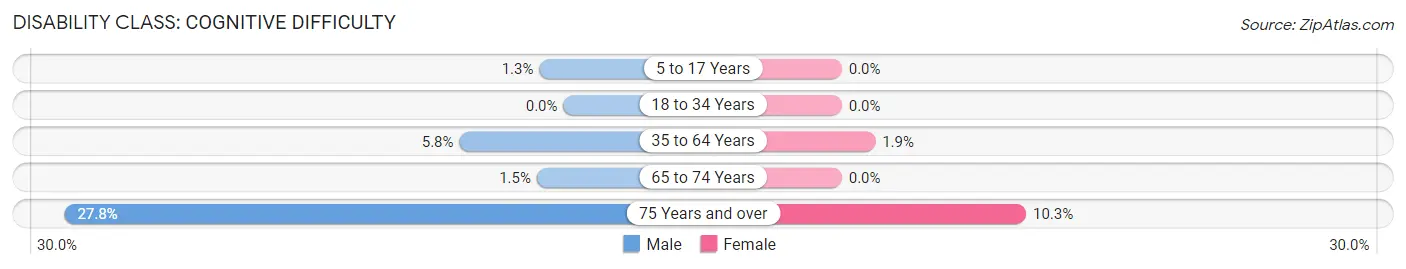
| Age Bracket | Male | Female |
| 5 to 17 Years | 2 (1.3%) | 0 (0.0%) |
| 18 to 34 Years | 0 (0.0%) | 0 (0.0%) |
| 35 to 64 Years | 15 (5.8%) | 4 (1.9%) |
| 65 to 74 Years | 2 (1.5%) | 0 (0.0%) |
| 75 Years and over | 10 (27.8%) | 4 (10.3%) |
Disability Class: Ambulatory Difficulty
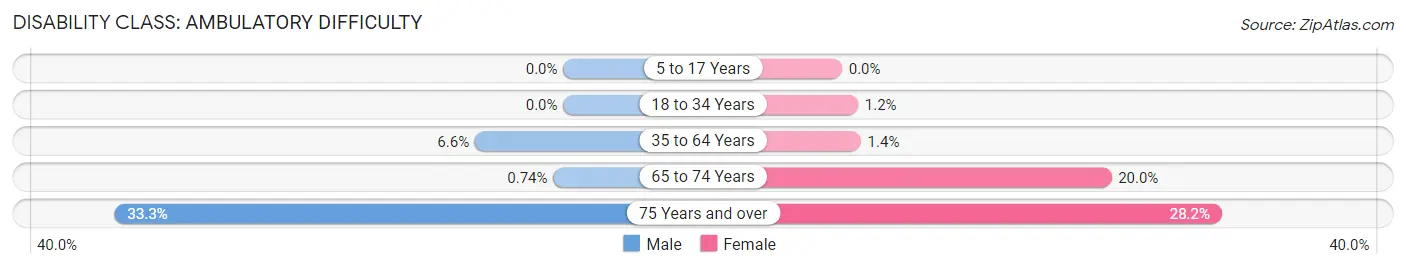
| Age Bracket | Male | Female |
| 5 to 17 Years | 0 (0.0%) | 0 (0.0%) |
| 18 to 34 Years | 0 (0.0%) | 1 (1.2%) |
| 35 to 64 Years | 17 (6.6%) | 3 (1.4%) |
| 65 to 74 Years | 1 (0.7%) | 7 (20.0%) |
| 75 Years and over | 12 (33.3%) | 11 (28.2%) |
Disability Class: Self-Care Difficulty
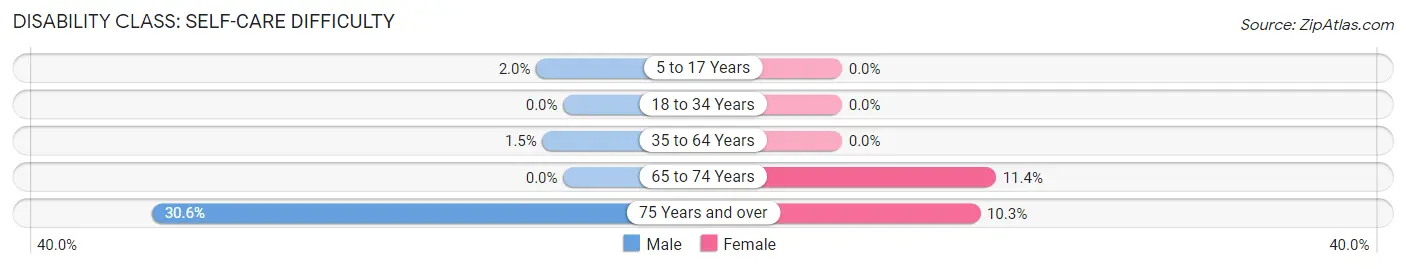
| Age Bracket | Male | Female |
| 5 to 17 Years | 3 (2.0%) | 0 (0.0%) |
| 18 to 34 Years | 0 (0.0%) | 0 (0.0%) |
| 35 to 64 Years | 4 (1.5%) | 0 (0.0%) |
| 65 to 74 Years | 0 (0.0%) | 4 (11.4%) |
| 75 Years and over | 11 (30.6%) | 4 (10.3%) |
Technology Access in Cashton
Computing Device Access in Cashton
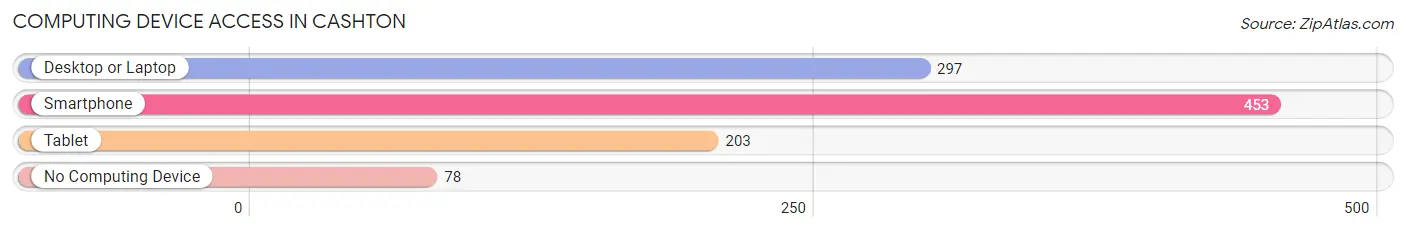
| Device Type | # Households | % Households |
| Desktop or Laptop | 297 | 54.1% |
| Smartphone | 453 | 82.5% |
| Tablet | 203 | 37.0% |
| No Computing Device | 78 | 14.2% |
| Total | 549 | 100.0% |
Internet Access in Cashton
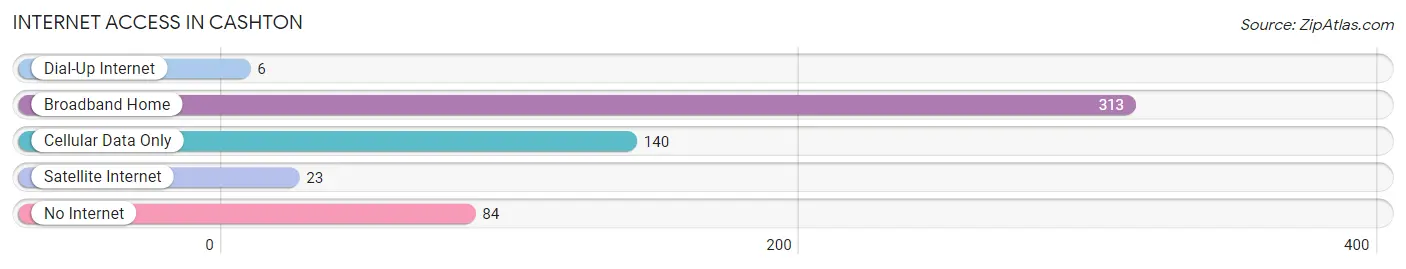
| Internet Type | # Households | % Households |
| Dial-Up Internet | 6 | 1.1% |
| Broadband Home | 313 | 57.0% |
| Cellular Data Only | 140 | 25.5% |
| Satellite Internet | 23 | 4.2% |
| No Internet | 84 | 15.3% |
| Total | 549 | 100.0% |
Cashton Summary
History
Cashton, Wisconsin is a small village located in Monroe County, Wisconsin. It was founded in 1856 by a group of settlers from Cashton, Tennessee. The village was named after the original Cashton, Tennessee, which was named after a local Native American chief. The village was incorporated in 1876 and has a population of approximately 1,000 people.
The village of Cashton has a rich history that dates back to the early 1800s. The first settlers to the area were a group of German immigrants who arrived in 1856. They were attracted to the area due to its fertile soil and abundant natural resources. The settlers quickly established a thriving agricultural community and built a number of businesses, including a sawmill, a gristmill, and a general store.
The village of Cashton was officially incorporated in 1876 and quickly grew in size and population. By the early 1900s, the village had become a bustling center of commerce and industry. The village was home to a number of businesses, including a bank, a hotel, a blacksmith shop, a livery stable, and a number of other businesses.
The village of Cashton experienced a period of growth and prosperity during the early 20th century. The village was home to a number of successful businesses, including a creamery, a cheese factory, a canning factory, and a number of other businesses. The village also had a number of churches, schools, and other civic organizations.
Geography
Cashton is located in Monroe County, Wisconsin, in the southwestern part of the state. The village is situated on the banks of the La Crosse River, which flows through the village. The village is surrounded by rolling hills and farmland, and is located approximately 25 miles from the city of La Crosse.
The village of Cashton has a total area of 1.2 square miles, all of which is land. The village is located at an elevation of 845 feet above sea level. The climate in Cashton is characterized by warm summers and cold winters. The average temperature in the summer is around 75 degrees Fahrenheit, while the average temperature in the winter is around 20 degrees Fahrenheit.
Economy
The economy of Cashton is largely based on agriculture and tourism. The village is home to a number of farms, which produce a variety of crops, including corn, soybeans, and hay. The village also has a number of businesses, including a bank, a hotel, a general store, and a number of other businesses.
The village of Cashton is also home to a number of tourist attractions, including the Cashton Historical Museum, the Cashton Public Library, and the Cashton Community Center. The village also hosts a number of festivals and events throughout the year, including the Cashton Summer Festival and the Cashton Fall Festival.
Demographics
As of the 2010 census, the village of Cashton had a population of 1,000 people. The racial makeup of the village was 97.2% White, 0.7% African American, 0.2% Native American, 0.2% Asian, 0.1% Pacific Islander, 0.7% from other races, and 0.9% from two or more races. Hispanic or Latino of any race were 1.2% of the population.
The median income for a household in the village was $41,250, and the median income for a family was $50,000. The per capita income for the village was $20,945. About 8.2% of families and 10.2% of the population were below the poverty line, including 14.3% of those under age 18 and 6.7% of those age 65 or over.
Common Questions
What is Per Capita Income in Cashton?
Per Capita income in Cashton is $30,557.
What is the Median Family Income in Cashton?
Median Family Income in Cashton is $68,477.
What is the Median Household income in Cashton?
Median Household Income in Cashton is $64,625.
What is Income or Wage Gap in Cashton?
Income or Wage Gap in Cashton is 37.2%.
Women in Cashton earn 62.8 cents for every dollar earned by a man.
What is Inequality or Gini Index in Cashton?
Inequality or Gini Index in Cashton is 0.37.
What is the Total Population of Cashton?
Total Population of Cashton is 1,303.
What is the Total Male Population of Cashton?
Total Male Population of Cashton is 724.
What is the Total Female Population of Cashton?
Total Female Population of Cashton is 579.
What is the Ratio of Males per 100 Females in Cashton?
There are 125.04 Males per 100 Females in Cashton.
What is the Ratio of Females per 100 Males in Cashton?
There are 79.97 Females per 100 Males in Cashton.
What is the Median Population Age in Cashton?
Median Population Age in Cashton is 37.6 Years.
What is the Average Family Size in Cashton
Average Family Size in Cashton is 2.9 People.
What is the Average Household Size in Cashton
Average Household Size in Cashton is 2.4 People.
How Large is the Labor Force in Cashton?
There are 540 People in the Labor Forcein in Cashton.
What is the Percentage of People in the Labor Force in Cashton?
58.3% of People are in the Labor Force in Cashton.
What is the Unemployment Rate in Cashton?
Unemployment Rate in Cashton is 2.8%.