Abbotsford, WI Map & Demographics
Abbotsford Map
Abbotsford Overview
$26,963
PER CAPITA INCOME
$75,750
AVG FAMILY INCOME
$58,125
AVG HOUSEHOLD INCOME
35.8%
WAGE / INCOME GAP [ % ]
64.2¢/ $1
WAGE / INCOME GAP [ $ ]
0.38
INEQUALITY / GINI INDEX
2,186
TOTAL POPULATION
1,150
MALE POPULATION
1,036
FEMALE POPULATION
111.00
MALES / 100 FEMALES
90.09
FEMALES / 100 MALES
36.6
MEDIAN AGE
3.2
AVG FAMILY SIZE
2.7
AVG HOUSEHOLD SIZE
1,129
LABOR FORCE [ PEOPLE ]
68.9%
PERCENT IN LABOR FORCE
6.2%
UNEMPLOYMENT RATE
Abbotsford Zip Codes
Income in Abbotsford
Income Overview in Abbotsford
Per Capita Income in Abbotsford is $26,963, while median incomes of families and households are $75,750 and $58,125 respectively.
| Characteristic | Number | Measure |
| Per Capita Income | 2,186 | $26,963 |
| Median Family Income | 535 | $75,750 |
| Mean Family Income | 535 | $85,015 |
| Median Household Income | 778 | $58,125 |
| Mean Household Income | 778 | $74,998 |
| Income Deficit | 535 | $0 |
| Wage / Income Gap (%) | 2,186 | 35.81% |
| Wage / Income Gap ($) | 2,186 | 64.19¢ per $1 |
| Gini / Inequality Index | 2,186 | 0.38 |
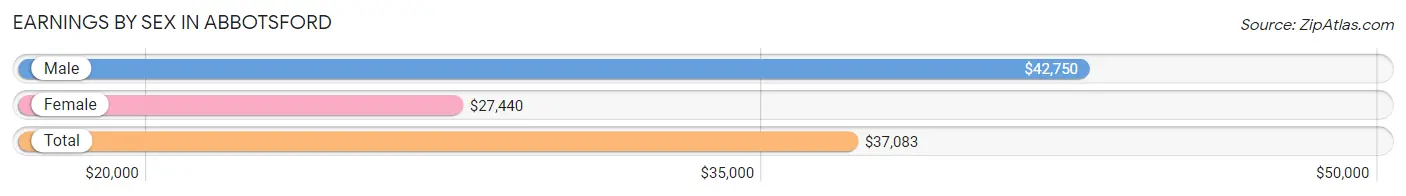
Earnings by Sex in Abbotsford
Average Earnings in Abbotsford are $37,083, $42,750 for men and $27,440 for women, a difference of 35.8%.
| Sex | Number | Average Earnings |
| Male | 647 (57.0%) | $42,750 |
| Female | 489 (43.0%) | $27,440 |
| Total | 1,136 (100.0%) | $37,083 |
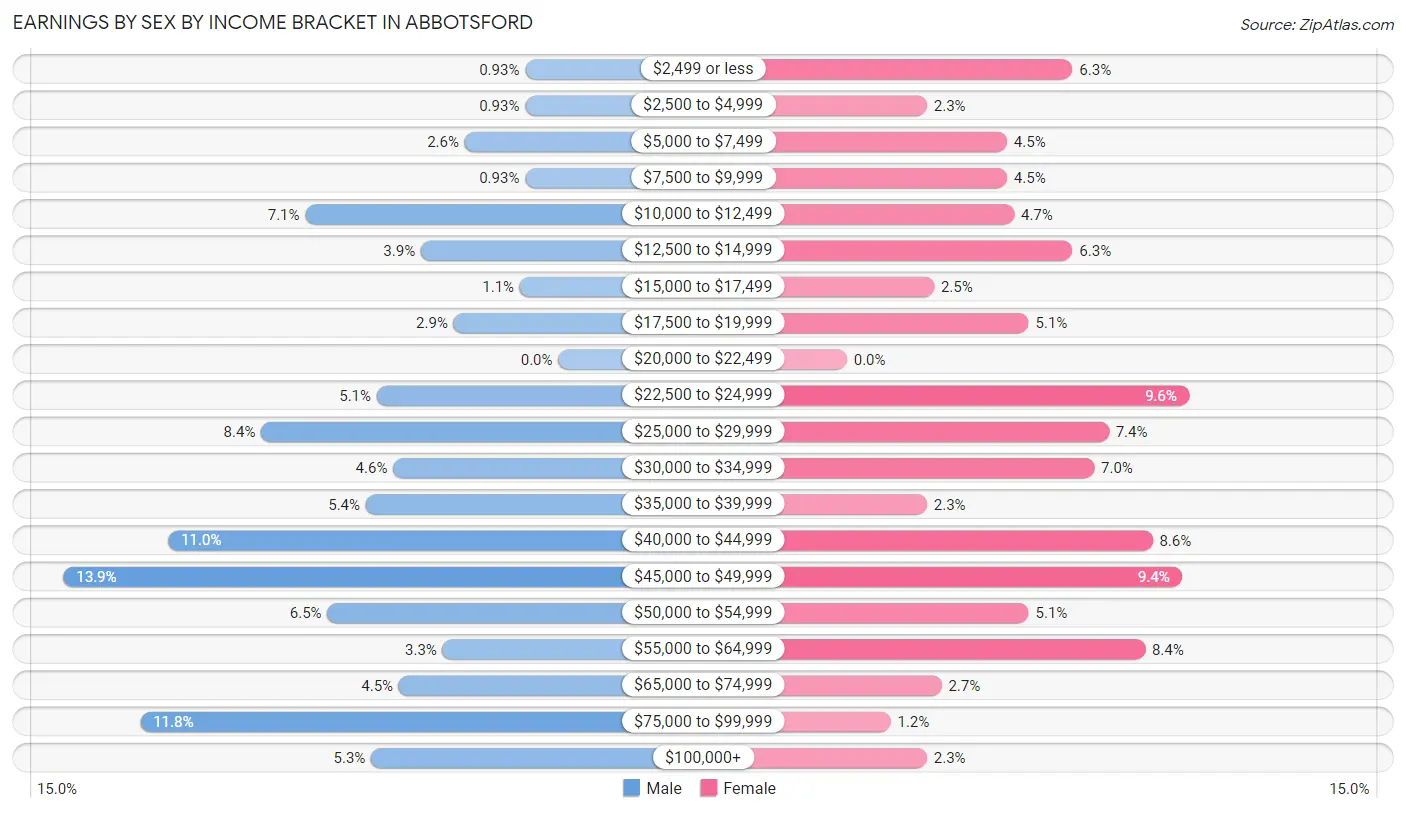
Earnings by Sex by Income Bracket in Abbotsford
The most common earnings brackets in Abbotsford are $45,000 to $49,999 for men (90 | 13.9%) and $22,500 to $24,999 for women (47 | 9.6%).
| Income | Male | Female |
| $2,499 or less | 6 (0.9%) | 31 (6.3%) |
| $2,500 to $4,999 | 6 (0.9%) | 11 (2.2%) |
| $5,000 to $7,499 | 17 (2.6%) | 22 (4.5%) |
| $7,500 to $9,999 | 6 (0.9%) | 22 (4.5%) |
| $10,000 to $12,499 | 46 (7.1%) | 23 (4.7%) |
| $12,500 to $14,999 | 25 (3.9%) | 31 (6.3%) |
| $15,000 to $17,499 | 7 (1.1%) | 12 (2.5%) |
| $17,500 to $19,999 | 19 (2.9%) | 25 (5.1%) |
| $20,000 to $22,499 | 0 (0.0%) | 0 (0.0%) |
| $22,500 to $24,999 | 33 (5.1%) | 47 (9.6%) |
| $25,000 to $29,999 | 54 (8.4%) | 36 (7.4%) |
| $30,000 to $34,999 | 30 (4.6%) | 34 (7.0%) |
| $35,000 to $39,999 | 35 (5.4%) | 11 (2.2%) |
| $40,000 to $44,999 | 71 (11.0%) | 42 (8.6%) |
| $45,000 to $49,999 | 90 (13.9%) | 46 (9.4%) |
| $50,000 to $54,999 | 42 (6.5%) | 25 (5.1%) |
| $55,000 to $64,999 | 21 (3.3%) | 41 (8.4%) |
| $65,000 to $74,999 | 29 (4.5%) | 13 (2.7%) |
| $75,000 to $99,999 | 76 (11.7%) | 6 (1.2%) |
| $100,000+ | 34 (5.3%) | 11 (2.2%) |
| Total | 647 (100.0%) | 489 (100.0%) |
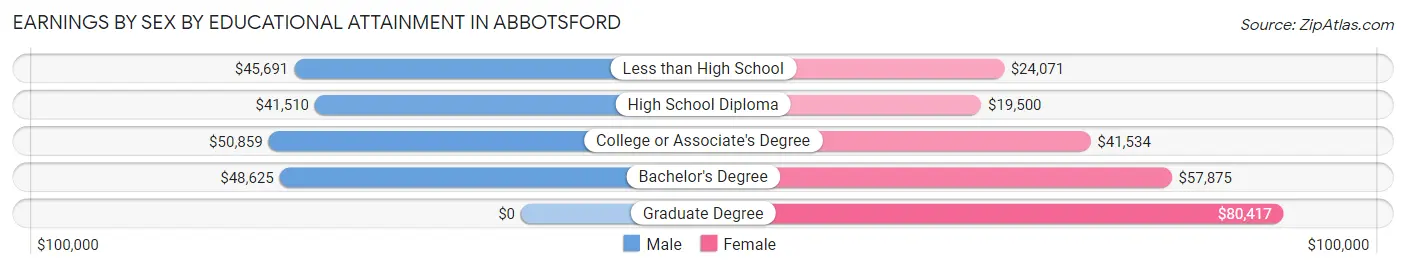
Earnings by Sex by Educational Attainment in Abbotsford
Average earnings in Abbotsford are $45,143 for men and $31,667 for women, a difference of 29.8%. Men with an educational attainment of college or associate's degree enjoy the highest average annual earnings of $50,859, while those with high school diploma education earn the least with $41,510. Women with an educational attainment of graduate degree earn the most with the average annual earnings of $80,417, while those with high school diploma education have the smallest earnings of $19,500.
| Educational Attainment | Male Income | Female Income |
| Less than High School | $45,691 | $24,071 |
| High School Diploma | $41,510 | $19,500 |
| College or Associate's Degree | $50,859 | $41,534 |
| Bachelor's Degree | $48,625 | $57,875 |
| Graduate Degree | - | - |
| Total | $45,143 | $31,667 |
Family Income in Abbotsford
Family Income Brackets in Abbotsford
According to the Abbotsford family income data, there are 118 families falling into the $100,000 to $149,999 income range, which is the most common income bracket and makes up 22.1% of all families. Conversely, the less than $10,000 income bracket is the least frequent group with only 10 families (1.9%) belonging to this category.
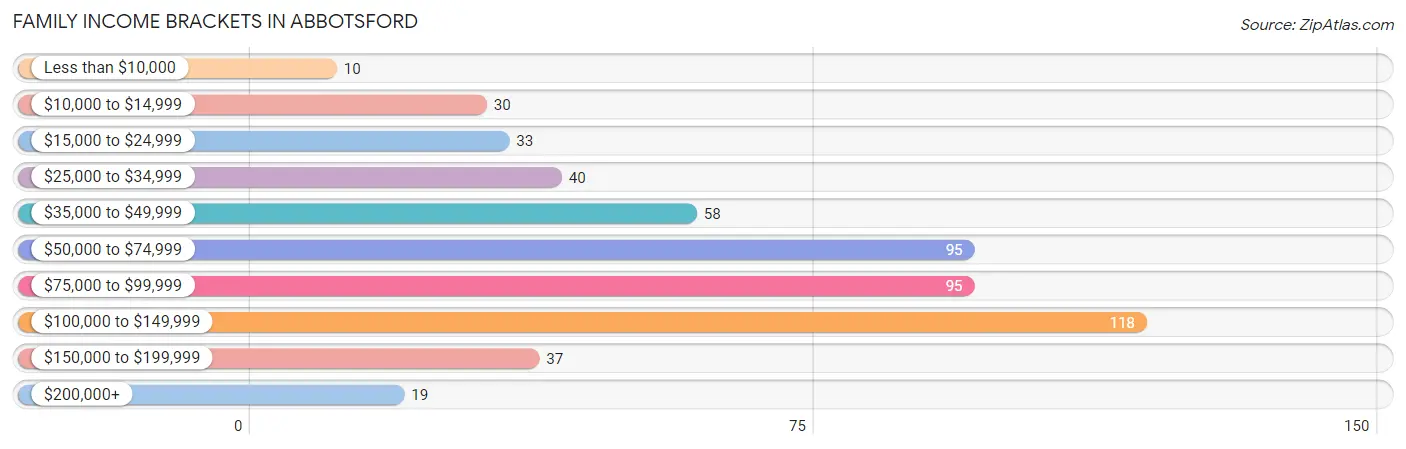
| Income Bracket | # Families | % Families |
| Less than $10,000 | 10 | 1.9% |
| $10,000 to $14,999 | 30 | 5.6% |
| $15,000 to $24,999 | 33 | 6.2% |
| $25,000 to $34,999 | 40 | 7.5% |
| $35,000 to $49,999 | 58 | 10.8% |
| $50,000 to $74,999 | 95 | 17.8% |
| $75,000 to $99,999 | 95 | 17.8% |
| $100,000 to $149,999 | 118 | 22.1% |
| $150,000 to $199,999 | 37 | 6.9% |
| $200,000+ | 19 | 3.6% |
Family Income by Famaliy Size in Abbotsford
5-person families (58 | 10.8%) account for the highest median family income in Abbotsford with $118,750 per family, while 2-person families (267 | 49.9%) have the highest median income of $40,268 per family member.
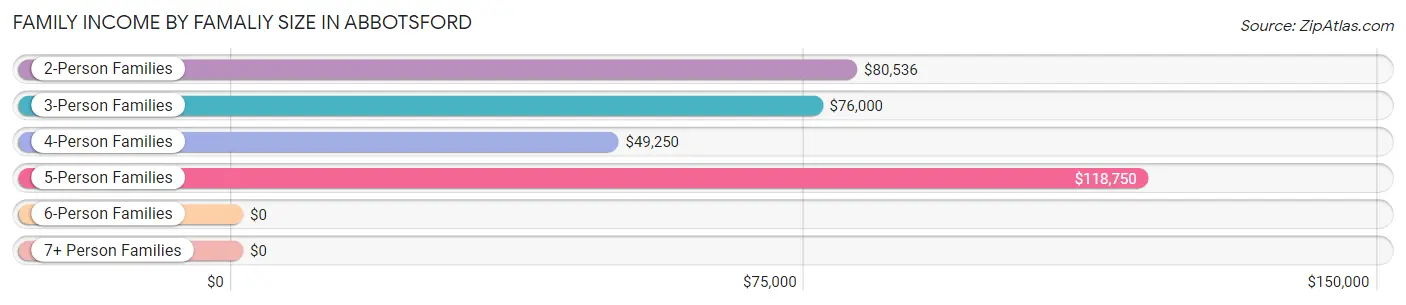
| Income Bracket | # Families | Median Income |
| 2-Person Families | 267 (49.9%) | $80,536 |
| 3-Person Families | 78 (14.6%) | $76,000 |
| 4-Person Families | 121 (22.6%) | $49,250 |
| 5-Person Families | 58 (10.8%) | $118,750 |
| 6-Person Families | 11 (2.1%) | $0 |
| 7+ Person Families | 0 (0.0%) | $0 |
| Total | 535 (100.0%) | $75,750 |
Family Income by Number of Earners in Abbotsford
The median family income in Abbotsford is $75,750, with families comprising 2 earners (203) having the highest median family income of $100,938, while families with 1 earner (179) have the lowest median family income of $29,375, accounting for 37.9% and 33.5% of families, respectively.
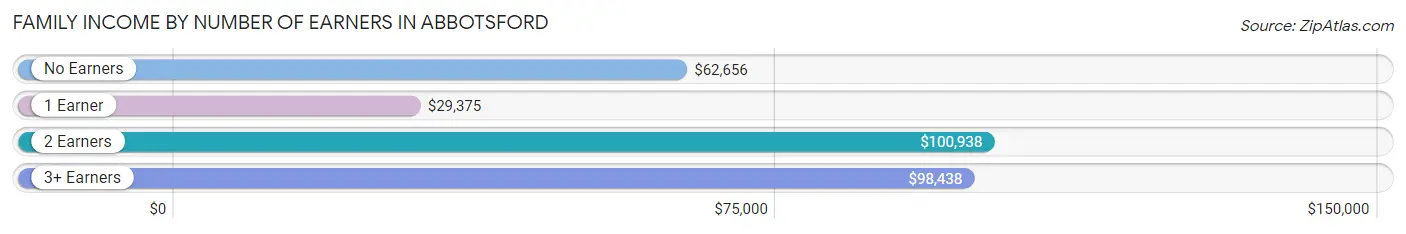
| Number of Earners | # Families | Median Income |
| No Earners | 75 (14.0%) | $62,656 |
| 1 Earner | 179 (33.5%) | $29,375 |
| 2 Earners | 203 (37.9%) | $100,938 |
| 3+ Earners | 78 (14.6%) | $98,438 |
| Total | 535 (100.0%) | $75,750 |
Household Income in Abbotsford
Household Income Brackets in Abbotsford
With 182 households falling in the category, the $50,000 to $74,999 income range is the most frequent in Abbotsford, accounting for 23.4% of all households. In contrast, only 17 households (2.2%) fall into the less than $10,000 income bracket, making it the least populous group.
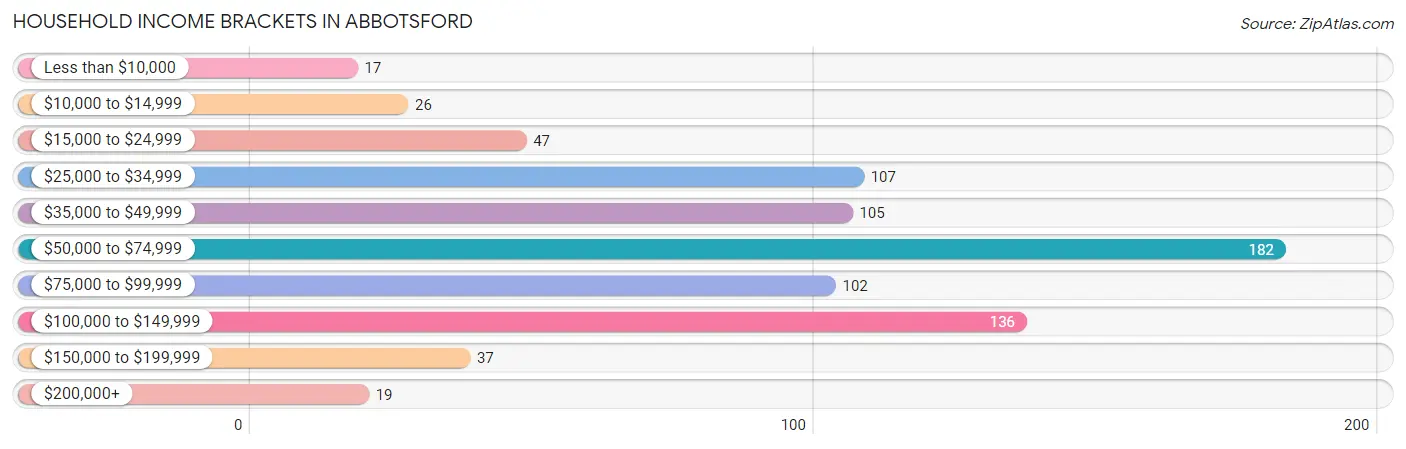
| Income Bracket | # Households | % Households |
| Less than $10,000 | 17 | 2.2% |
| $10,000 to $14,999 | 26 | 3.3% |
| $15,000 to $24,999 | 47 | 6.0% |
| $25,000 to $34,999 | 107 | 13.8% |
| $35,000 to $49,999 | 105 | 13.5% |
| $50,000 to $74,999 | 182 | 23.4% |
| $75,000 to $99,999 | 102 | 13.1% |
| $100,000 to $149,999 | 136 | 17.5% |
| $150,000 to $199,999 | 37 | 4.8% |
| $200,000+ | 19 | 2.4% |
Household Income by Householder Age in Abbotsford
The median household income in Abbotsford is $58,125, with the highest median household income of $74,722 found in the 45 to 64 years age bracket for the primary householder. A total of 318 households (40.9%) fall into this category. Meanwhile, the 65+ years age bracket for the primary householder has the lowest median household income of $34,524, with 174 households (22.4%) in this group.
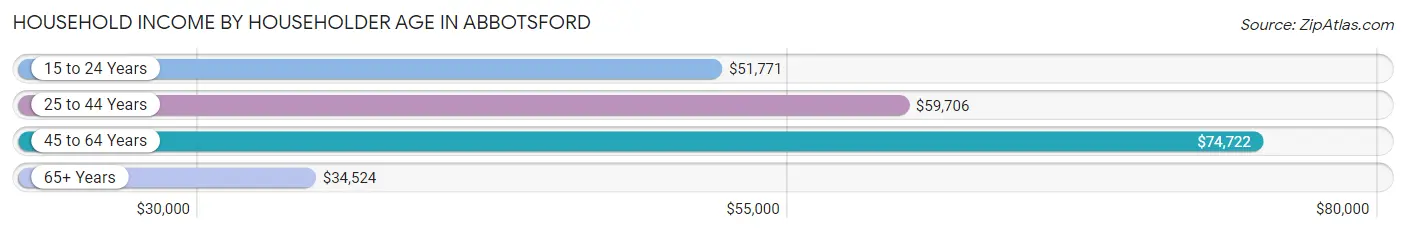
| Income Bracket | # Households | Median Income |
| 15 to 24 Years | 46 (5.9%) | $51,771 |
| 25 to 44 Years | 240 (30.8%) | $59,706 |
| 45 to 64 Years | 318 (40.9%) | $74,722 |
| 65+ Years | 174 (22.4%) | $34,524 |
| Total | 778 (100.0%) | $58,125 |
Poverty in Abbotsford
Income Below Poverty by Sex and Age in Abbotsford
With 12.4% poverty level for males and 22.7% for females among the residents of Abbotsford, 5 year old males and 6 to 11 year old females are the most vulnerable to poverty, with 20 males (58.8%) and 37 females (64.9%) in their respective age groups living below the poverty level.
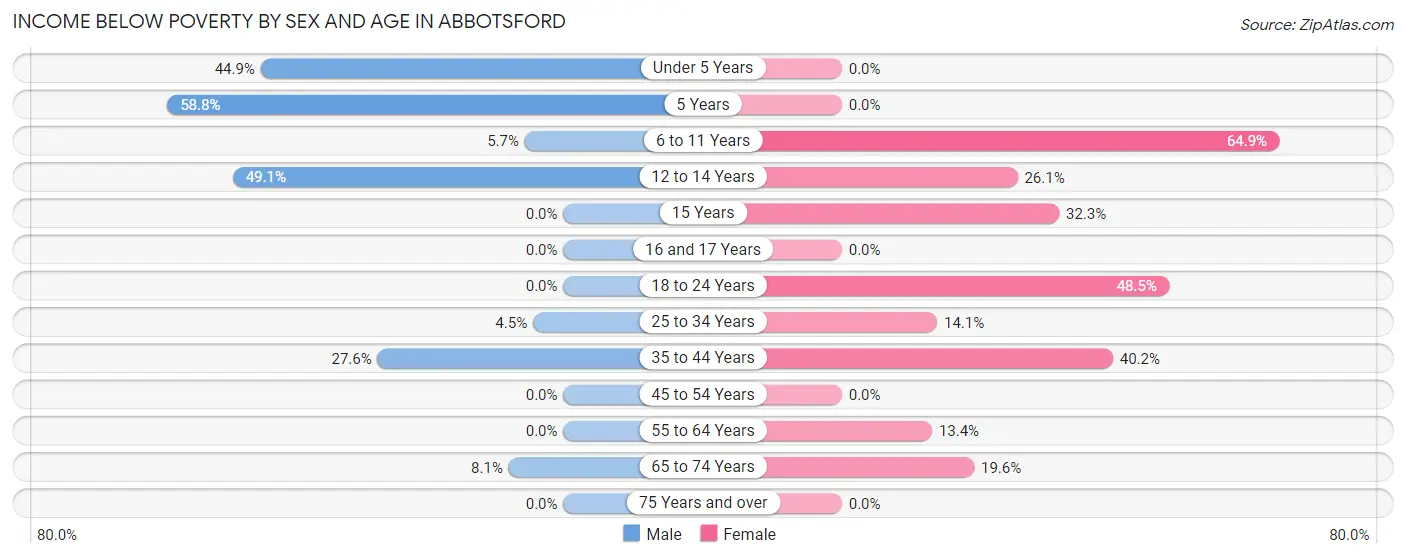
| Age Bracket | Male | Female |
| Under 5 Years | 40 (44.9%) | 0 (0.0%) |
| 5 Years | 20 (58.8%) | 0 (0.0%) |
| 6 to 11 Years | 9 (5.7%) | 37 (64.9%) |
| 12 to 14 Years | 27 (49.1%) | 18 (26.1%) |
| 15 Years | 0 (0.0%) | 10 (32.3%) |
| 16 and 17 Years | 0 (0.0%) | 0 (0.0%) |
| 18 to 24 Years | 0 (0.0%) | 50 (48.5%) |
| 25 to 34 Years | 6 (4.5%) | 14 (14.1%) |
| 35 to 44 Years | 32 (27.6%) | 68 (40.2%) |
| 45 to 54 Years | 0 (0.0%) | 0 (0.0%) |
| 55 to 64 Years | 0 (0.0%) | 15 (13.4%) |
| 65 to 74 Years | 6 (8.1%) | 11 (19.6%) |
| 75 Years and over | 0 (0.0%) | 0 (0.0%) |
| Total | 140 (12.4%) | 223 (22.7%) |
Income Above Poverty by Sex and Age in Abbotsford
According to the poverty statistics in Abbotsford, males aged 15 years and females aged under 5 years are the age groups that are most secure financially, with 100.0% of males and 100.0% of females in these age groups living above the poverty line.
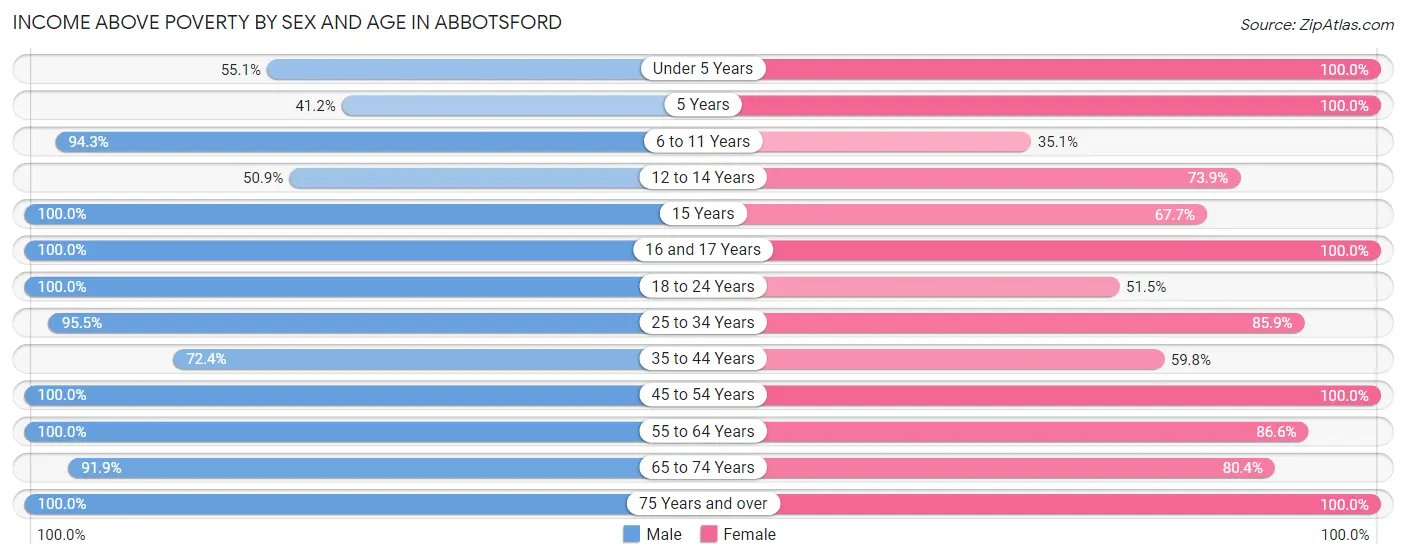
| Age Bracket | Male | Female |
| Under 5 Years | 49 (55.1%) | 35 (100.0%) |
| 5 Years | 14 (41.2%) | 6 (100.0%) |
| 6 to 11 Years | 148 (94.3%) | 20 (35.1%) |
| 12 to 14 Years | 28 (50.9%) | 51 (73.9%) |
| 15 Years | 15 (100.0%) | 21 (67.7%) |
| 16 and 17 Years | 26 (100.0%) | 39 (100.0%) |
| 18 to 24 Years | 104 (100.0%) | 53 (51.5%) |
| 25 to 34 Years | 127 (95.5%) | 85 (85.9%) |
| 35 to 44 Years | 84 (72.4%) | 101 (59.8%) |
| 45 to 54 Years | 157 (100.0%) | 129 (100.0%) |
| 55 to 64 Years | 146 (100.0%) | 97 (86.6%) |
| 65 to 74 Years | 68 (91.9%) | 45 (80.4%) |
| 75 Years and over | 27 (100.0%) | 76 (100.0%) |
| Total | 993 (87.6%) | 758 (77.3%) |
Income Below Poverty Among Married-Couple Families in Abbotsford
The poverty statistics for married-couple families in Abbotsford show that 2.7% or 10 of the total 371 families live below the poverty line. Families with 3 or 4 children have the highest poverty rate of 8.9%, comprising of 4 families. On the other hand, families with 1 or 2 children have the lowest poverty rate of 0.0%, which includes 0 families.
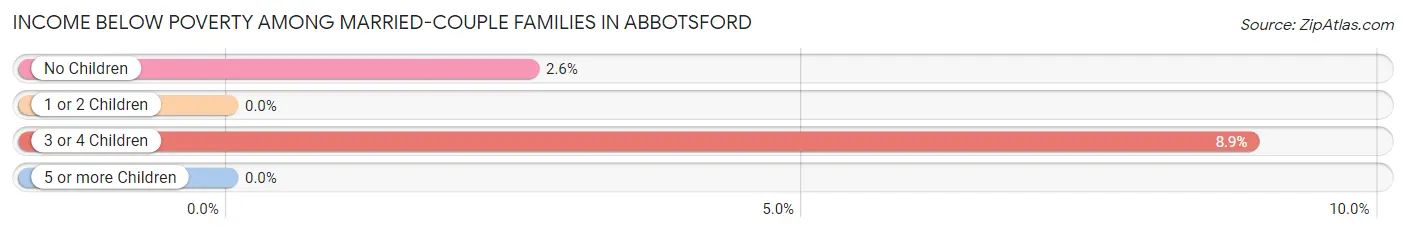
| Children | Above Poverty | Below Poverty |
| No Children | 223 (97.4%) | 6 (2.6%) |
| 1 or 2 Children | 97 (100.0%) | 0 (0.0%) |
| 3 or 4 Children | 41 (91.1%) | 4 (8.9%) |
| 5 or more Children | 0 (0.0%) | 0 (0.0%) |
| Total | 361 (97.3%) | 10 (2.7%) |
Income Below Poverty Among Single-Parent Households in Abbotsford
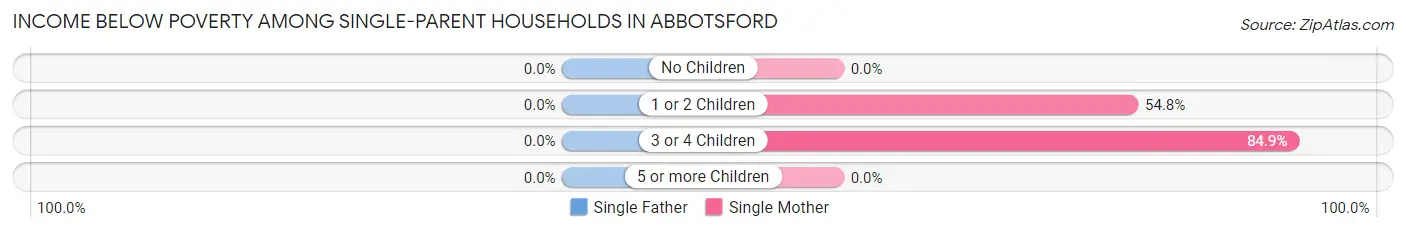
| Children | Single Father | Single Mother |
| No Children | 0 (0.0%) | 0 (0.0%) |
| 1 or 2 Children | 0 (0.0%) | 34 (54.8%) |
| 3 or 4 Children | 0 (0.0%) | 28 (84.9%) |
| 5 or more Children | 0 (0.0%) | 0 (0.0%) |
| Total | 0 (0.0%) | 62 (60.8%) |
Income Below Poverty Among Married-Couple vs Single-Parent Households in Abbotsford
The poverty data for Abbotsford shows that 10 of the married-couple family households (2.7%) and 62 of the single-parent households (37.8%) are living below the poverty level. Within the married-couple family households, those with 3 or 4 children have the highest poverty rate, with 4 households (8.9%) falling below the poverty line. Among the single-parent households, those with 3 or 4 children have the highest poverty rate, with 28 household (84.9%) living below poverty.
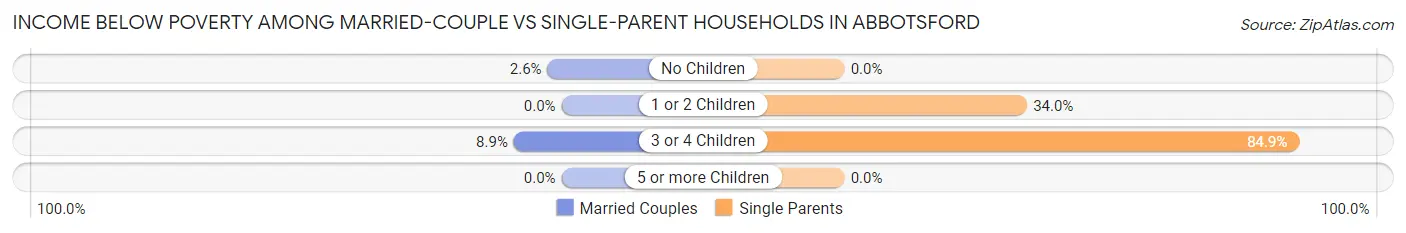
| Children | Married-Couple Families | Single-Parent Households |
| No Children | 6 (2.6%) | 0 (0.0%) |
| 1 or 2 Children | 0 (0.0%) | 34 (34.0%) |
| 3 or 4 Children | 4 (8.9%) | 28 (84.9%) |
| 5 or more Children | 0 (0.0%) | 0 (0.0%) |
| Total | 10 (2.7%) | 62 (37.8%) |
Race in Abbotsford
The most populous races in Abbotsford are White / Caucasian (1,599 | 73.2%), Hispanic or Latino (909 | 41.6%), and Some other Race (238 | 10.9%).
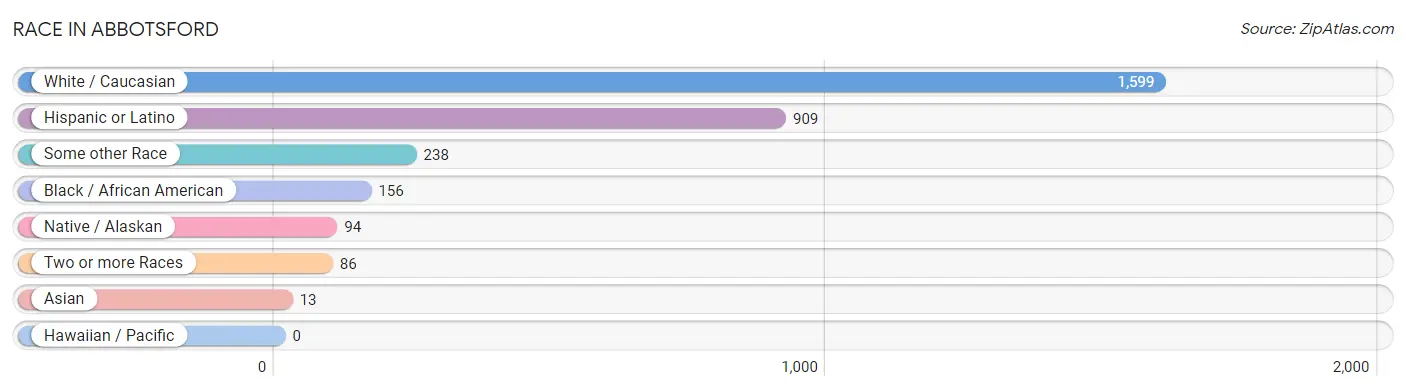
| Race | # Population | % Population |
| Asian | 13 | 0.6% |
| Black / African American | 156 | 7.1% |
| Hawaiian / Pacific | 0 | 0.0% |
| Hispanic or Latino | 909 | 41.6% |
| Native / Alaskan | 94 | 4.3% |
| White / Caucasian | 1,599 | 73.2% |
| Two or more Races | 86 | 3.9% |
| Some other Race | 238 | 10.9% |
| Total | 2,186 | 100.0% |
Ancestry in Abbotsford
The most populous ancestries reported in Abbotsford are German (750 | 34.3%), Mexican (561 | 25.7%), Puerto Rican (192 | 8.8%), Irish (133 | 6.1%), and Mexican American Indian (98 | 4.5%), together accounting for 79.3% of all Abbotsford residents.
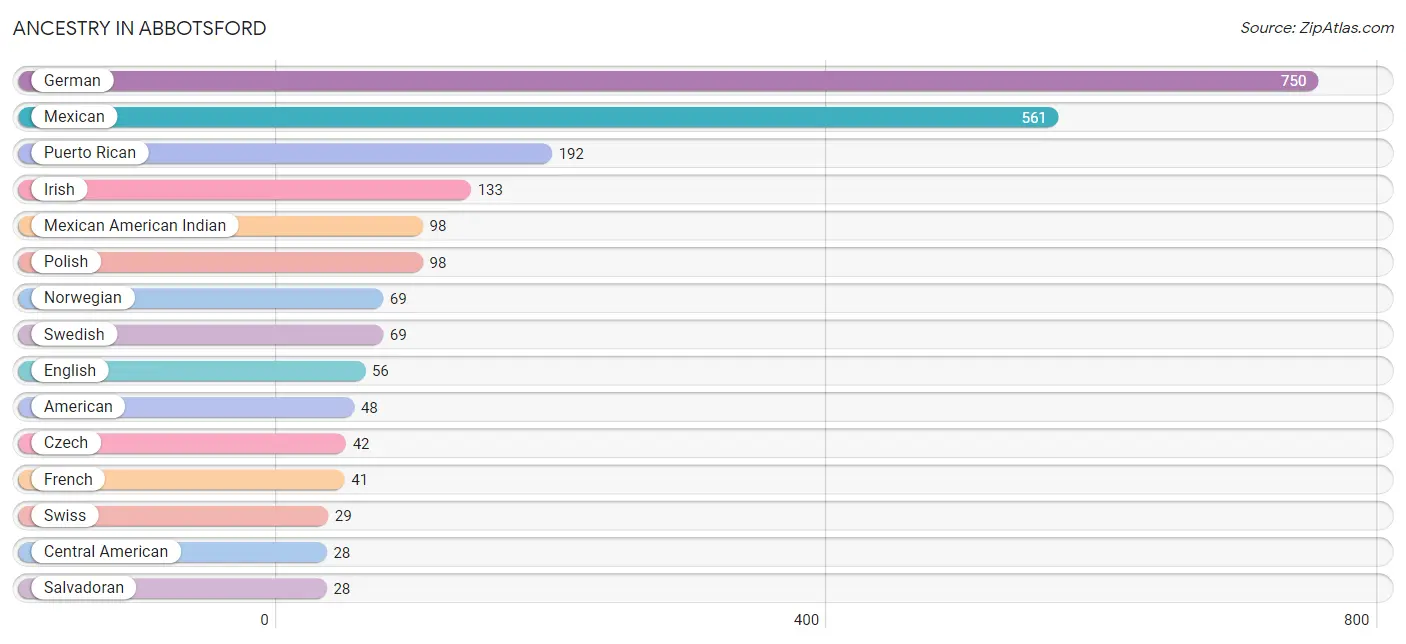
| Ancestry | # Population | % Population |
| American | 48 | 2.2% |
| Burmese | 13 | 0.6% |
| Central American | 28 | 1.3% |
| Croatian | 12 | 0.5% |
| Czech | 42 | 1.9% |
| Danish | 4 | 0.2% |
| Dutch | 13 | 0.6% |
| Ecuadorian | 5 | 0.2% |
| English | 56 | 2.6% |
| Finnish | 5 | 0.2% |
| French | 41 | 1.9% |
| German | 750 | 34.3% |
| Hungarian | 6 | 0.3% |
| Irish | 133 | 6.1% |
| Italian | 9 | 0.4% |
| Mexican | 561 | 25.7% |
| Mexican American Indian | 98 | 4.5% |
| Norwegian | 69 | 3.2% |
| Polish | 98 | 4.5% |
| Puerto Rican | 192 | 8.8% |
| Salvadoran | 28 | 1.3% |
| Slovak | 7 | 0.3% |
| South American | 5 | 0.2% |
| Swedish | 69 | 3.2% |
| Swiss | 29 | 1.3% | View All 25 Rows |
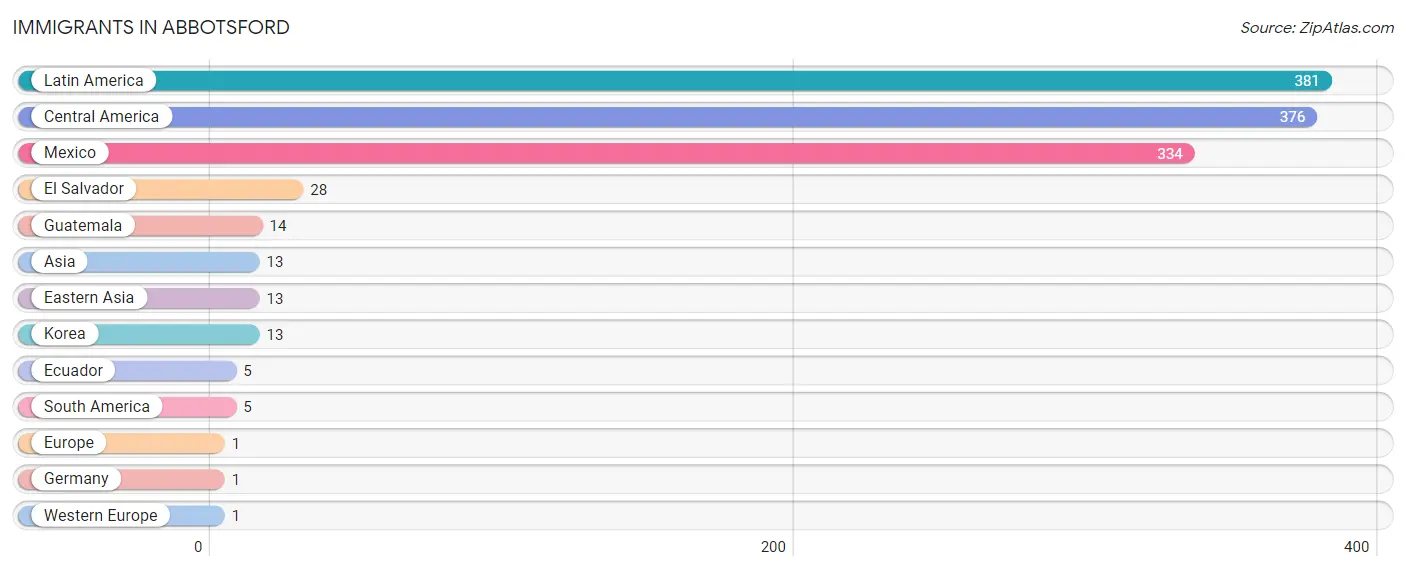
Immigrants in Abbotsford
The most numerous immigrant groups reported in Abbotsford came from Latin America (381 | 17.4%), Central America (376 | 17.2%), Mexico (334 | 15.3%), El Salvador (28 | 1.3%), and Guatemala (14 | 0.6%), together accounting for 51.8% of all Abbotsford residents.
| Immigration Origin | # Population | % Population |
| Asia | 13 | 0.6% |
| Central America | 376 | 17.2% |
| Eastern Asia | 13 | 0.6% |
| Ecuador | 5 | 0.2% |
| El Salvador | 28 | 1.3% |
| Europe | 1 | 0.1% |
| Germany | 1 | 0.1% |
| Guatemala | 14 | 0.6% |
| Korea | 13 | 0.6% |
| Latin America | 381 | 17.4% |
| Mexico | 334 | 15.3% |
| South America | 5 | 0.2% |
| Western Europe | 1 | 0.1% | View All 13 Rows |
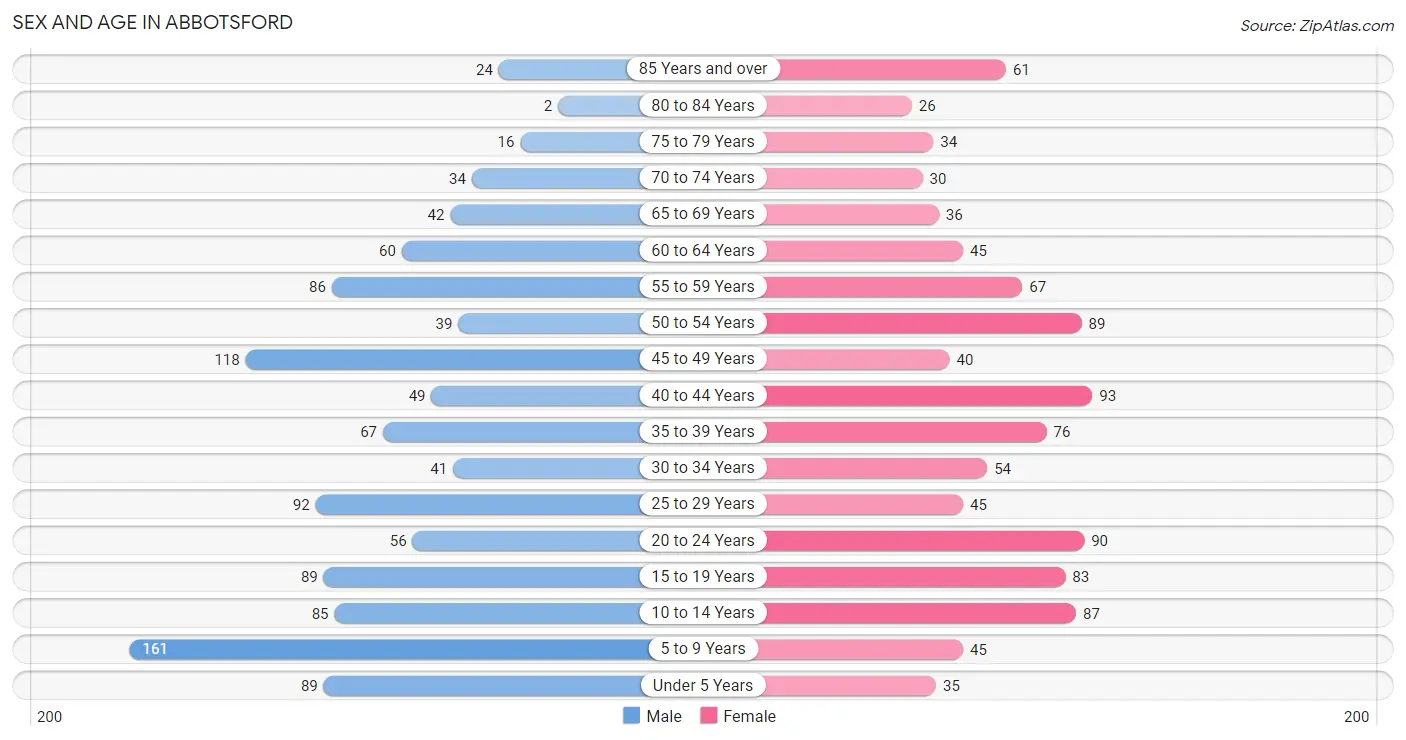
Sex and Age in Abbotsford
Sex and Age in Abbotsford
The most populous age groups in Abbotsford are 5 to 9 Years (161 | 14.0%) for men and 40 to 44 Years (93 | 9.0%) for women.
| Age Bracket | Male | Female |
| Under 5 Years | 89 (7.7%) | 35 (3.4%) |
| 5 to 9 Years | 161 (14.0%) | 45 (4.3%) |
| 10 to 14 Years | 85 (7.4%) | 87 (8.4%) |
| 15 to 19 Years | 89 (7.7%) | 83 (8.0%) |
| 20 to 24 Years | 56 (4.9%) | 90 (8.7%) |
| 25 to 29 Years | 92 (8.0%) | 45 (4.3%) |
| 30 to 34 Years | 41 (3.6%) | 54 (5.2%) |
| 35 to 39 Years | 67 (5.8%) | 76 (7.3%) |
| 40 to 44 Years | 49 (4.3%) | 93 (9.0%) |
| 45 to 49 Years | 118 (10.3%) | 40 (3.9%) |
| 50 to 54 Years | 39 (3.4%) | 89 (8.6%) |
| 55 to 59 Years | 86 (7.5%) | 67 (6.5%) |
| 60 to 64 Years | 60 (5.2%) | 45 (4.3%) |
| 65 to 69 Years | 42 (3.6%) | 36 (3.5%) |
| 70 to 74 Years | 34 (3.0%) | 30 (2.9%) |
| 75 to 79 Years | 16 (1.4%) | 34 (3.3%) |
| 80 to 84 Years | 2 (0.2%) | 26 (2.5%) |
| 85 Years and over | 24 (2.1%) | 61 (5.9%) |
| Total | 1,150 (100.0%) | 1,036 (100.0%) |
Families and Households in Abbotsford
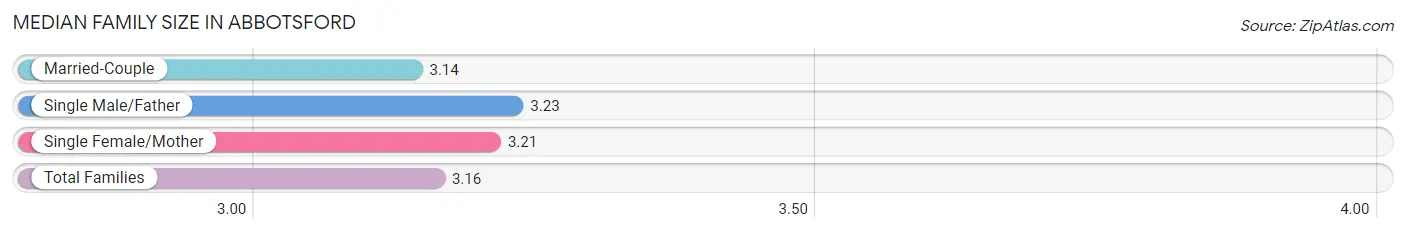
Median Family Size in Abbotsford
The median family size in Abbotsford is 3.16 persons per family, with single male/father families (62 | 11.6%) accounting for the largest median family size of 3.23 persons per family. On the other hand, married-couple families (371 | 69.4%) represent the smallest median family size with 3.14 persons per family.
| Family Type | # Families | Family Size |
| Married-Couple | 371 (69.4%) | 3.14 |
| Single Male/Father | 62 (11.6%) | 3.23 |
| Single Female/Mother | 102 (19.1%) | 3.21 |
| Total Families | 535 (100.0%) | 3.16 |
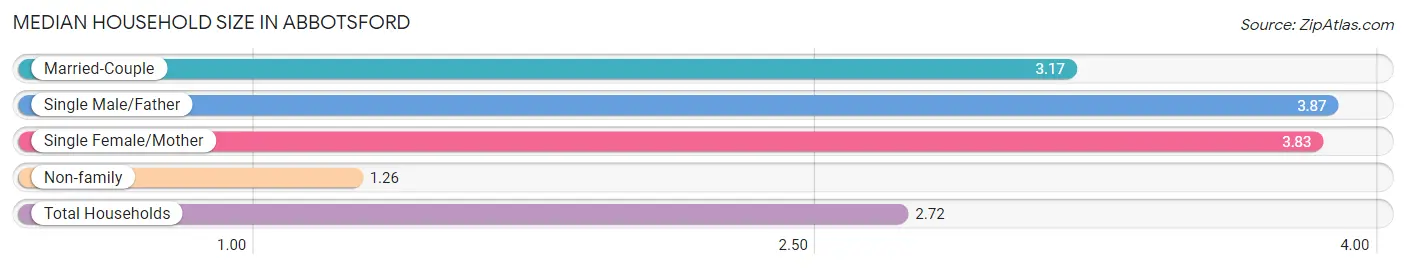
Median Household Size in Abbotsford
The median household size in Abbotsford is 2.72 persons per household, with single male/father households (62 | 8.0%) accounting for the largest median household size of 3.87 persons per household. non-family households (243 | 31.2%) represent the smallest median household size with 1.26 persons per household.
| Household Type | # Households | Household Size |
| Married-Couple | 371 (47.7%) | 3.17 |
| Single Male/Father | 62 (8.0%) | 3.87 |
| Single Female/Mother | 102 (13.1%) | 3.83 |
| Non-family | 243 (31.2%) | 1.26 |
| Total Households | 778 (100.0%) | 2.72 |
Household Size by Marriage Status in Abbotsford
Out of a total of 778 households in Abbotsford, 535 (68.8%) are family households, while 243 (31.2%) are nonfamily households. The most numerous type of family households are 2-person households, comprising 228, and the most common type of nonfamily households are 1-person households, comprising 175.
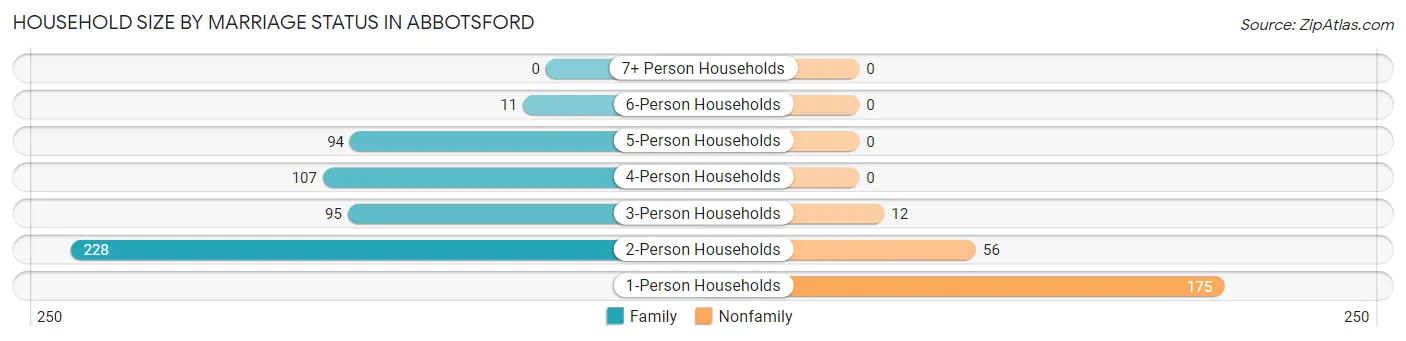
| Household Size | Family Households | Nonfamily Households |
| 1-Person Households | - | 175 (22.5%) |
| 2-Person Households | 228 (29.3%) | 56 (7.2%) |
| 3-Person Households | 95 (12.2%) | 12 (1.5%) |
| 4-Person Households | 107 (13.8%) | 0 (0.0%) |
| 5-Person Households | 94 (12.1%) | 0 (0.0%) |
| 6-Person Households | 11 (1.4%) | 0 (0.0%) |
| 7+ Person Households | 0 (0.0%) | 0 (0.0%) |
| Total | 535 (68.8%) | 243 (31.2%) |
Female Fertility in Abbotsford
Fertility by Age in Abbotsford
Average fertility rate in Abbotsford is 19.0 births per 1,000 women. Women in the age bracket of 20 to 34 years have the highest fertility rate with 48.0 births per 1,000 women. Women in the age bracket of 20 to 34 years acount for 100.0% of all women with births.
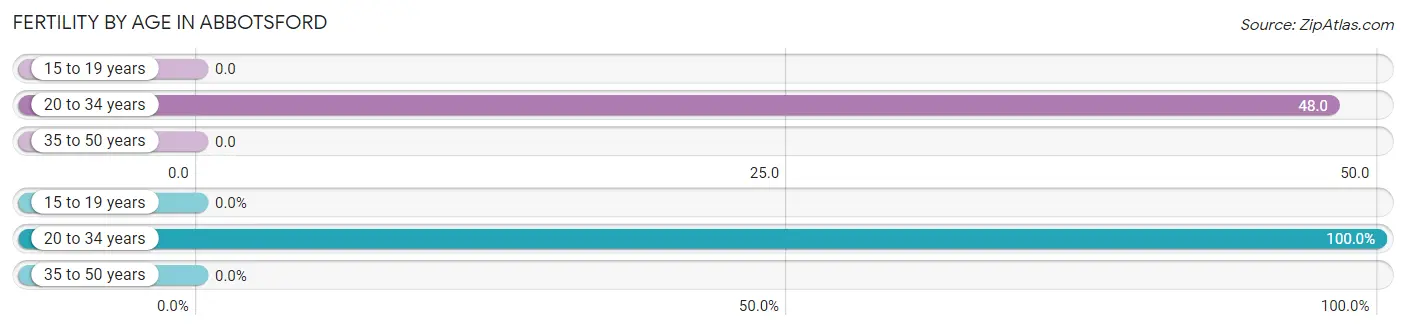
| Age Bracket | Women with Births | Births / 1,000 Women |
| 15 to 19 years | 0 (0.0%) | 0.0 |
| 20 to 34 years | 9 (100.0%) | 48.0 |
| 35 to 50 years | 0 (0.0%) | 0.0 |
| Total | 9 (100.0%) | 19.0 |
Fertility by Age by Marriage Status in Abbotsford
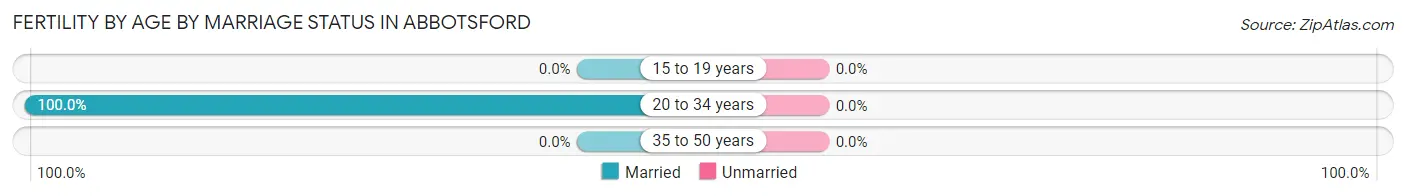
| Age Bracket | Married | Unmarried |
| 15 to 19 years | 0 (0.0%) | 0 (0.0%) |
| 20 to 34 years | 9 (100.0%) | 0 (0.0%) |
| 35 to 50 years | 0 (0.0%) | 0 (0.0%) |
| Total | 9 (100.0%) | 0 (0.0%) |
Fertility by Education in Abbotsford
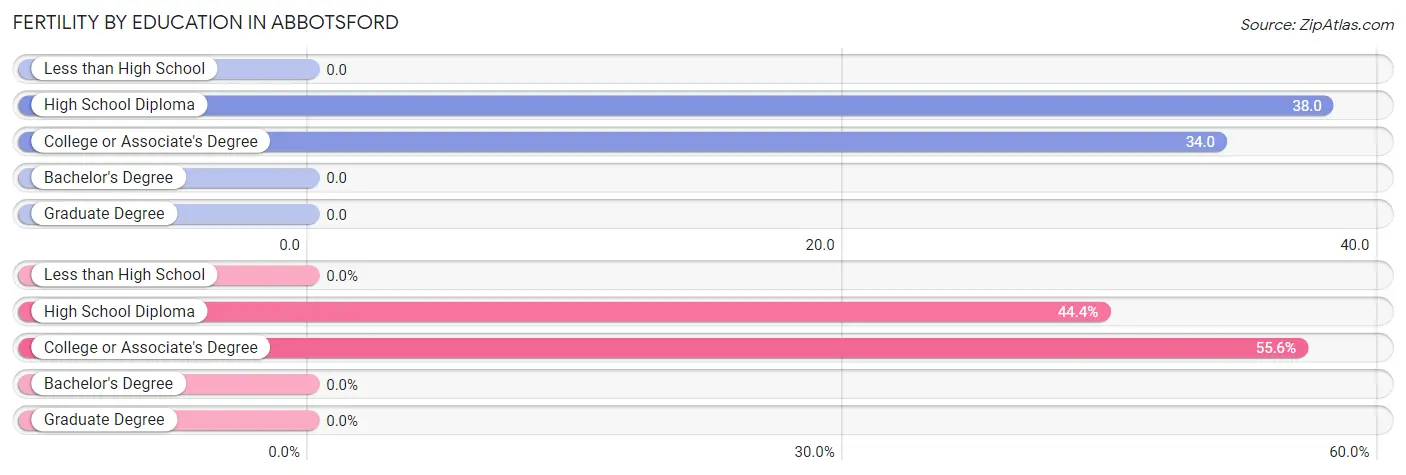
| Educational Attainment | Women with Births | Births / 1,000 Women |
| Less than High School | 0 (0.0%) | 0.0 |
| High School Diploma | 4 (44.4%) | 38.0 |
| College or Associate's Degree | 5 (55.6%) | 34.0 |
| Bachelor's Degree | 0 (0.0%) | 0.0 |
| Graduate Degree | 0 (0.0%) | 0.0 |
| Total | 9 (100.0%) | 19.0 |
Fertility by Education by Marriage Status in Abbotsford
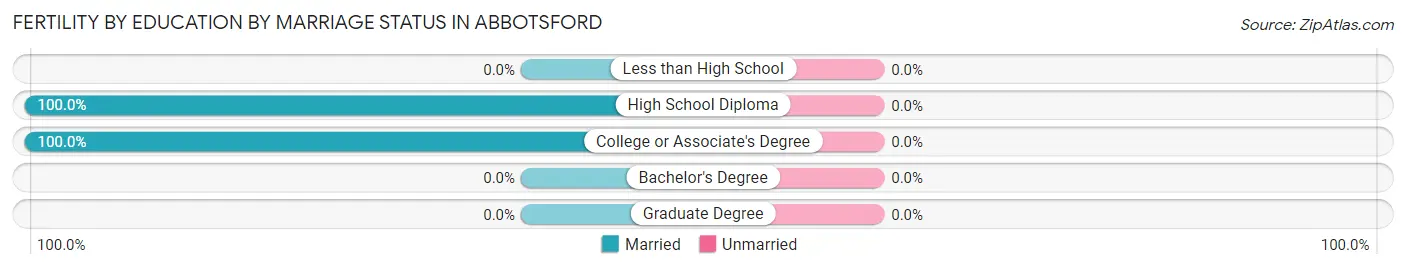
| Educational Attainment | Married | Unmarried |
| Less than High School | 0 (0.0%) | 0 (0.0%) |
| High School Diploma | 4 (100.0%) | 0 (0.0%) |
| College or Associate's Degree | 5 (100.0%) | 0 (0.0%) |
| Bachelor's Degree | 0 (0.0%) | 0 (0.0%) |
| Graduate Degree | 0 (0.0%) | 0 (0.0%) |
| Total | 9 (100.0%) | 0 (0.0%) |
Employment Characteristics in Abbotsford
Employment by Class of Employer in Abbotsford
Among the 1,057 employed individuals in Abbotsford, private company employees (781 | 73.9%), local government employees (96 | 9.1%), and not-for-profit organizations (69 | 6.5%) make up the most common classes of employment.
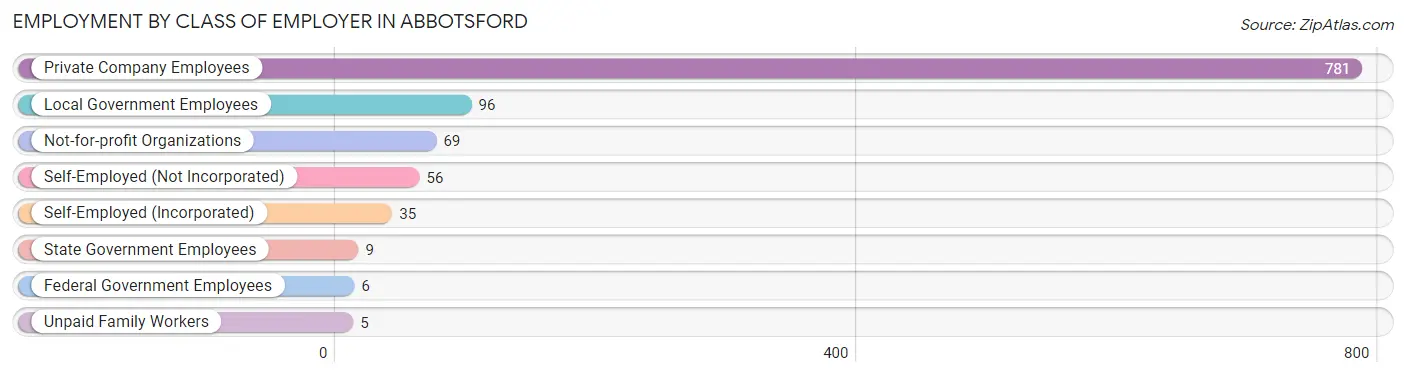
| Employer Class | # Employees | % Employees |
| Private Company Employees | 781 | 73.9% |
| Self-Employed (Incorporated) | 35 | 3.3% |
| Self-Employed (Not Incorporated) | 56 | 5.3% |
| Not-for-profit Organizations | 69 | 6.5% |
| Local Government Employees | 96 | 9.1% |
| State Government Employees | 9 | 0.9% |
| Federal Government Employees | 6 | 0.6% |
| Unpaid Family Workers | 5 | 0.5% |
| Total | 1,057 | 100.0% |
Employment Status by Age in Abbotsford
According to the labor force statistics for Abbotsford, out of the total population over 16 years of age (1,638), 68.9% or 1,129 individuals are in the labor force, with 6.2% or 70 of them unemployed. The age group with the highest labor force participation rate is 25 to 29 years, with 95.6% or 131 individuals in the labor force. Within the labor force, the 16 to 19 years age range has the highest percentage of unemployed individuals, with 17.1% or 12 of them being unemployed.
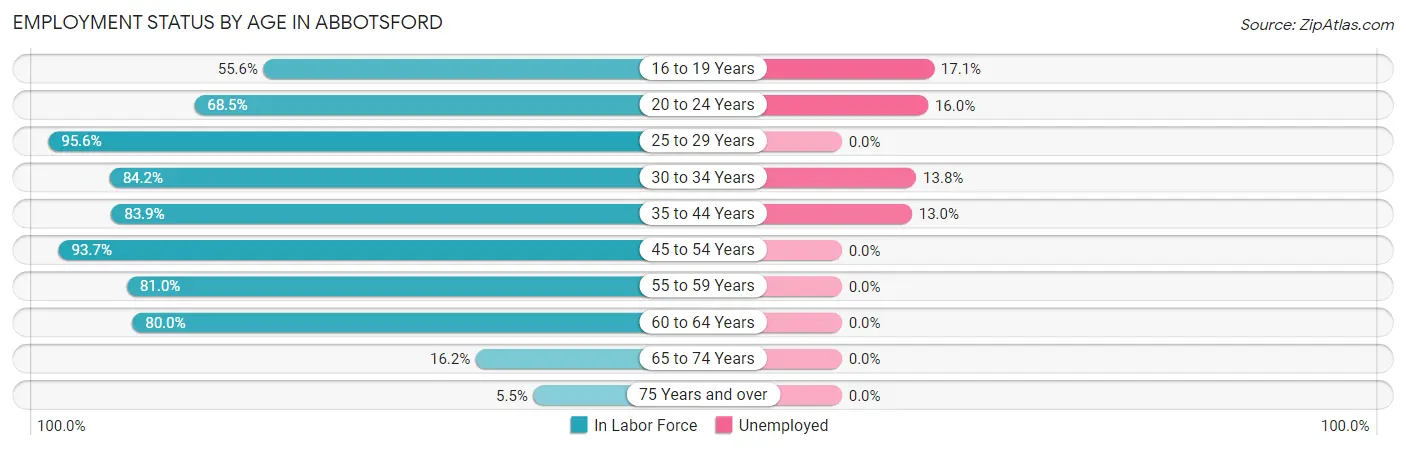
| Age Bracket | In Labor Force | Unemployed |
| 16 to 19 Years | 70 (55.6%) | 12 (17.1%) |
| 20 to 24 Years | 100 (68.5%) | 16 (16.0%) |
| 25 to 29 Years | 131 (95.6%) | 0 (0.0%) |
| 30 to 34 Years | 80 (84.2%) | 11 (13.8%) |
| 35 to 44 Years | 239 (83.9%) | 31 (13.0%) |
| 45 to 54 Years | 268 (93.7%) | 0 (0.0%) |
| 55 to 59 Years | 124 (81.0%) | 0 (0.0%) |
| 60 to 64 Years | 84 (80.0%) | 0 (0.0%) |
| 65 to 74 Years | 23 (16.2%) | 0 (0.0%) |
| 75 Years and over | 9 (5.5%) | 0 (0.0%) |
| Total | 1,129 (68.9%) | 70 (6.2%) |
Employment Status by Educational Attainment in Abbotsford
According to labor force statistics for Abbotsford, 87.3% of individuals (926) out of the total population between 25 and 64 years of age (1,061) are in the labor force, with 4.5% or 42 of them being unemployed. The group with the highest labor force participation rate are those with the educational attainment of bachelor's degree or higher, with 94.7% or 108 individuals in the labor force. Within the labor force, individuals with less than high school education have the highest percentage of unemployment, with 10.5% or 28 of them being unemployed.
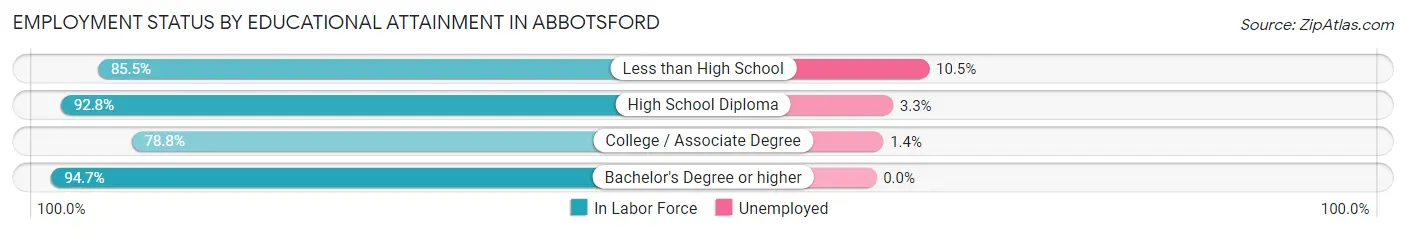
| Educational Attainment | In Labor Force | Unemployed |
| Less than High School | 266 (85.5%) | 33 (10.5%) |
| High School Diploma | 337 (92.8%) | 12 (3.3%) |
| College / Associate Degree | 215 (78.8%) | 4 (1.4%) |
| Bachelor's Degree or higher | 108 (94.7%) | 0 (0.0%) |
| Total | 926 (87.3%) | 48 (4.5%) |
Employment Occupations by Sex in Abbotsford
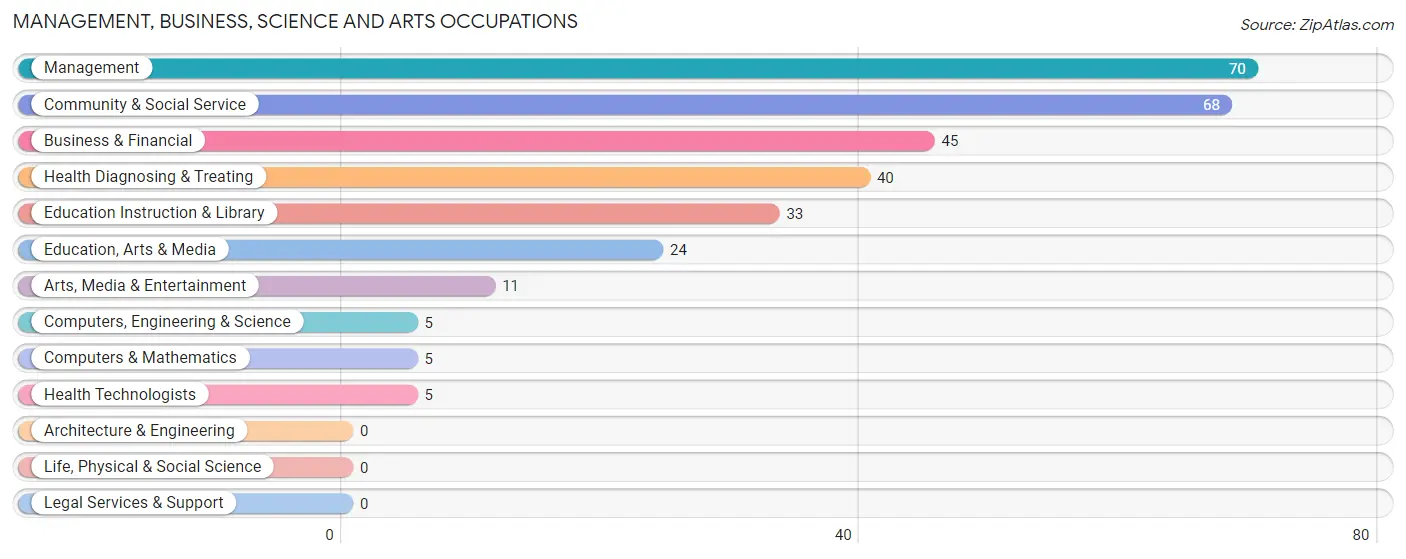
Management, Business, Science and Arts Occupations
The most common Management, Business, Science and Arts occupations in Abbotsford are Management (70 | 6.6%), Community & Social Service (68 | 6.4%), Business & Financial (45 | 4.3%), Health Diagnosing & Treating (40 | 3.8%), and Education Instruction & Library (33 | 3.1%).
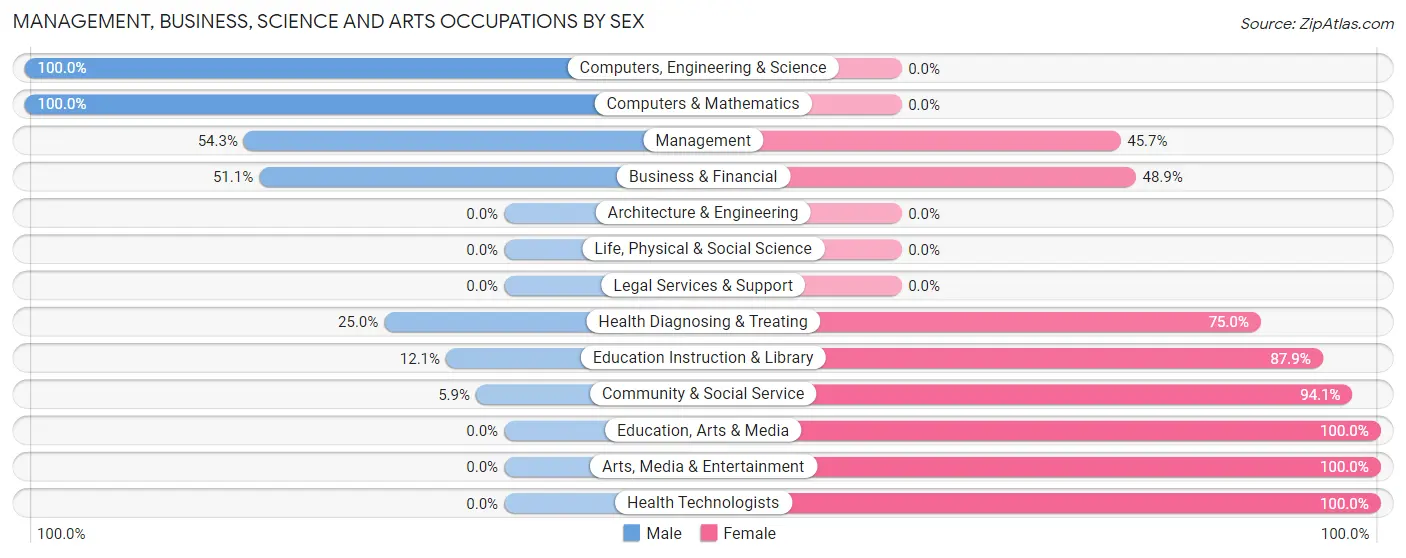
Management, Business, Science and Arts Occupations by Sex
Within the Management, Business, Science and Arts occupations in Abbotsford, the most male-oriented occupations are Computers, Engineering & Science (100.0%), Computers & Mathematics (100.0%), and Management (54.3%), while the most female-oriented occupations are Education, Arts & Media (100.0%), Arts, Media & Entertainment (100.0%), and Health Technologists (100.0%).
| Occupation | Male | Female |
| Management | 38 (54.3%) | 32 (45.7%) |
| Business & Financial | 23 (51.1%) | 22 (48.9%) |
| Computers, Engineering & Science | 5 (100.0%) | 0 (0.0%) |
| Computers & Mathematics | 5 (100.0%) | 0 (0.0%) |
| Architecture & Engineering | 0 (0.0%) | 0 (0.0%) |
| Life, Physical & Social Science | 0 (0.0%) | 0 (0.0%) |
| Community & Social Service | 4 (5.9%) | 64 (94.1%) |
| Education, Arts & Media | 0 (0.0%) | 24 (100.0%) |
| Legal Services & Support | 0 (0.0%) | 0 (0.0%) |
| Education Instruction & Library | 4 (12.1%) | 29 (87.9%) |
| Arts, Media & Entertainment | 0 (0.0%) | 11 (100.0%) |
| Health Diagnosing & Treating | 10 (25.0%) | 30 (75.0%) |
| Health Technologists | 0 (0.0%) | 5 (100.0%) |
| Total (Category) | 80 (35.1%) | 148 (64.9%) |
| Total (Overall) | 614 (58.0%) | 444 (42.0%) |
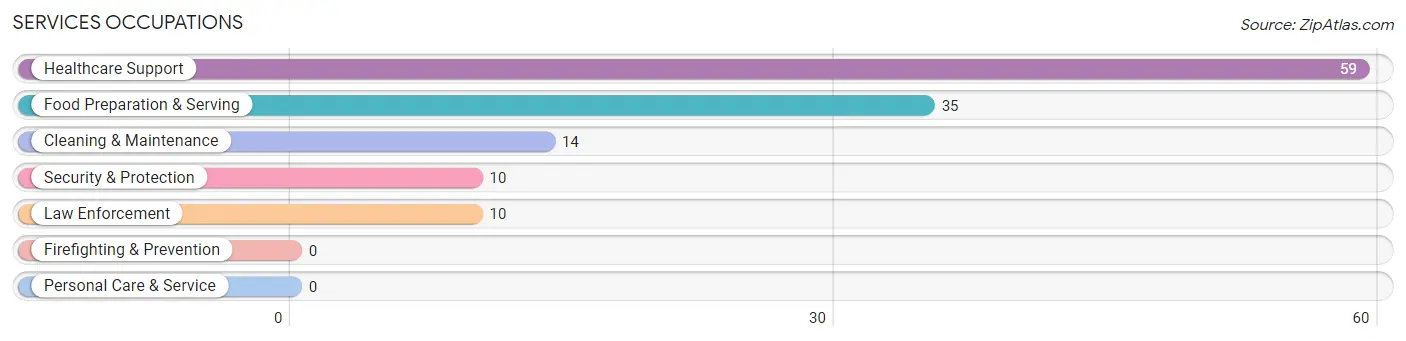
Services Occupations
The most common Services occupations in Abbotsford are Healthcare Support (59 | 5.6%), Food Preparation & Serving (35 | 3.3%), Cleaning & Maintenance (14 | 1.3%), Security & Protection (10 | 0.9%), and Law Enforcement (10 | 0.9%).
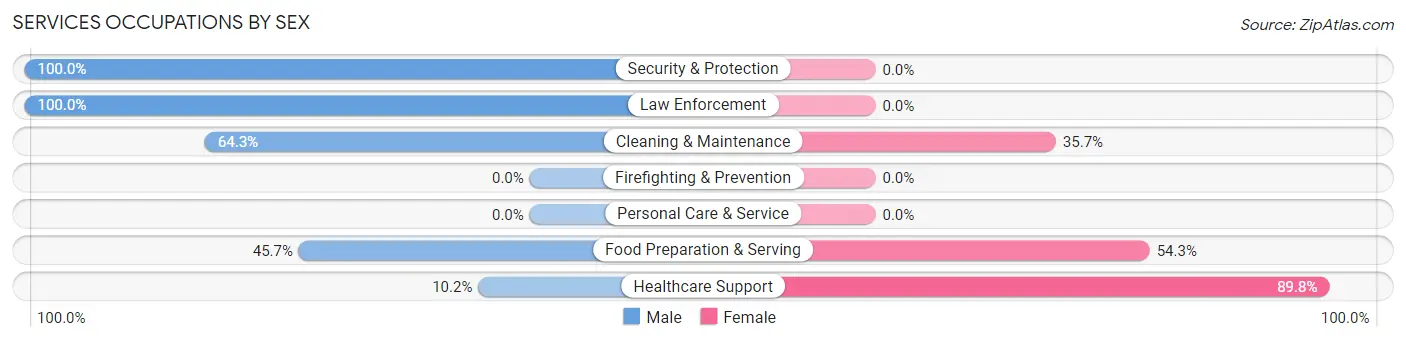
Services Occupations by Sex
Within the Services occupations in Abbotsford, the most male-oriented occupations are Security & Protection (100.0%), Law Enforcement (100.0%), and Cleaning & Maintenance (64.3%), while the most female-oriented occupations are Healthcare Support (89.8%), Food Preparation & Serving (54.3%), and Cleaning & Maintenance (35.7%).
| Occupation | Male | Female |
| Healthcare Support | 6 (10.2%) | 53 (89.8%) |
| Security & Protection | 10 (100.0%) | 0 (0.0%) |
| Firefighting & Prevention | 0 (0.0%) | 0 (0.0%) |
| Law Enforcement | 10 (100.0%) | 0 (0.0%) |
| Food Preparation & Serving | 16 (45.7%) | 19 (54.3%) |
| Cleaning & Maintenance | 9 (64.3%) | 5 (35.7%) |
| Personal Care & Service | 0 (0.0%) | 0 (0.0%) |
| Total (Category) | 41 (34.7%) | 77 (65.2%) |
| Total (Overall) | 614 (58.0%) | 444 (42.0%) |
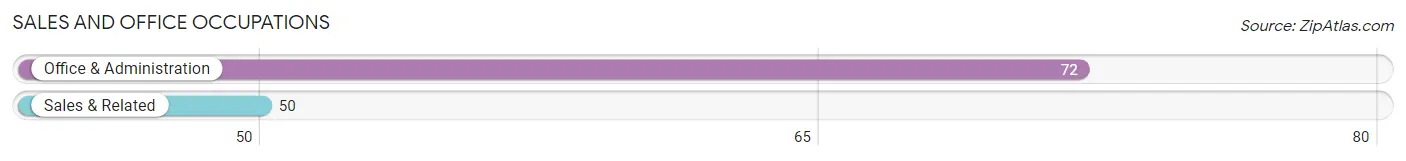
Sales and Office Occupations
The most common Sales and Office occupations in Abbotsford are Office & Administration (72 | 6.8%), and Sales & Related (50 | 4.7%).
Sales and Office Occupations by Sex
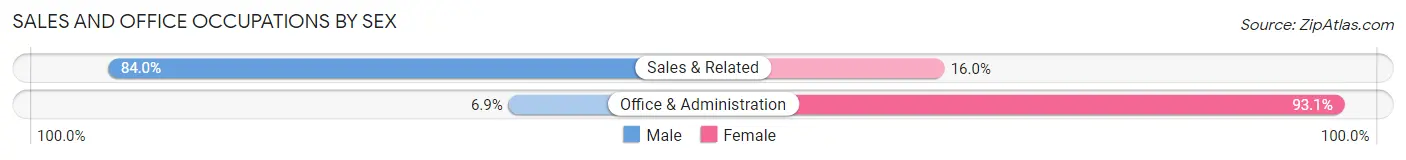
| Occupation | Male | Female |
| Sales & Related | 42 (84.0%) | 8 (16.0%) |
| Office & Administration | 5 (6.9%) | 67 (93.1%) |
| Total (Category) | 47 (38.5%) | 75 (61.5%) |
| Total (Overall) | 614 (58.0%) | 444 (42.0%) |
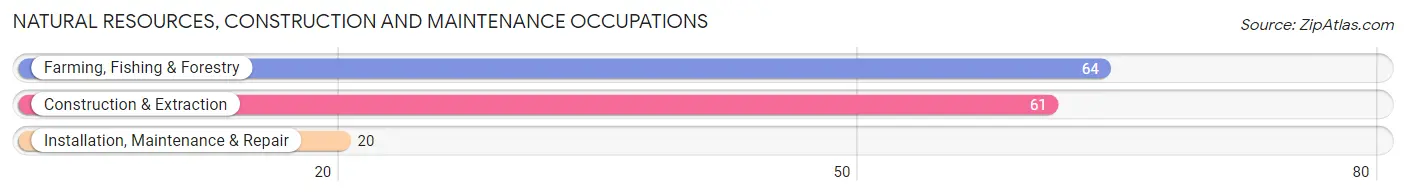
Natural Resources, Construction and Maintenance Occupations
The most common Natural Resources, Construction and Maintenance occupations in Abbotsford are Farming, Fishing & Forestry (64 | 6.0%), Construction & Extraction (61 | 5.8%), and Installation, Maintenance & Repair (20 | 1.9%).
Natural Resources, Construction and Maintenance Occupations by Sex
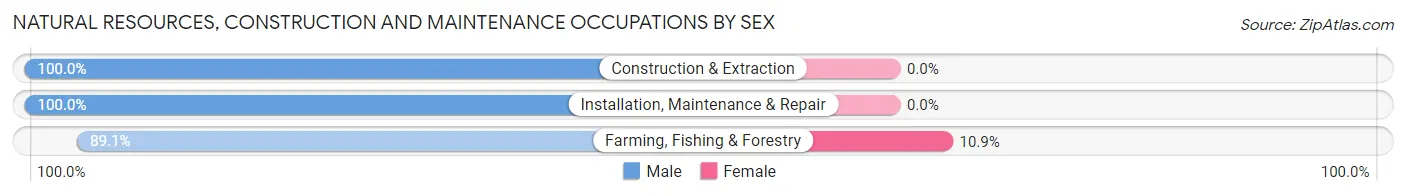
| Occupation | Male | Female |
| Farming, Fishing & Forestry | 57 (89.1%) | 7 (10.9%) |
| Construction & Extraction | 61 (100.0%) | 0 (0.0%) |
| Installation, Maintenance & Repair | 20 (100.0%) | 0 (0.0%) |
| Total (Category) | 138 (95.2%) | 7 (4.8%) |
| Total (Overall) | 614 (58.0%) | 444 (42.0%) |
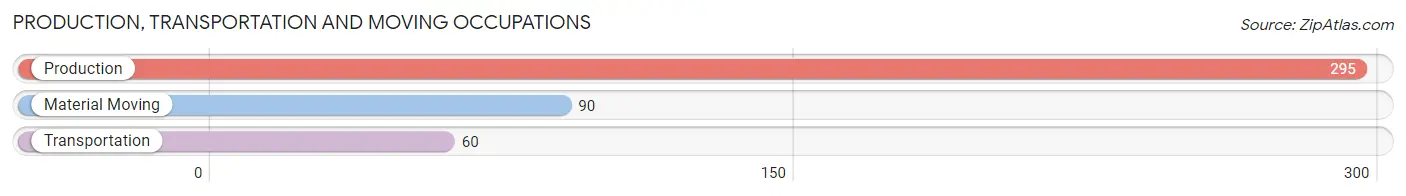
Production, Transportation and Moving Occupations
The most common Production, Transportation and Moving occupations in Abbotsford are Production (295 | 27.9%), Material Moving (90 | 8.5%), and Transportation (60 | 5.7%).
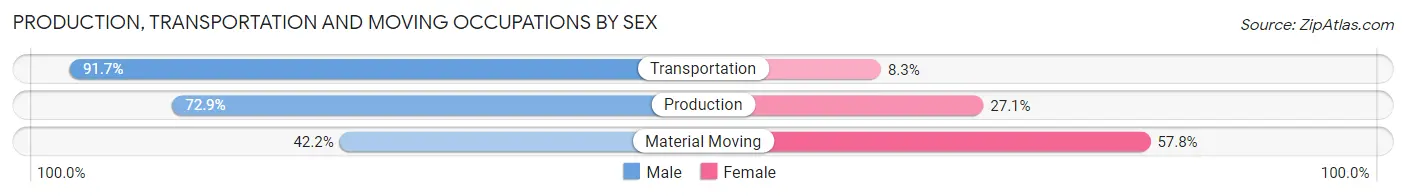
Production, Transportation and Moving Occupations by Sex
| Occupation | Male | Female |
| Production | 215 (72.9%) | 80 (27.1%) |
| Transportation | 55 (91.7%) | 5 (8.3%) |
| Material Moving | 38 (42.2%) | 52 (57.8%) |
| Total (Category) | 308 (69.2%) | 137 (30.8%) |
| Total (Overall) | 614 (58.0%) | 444 (42.0%) |
Employment Industries by Sex in Abbotsford
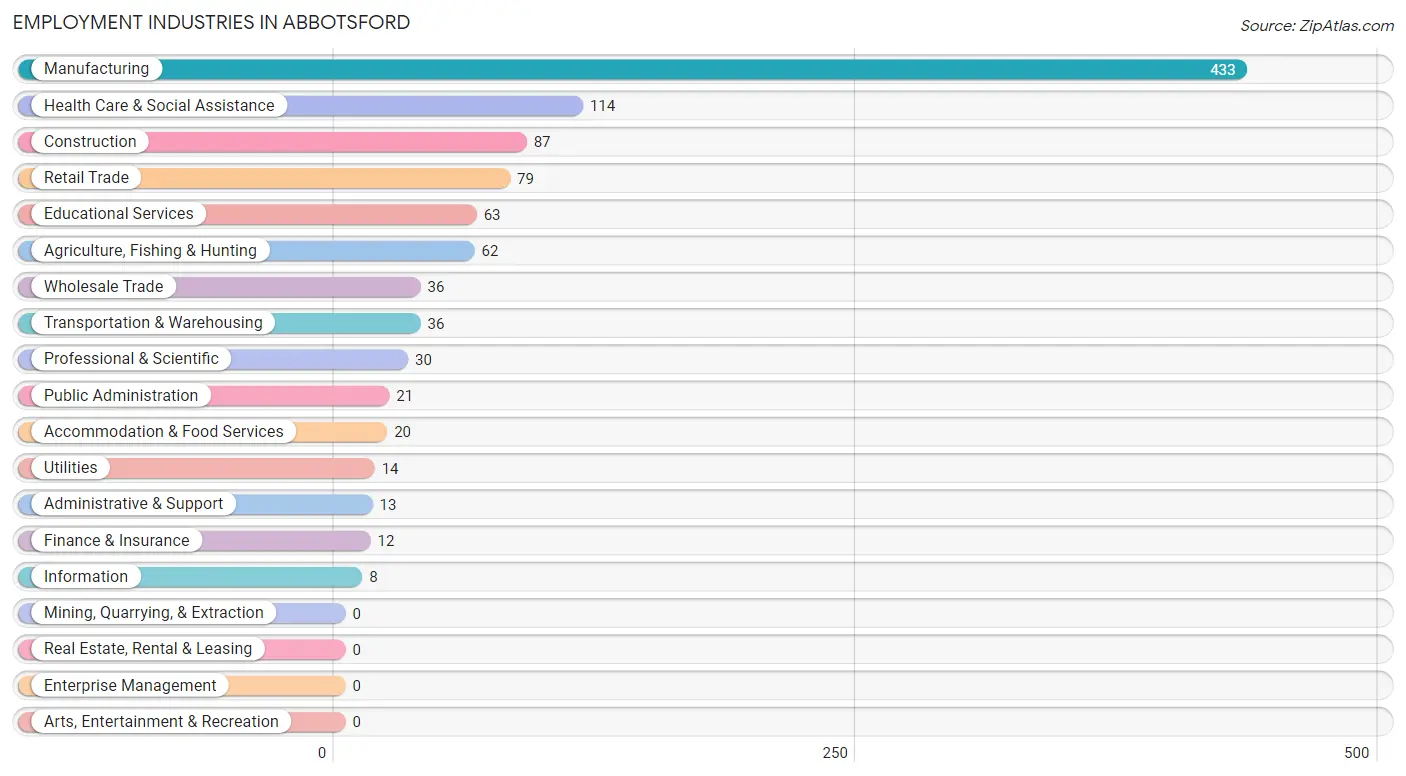
Employment Industries in Abbotsford
The major employment industries in Abbotsford include Manufacturing (433 | 40.9%), Health Care & Social Assistance (114 | 10.8%), Construction (87 | 8.2%), Retail Trade (79 | 7.5%), and Educational Services (63 | 5.9%).
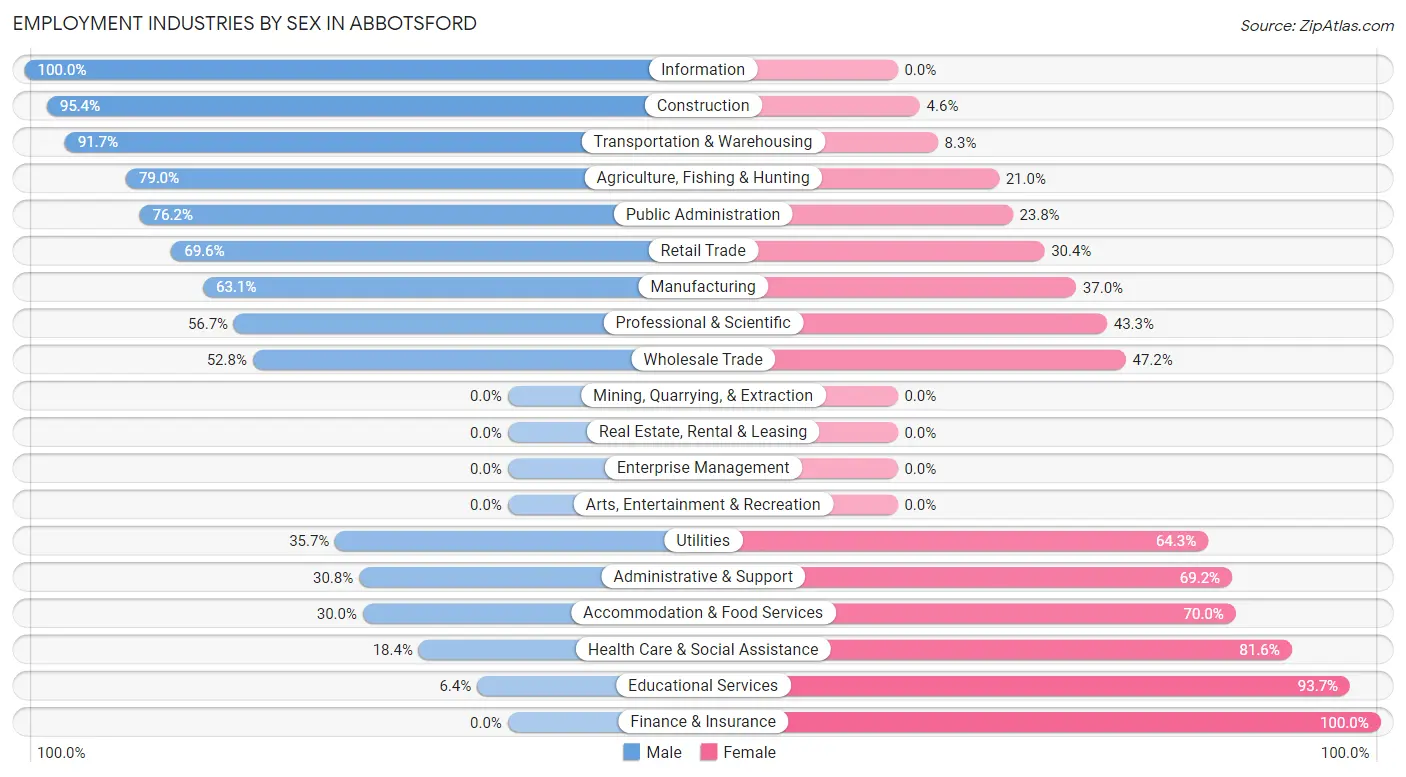
Employment Industries by Sex in Abbotsford
The Abbotsford industries that see more men than women are Information (100.0%), Construction (95.4%), and Transportation & Warehousing (91.7%), whereas the industries that tend to have a higher number of women are Finance & Insurance (100.0%), Educational Services (93.6%), and Health Care & Social Assistance (81.6%).
| Industry | Male | Female |
| Agriculture, Fishing & Hunting | 49 (79.0%) | 13 (21.0%) |
| Mining, Quarrying, & Extraction | 0 (0.0%) | 0 (0.0%) |
| Construction | 83 (95.4%) | 4 (4.6%) |
| Manufacturing | 273 (63.0%) | 160 (36.9%) |
| Wholesale Trade | 19 (52.8%) | 17 (47.2%) |
| Retail Trade | 55 (69.6%) | 24 (30.4%) |
| Transportation & Warehousing | 33 (91.7%) | 3 (8.3%) |
| Utilities | 5 (35.7%) | 9 (64.3%) |
| Information | 8 (100.0%) | 0 (0.0%) |
| Finance & Insurance | 0 (0.0%) | 12 (100.0%) |
| Real Estate, Rental & Leasing | 0 (0.0%) | 0 (0.0%) |
| Professional & Scientific | 17 (56.7%) | 13 (43.3%) |
| Enterprise Management | 0 (0.0%) | 0 (0.0%) |
| Administrative & Support | 4 (30.8%) | 9 (69.2%) |
| Educational Services | 4 (6.4%) | 59 (93.6%) |
| Health Care & Social Assistance | 21 (18.4%) | 93 (81.6%) |
| Arts, Entertainment & Recreation | 0 (0.0%) | 0 (0.0%) |
| Accommodation & Food Services | 6 (30.0%) | 14 (70.0%) |
| Public Administration | 16 (76.2%) | 5 (23.8%) |
| Total | 614 (58.0%) | 444 (42.0%) |
Education in Abbotsford
School Enrollment in Abbotsford
The most common levels of schooling among the 600 students in Abbotsford are elementary school (175 | 29.2%), middle school (152 | 25.3%), and high school (150 | 25.0%).
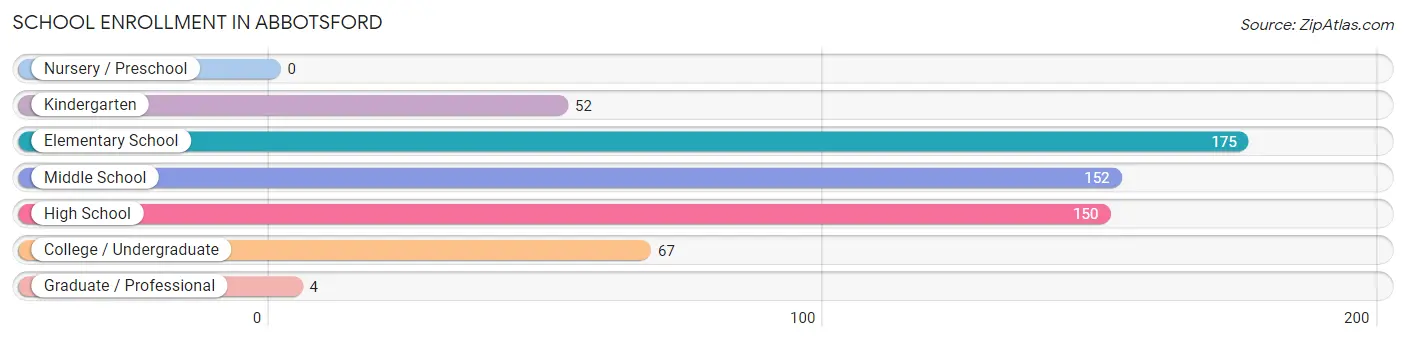
| School Level | # Students | % Students |
| Nursery / Preschool | 0 | 0.0% |
| Kindergarten | 52 | 8.7% |
| Elementary School | 175 | 29.2% |
| Middle School | 152 | 25.3% |
| High School | 150 | 25.0% |
| College / Undergraduate | 67 | 11.2% |
| Graduate / Professional | 4 | 0.7% |
| Total | 600 | 100.0% |
School Enrollment by Age by Funding Source in Abbotsford
Out of a total of 600 students who are enrolled in schools in Abbotsford, 28 (4.7%) attend a private institution, while the remaining 572 (95.3%) are enrolled in public schools. The age group of 3 to 4 year olds has the highest likelihood of being enrolled in private schools, with 10 (100.0% in the age bracket) enrolled. Conversely, the age group of 10 to 14 year olds has the lowest likelihood of being enrolled in a private school, with 172 (100.0% in the age bracket) attending a public institution.
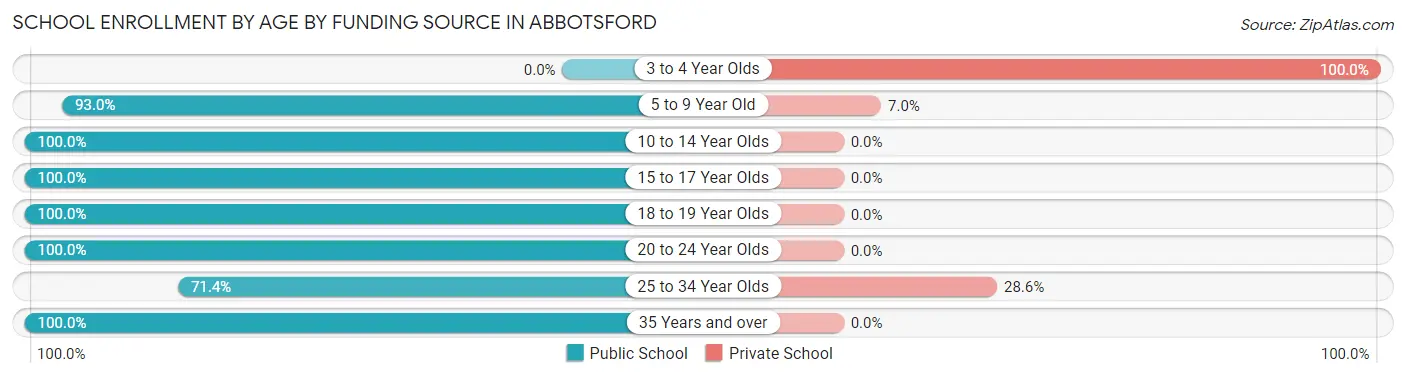
| Age Bracket | Public School | Private School |
| 3 to 4 Year Olds | 0 (0.0%) | 10 (100.0%) |
| 5 to 9 Year Old | 187 (93.0%) | 14 (7.0%) |
| 10 to 14 Year Olds | 172 (100.0%) | 0 (0.0%) |
| 15 to 17 Year Olds | 111 (100.0%) | 0 (0.0%) |
| 18 to 19 Year Olds | 40 (100.0%) | 0 (0.0%) |
| 20 to 24 Year Olds | 22 (100.0%) | 0 (0.0%) |
| 25 to 34 Year Olds | 10 (71.4%) | 4 (28.6%) |
| 35 Years and over | 30 (100.0%) | 0 (0.0%) |
| Total | 572 (95.3%) | 28 (4.7%) |
Educational Attainment by Field of Study in Abbotsford
Business (46 | 32.2%), education (30 | 21.0%), science & technology (17 | 11.9%), bio, nature & agricultural (11 | 7.7%), and psychology (9 | 6.3%) are the most common fields of study among 143 individuals in Abbotsford who have obtained a bachelor's degree or higher.
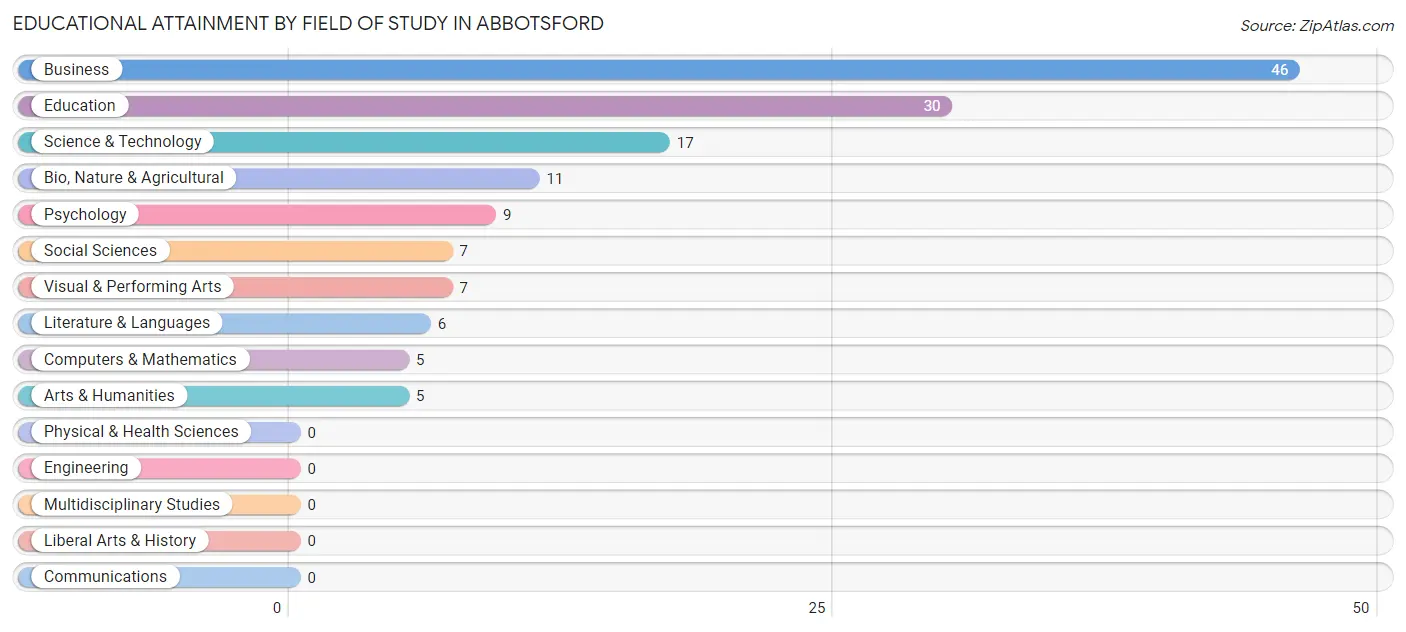
| Field of Study | # Graduates | % Graduates |
| Computers & Mathematics | 5 | 3.5% |
| Bio, Nature & Agricultural | 11 | 7.7% |
| Physical & Health Sciences | 0 | 0.0% |
| Psychology | 9 | 6.3% |
| Social Sciences | 7 | 4.9% |
| Engineering | 0 | 0.0% |
| Multidisciplinary Studies | 0 | 0.0% |
| Science & Technology | 17 | 11.9% |
| Business | 46 | 32.2% |
| Education | 30 | 21.0% |
| Literature & Languages | 6 | 4.2% |
| Liberal Arts & History | 0 | 0.0% |
| Visual & Performing Arts | 7 | 4.9% |
| Communications | 0 | 0.0% |
| Arts & Humanities | 5 | 3.5% |
| Total | 143 | 100.0% |
Transportation & Commute in Abbotsford
Vehicle Availability by Sex in Abbotsford
The most prevalent vehicle ownership categories in Abbotsford are males with 2 vehicles (262, accounting for 42.7%) and females with 2 vehicles (195, making up 59.0%).
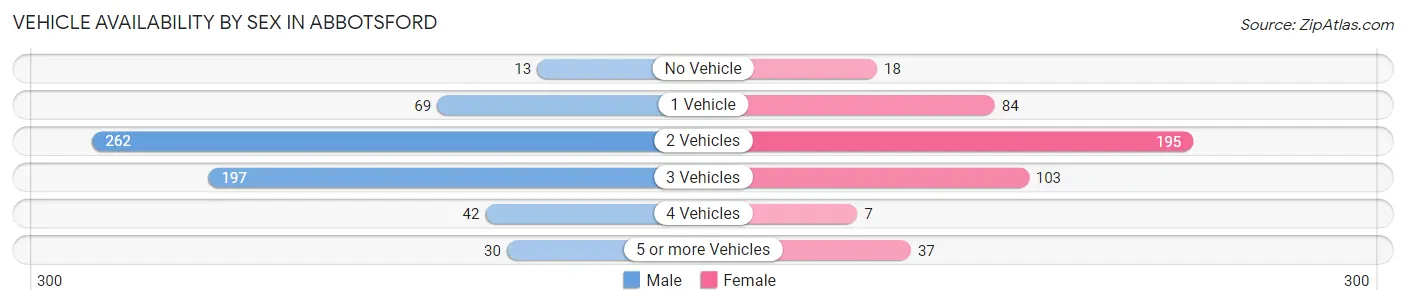
| Vehicles Available | Male | Female |
| No Vehicle | 13 (2.1%) | 18 (4.1%) |
| 1 Vehicle | 69 (11.3%) | 84 (18.9%) |
| 2 Vehicles | 262 (42.7%) | 195 (43.9%) |
| 3 Vehicles | 197 (32.1%) | 103 (23.2%) |
| 4 Vehicles | 42 (6.9%) | 7 (1.6%) |
| 5 or more Vehicles | 30 (4.9%) | 37 (8.3%) |
| Total | 613 (100.0%) | 444 (100.0%) |
Commute Time in Abbotsford
The most frequently occuring commute durations in Abbotsford are 5 to 9 minutes (229 commuters, 22.9%), 10 to 14 minutes (219 commuters, 21.9%), and 20 to 24 minutes (104 commuters, 10.4%).
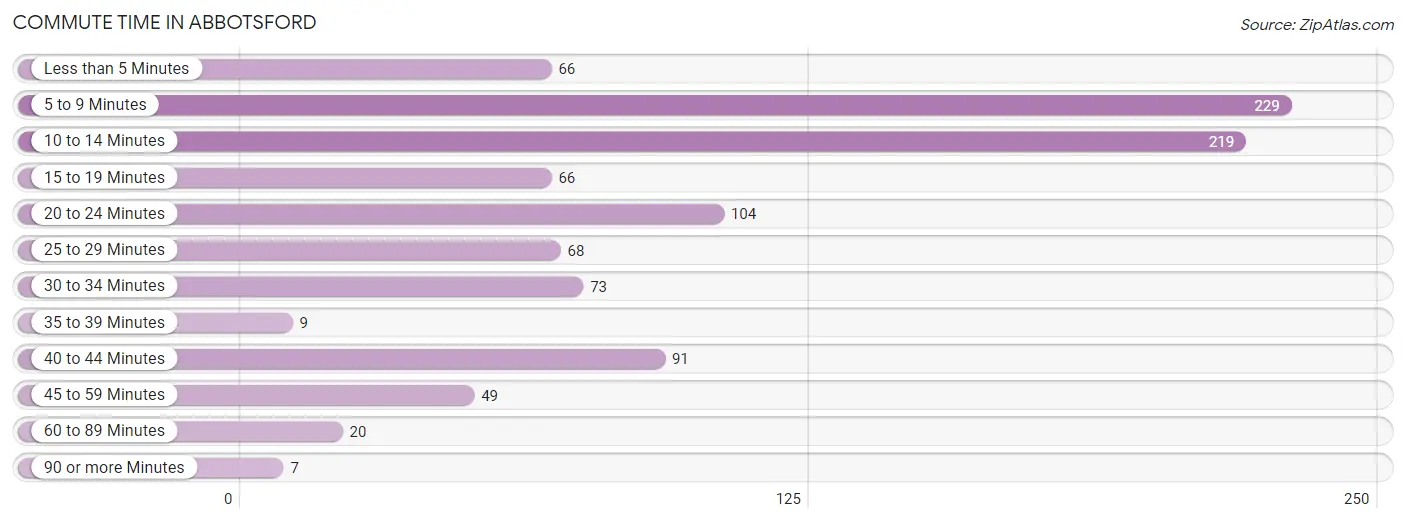
| Commute Time | # Commuters | % Commuters |
| Less than 5 Minutes | 66 | 6.6% |
| 5 to 9 Minutes | 229 | 22.9% |
| 10 to 14 Minutes | 219 | 21.9% |
| 15 to 19 Minutes | 66 | 6.6% |
| 20 to 24 Minutes | 104 | 10.4% |
| 25 to 29 Minutes | 68 | 6.8% |
| 30 to 34 Minutes | 73 | 7.3% |
| 35 to 39 Minutes | 9 | 0.9% |
| 40 to 44 Minutes | 91 | 9.1% |
| 45 to 59 Minutes | 49 | 4.9% |
| 60 to 89 Minutes | 20 | 2.0% |
| 90 or more Minutes | 7 | 0.7% |
Commute Time by Sex in Abbotsford
The most common commute times in Abbotsford are 10 to 14 minutes (145 commuters, 24.4%) for males and 5 to 9 minutes (101 commuters, 24.9%) for females.
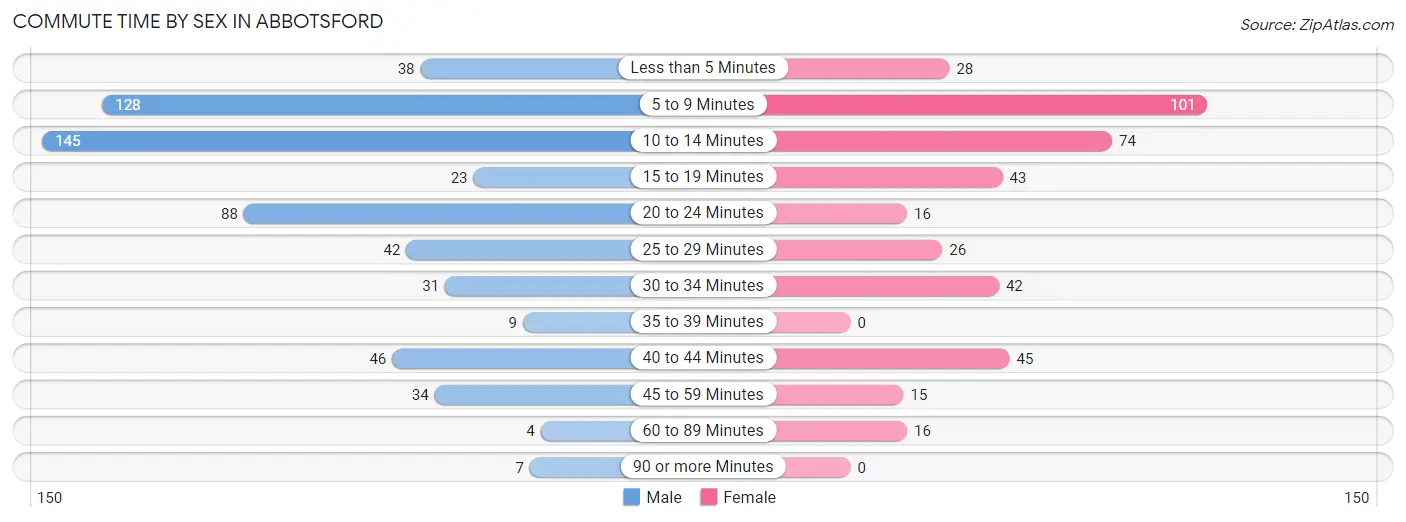
| Commute Time | Male | Female |
| Less than 5 Minutes | 38 (6.4%) | 28 (6.9%) |
| 5 to 9 Minutes | 128 (21.5%) | 101 (24.9%) |
| 10 to 14 Minutes | 145 (24.4%) | 74 (18.2%) |
| 15 to 19 Minutes | 23 (3.9%) | 43 (10.6%) |
| 20 to 24 Minutes | 88 (14.8%) | 16 (3.9%) |
| 25 to 29 Minutes | 42 (7.1%) | 26 (6.4%) |
| 30 to 34 Minutes | 31 (5.2%) | 42 (10.3%) |
| 35 to 39 Minutes | 9 (1.5%) | 0 (0.0%) |
| 40 to 44 Minutes | 46 (7.7%) | 45 (11.1%) |
| 45 to 59 Minutes | 34 (5.7%) | 15 (3.7%) |
| 60 to 89 Minutes | 4 (0.7%) | 16 (3.9%) |
| 90 or more Minutes | 7 (1.2%) | 0 (0.0%) |
Time of Departure to Work by Sex in Abbotsford
The most frequent times of departure to work in Abbotsford are 5:00 AM to 5:29 AM (129, 21.7%) for males and 12:00 AM to 4:59 AM (67, 16.5%) for females.
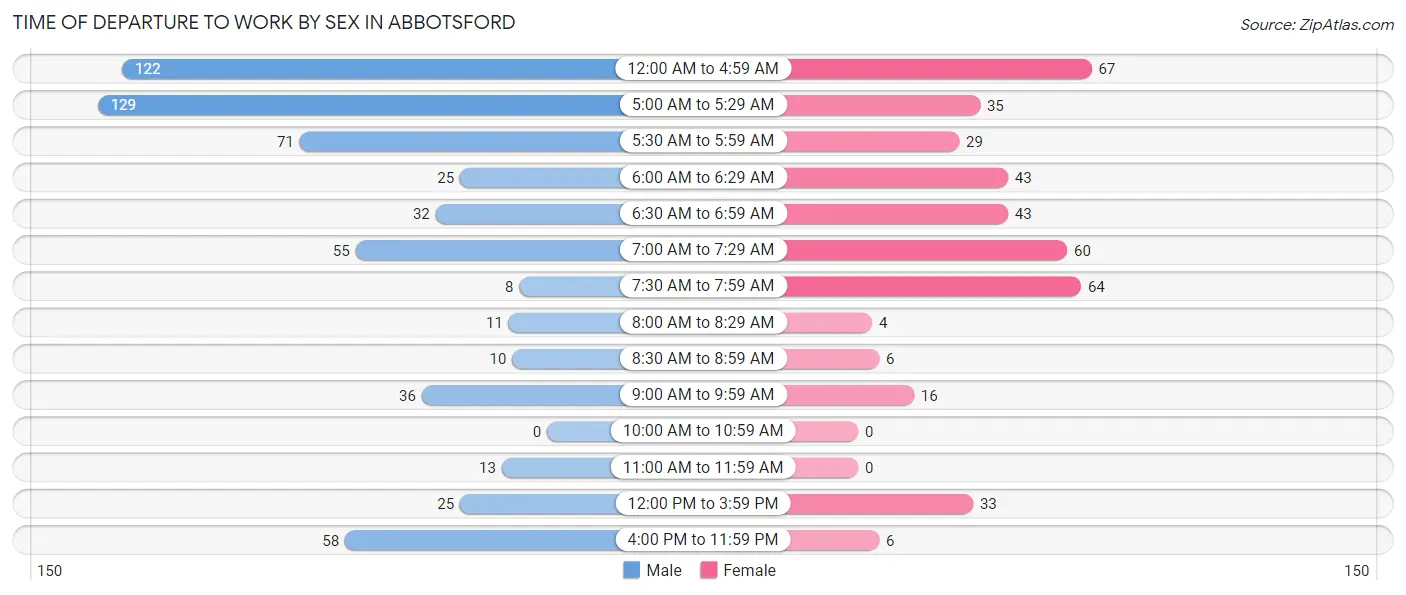
| Time of Departure | Male | Female |
| 12:00 AM to 4:59 AM | 122 (20.5%) | 67 (16.5%) |
| 5:00 AM to 5:29 AM | 129 (21.7%) | 35 (8.6%) |
| 5:30 AM to 5:59 AM | 71 (11.9%) | 29 (7.1%) |
| 6:00 AM to 6:29 AM | 25 (4.2%) | 43 (10.6%) |
| 6:30 AM to 6:59 AM | 32 (5.4%) | 43 (10.6%) |
| 7:00 AM to 7:29 AM | 55 (9.2%) | 60 (14.8%) |
| 7:30 AM to 7:59 AM | 8 (1.3%) | 64 (15.8%) |
| 8:00 AM to 8:29 AM | 11 (1.8%) | 4 (1.0%) |
| 8:30 AM to 8:59 AM | 10 (1.7%) | 6 (1.5%) |
| 9:00 AM to 9:59 AM | 36 (6.0%) | 16 (3.9%) |
| 10:00 AM to 10:59 AM | 0 (0.0%) | 0 (0.0%) |
| 11:00 AM to 11:59 AM | 13 (2.2%) | 0 (0.0%) |
| 12:00 PM to 3:59 PM | 25 (4.2%) | 33 (8.1%) |
| 4:00 PM to 11:59 PM | 58 (9.8%) | 6 (1.5%) |
| Total | 595 (100.0%) | 406 (100.0%) |
Housing Occupancy in Abbotsford
Occupancy by Ownership in Abbotsford
Of the total 778 dwellings in Abbotsford, owner-occupied units account for 488 (62.7%), while renter-occupied units make up 290 (37.3%).
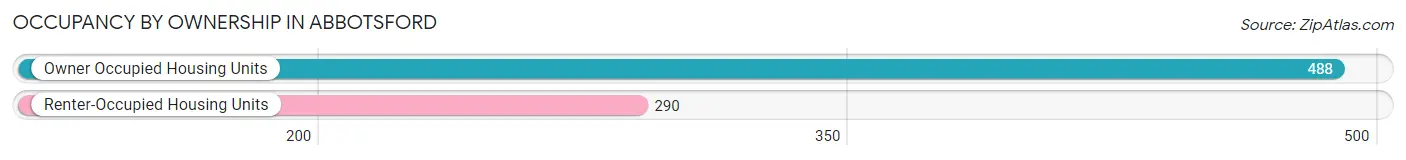
| Occupancy | # Housing Units | % Housing Units |
| Owner Occupied Housing Units | 488 | 62.7% |
| Renter-Occupied Housing Units | 290 | 37.3% |
| Total Occupied Housing Units | 778 | 100.0% |
Occupancy by Household Size in Abbotsford
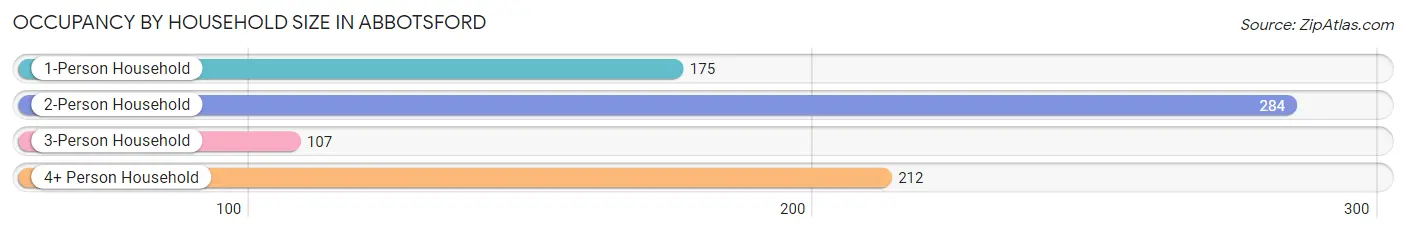
| Household Size | # Housing Units | % Housing Units |
| 1-Person Household | 175 | 22.5% |
| 2-Person Household | 284 | 36.5% |
| 3-Person Household | 107 | 13.8% |
| 4+ Person Household | 212 | 27.3% |
| Total Housing Units | 778 | 100.0% |
Occupancy by Ownership by Household Size in Abbotsford
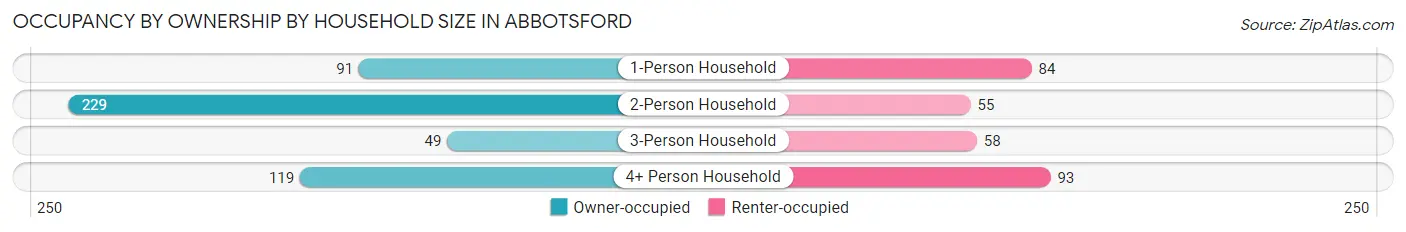
| Household Size | Owner-occupied | Renter-occupied |
| 1-Person Household | 91 (52.0%) | 84 (48.0%) |
| 2-Person Household | 229 (80.6%) | 55 (19.4%) |
| 3-Person Household | 49 (45.8%) | 58 (54.2%) |
| 4+ Person Household | 119 (56.1%) | 93 (43.9%) |
| Total Housing Units | 488 (62.7%) | 290 (37.3%) |
Occupancy by Educational Attainment in Abbotsford
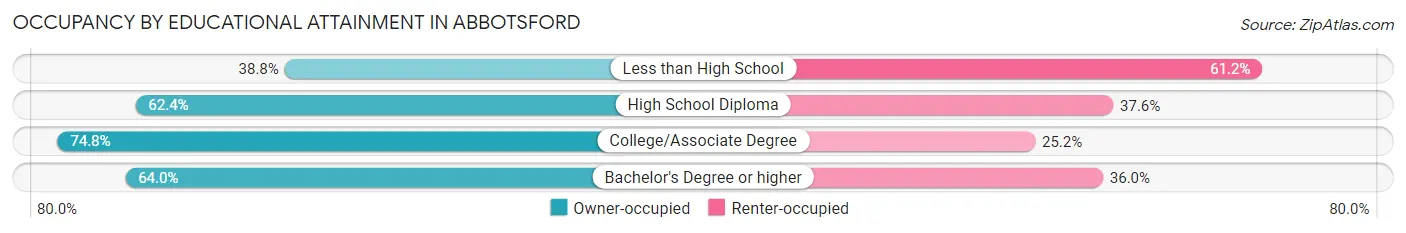
| Household Size | Owner-occupied | Renter-occupied |
| Less than High School | 50 (38.8%) | 79 (61.2%) |
| High School Diploma | 191 (62.4%) | 115 (37.6%) |
| College/Associate Degree | 190 (74.8%) | 64 (25.2%) |
| Bachelor's Degree or higher | 57 (64.0%) | 32 (36.0%) |
Occupancy by Age of Householder in Abbotsford
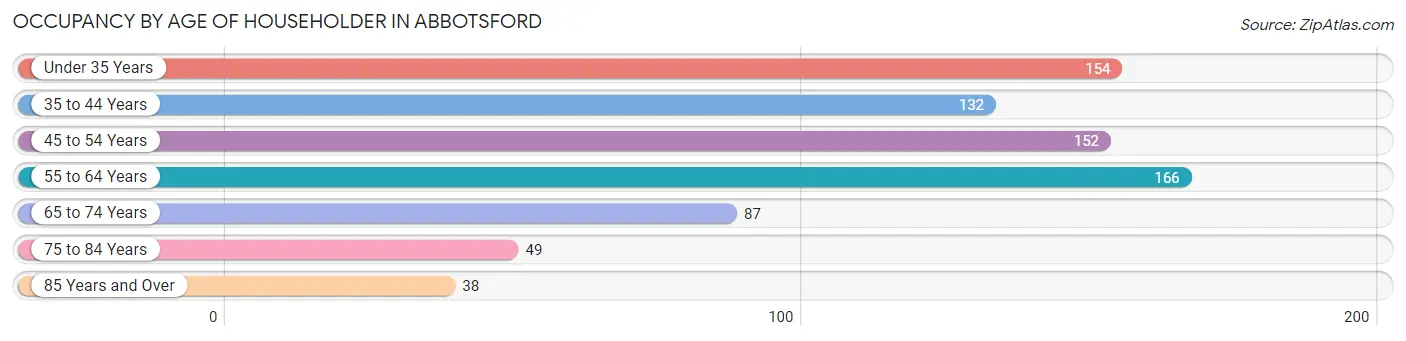
| Age Bracket | # Households | % Households |
| Under 35 Years | 154 | 19.8% |
| 35 to 44 Years | 132 | 17.0% |
| 45 to 54 Years | 152 | 19.5% |
| 55 to 64 Years | 166 | 21.3% |
| 65 to 74 Years | 87 | 11.2% |
| 75 to 84 Years | 49 | 6.3% |
| 85 Years and Over | 38 | 4.9% |
| Total | 778 | 100.0% |
Housing Finances in Abbotsford
Median Income by Occupancy in Abbotsford
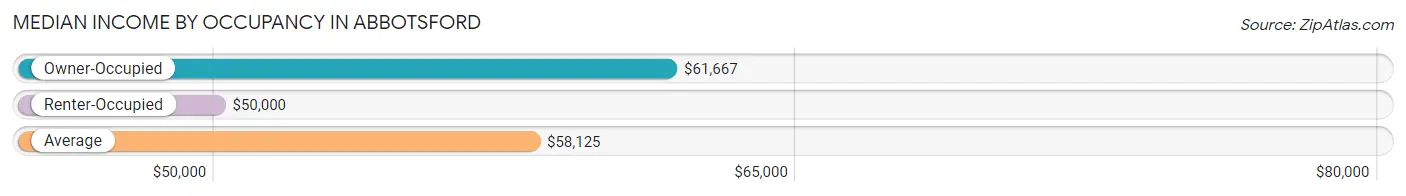
| Occupancy Type | # Households | Median Income |
| Owner-Occupied | 488 (62.7%) | $61,667 |
| Renter-Occupied | 290 (37.3%) | $50,000 |
| Average | 778 (100.0%) | $58,125 |
Occupancy by Householder Income Bracket in Abbotsford
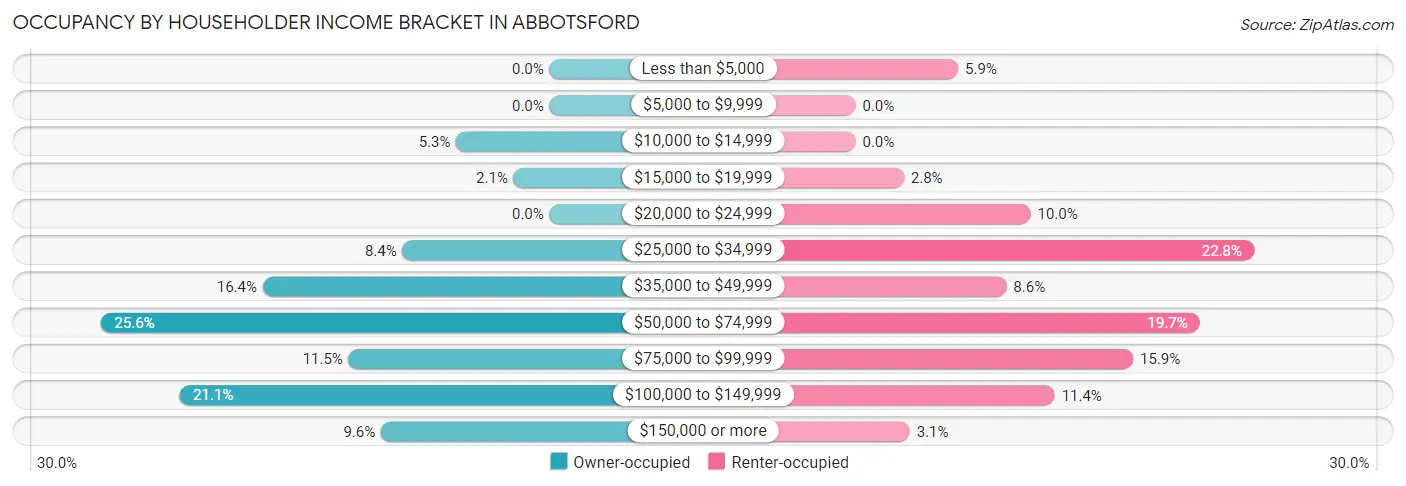
| Income Bracket | Owner-occupied | Renter-occupied |
| Less than $5,000 | 0 (0.0%) | 17 (5.9%) |
| $5,000 to $9,999 | 0 (0.0%) | 0 (0.0%) |
| $10,000 to $14,999 | 26 (5.3%) | 0 (0.0%) |
| $15,000 to $19,999 | 10 (2.1%) | 8 (2.8%) |
| $20,000 to $24,999 | 0 (0.0%) | 29 (10.0%) |
| $25,000 to $34,999 | 41 (8.4%) | 66 (22.8%) |
| $35,000 to $49,999 | 80 (16.4%) | 25 (8.6%) |
| $50,000 to $74,999 | 125 (25.6%) | 57 (19.7%) |
| $75,000 to $99,999 | 56 (11.5%) | 46 (15.9%) |
| $100,000 to $149,999 | 103 (21.1%) | 33 (11.4%) |
| $150,000 or more | 47 (9.6%) | 9 (3.1%) |
| Total | 488 (100.0%) | 290 (100.0%) |
Monthly Housing Cost Tiers in Abbotsford
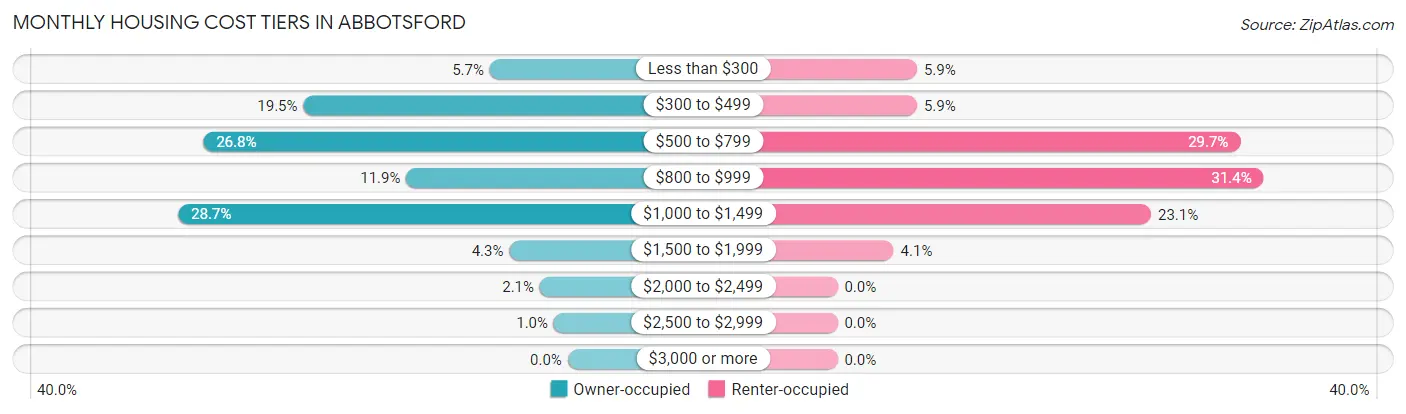
| Monthly Cost | Owner-occupied | Renter-occupied |
| Less than $300 | 28 (5.7%) | 17 (5.9%) |
| $300 to $499 | 95 (19.5%) | 17 (5.9%) |
| $500 to $799 | 131 (26.8%) | 86 (29.7%) |
| $800 to $999 | 58 (11.9%) | 91 (31.4%) |
| $1,000 to $1,499 | 140 (28.7%) | 67 (23.1%) |
| $1,500 to $1,999 | 21 (4.3%) | 12 (4.1%) |
| $2,000 to $2,499 | 10 (2.1%) | 0 (0.0%) |
| $2,500 to $2,999 | 5 (1.0%) | 0 (0.0%) |
| $3,000 or more | 0 (0.0%) | 0 (0.0%) |
| Total | 488 (100.0%) | 290 (100.0%) |
Physical Housing Characteristics in Abbotsford
Housing Structures in Abbotsford
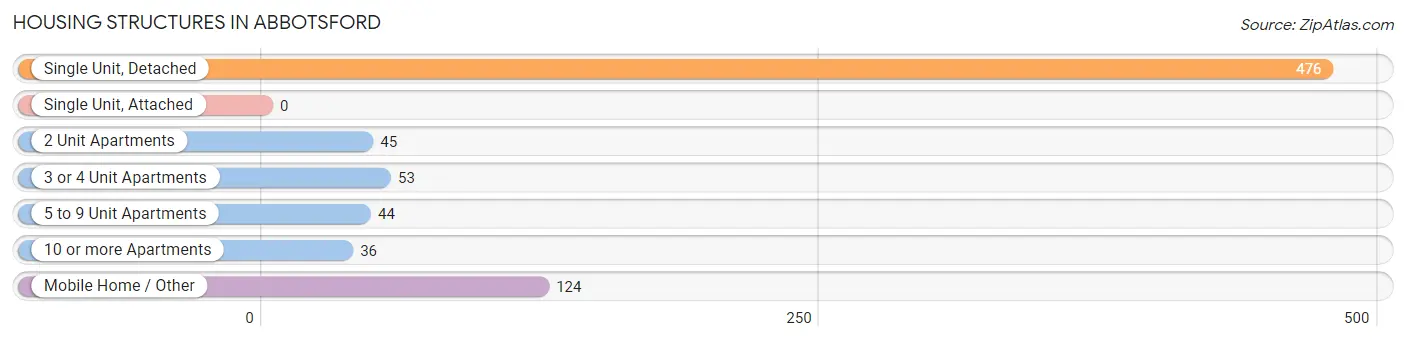
| Structure Type | # Housing Units | % Housing Units |
| Single Unit, Detached | 476 | 61.2% |
| Single Unit, Attached | 0 | 0.0% |
| 2 Unit Apartments | 45 | 5.8% |
| 3 or 4 Unit Apartments | 53 | 6.8% |
| 5 to 9 Unit Apartments | 44 | 5.7% |
| 10 or more Apartments | 36 | 4.6% |
| Mobile Home / Other | 124 | 15.9% |
| Total | 778 | 100.0% |
Housing Structures by Occupancy in Abbotsford
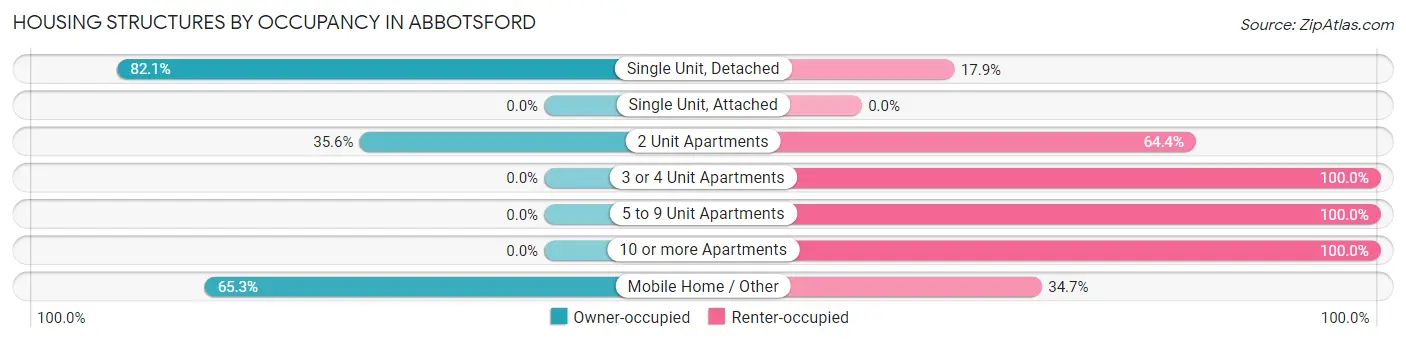
| Structure Type | Owner-occupied | Renter-occupied |
| Single Unit, Detached | 391 (82.1%) | 85 (17.9%) |
| Single Unit, Attached | 0 (0.0%) | 0 (0.0%) |
| 2 Unit Apartments | 16 (35.6%) | 29 (64.4%) |
| 3 or 4 Unit Apartments | 0 (0.0%) | 53 (100.0%) |
| 5 to 9 Unit Apartments | 0 (0.0%) | 44 (100.0%) |
| 10 or more Apartments | 0 (0.0%) | 36 (100.0%) |
| Mobile Home / Other | 81 (65.3%) | 43 (34.7%) |
| Total | 488 (62.7%) | 290 (37.3%) |
Housing Structures by Number of Rooms in Abbotsford
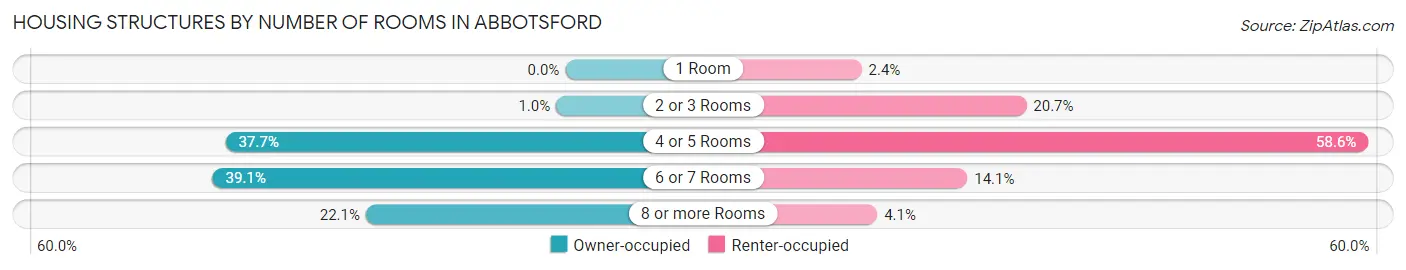
| Number of Rooms | Owner-occupied | Renter-occupied |
| 1 Room | 0 (0.0%) | 7 (2.4%) |
| 2 or 3 Rooms | 5 (1.0%) | 60 (20.7%) |
| 4 or 5 Rooms | 184 (37.7%) | 170 (58.6%) |
| 6 or 7 Rooms | 191 (39.1%) | 41 (14.1%) |
| 8 or more Rooms | 108 (22.1%) | 12 (4.1%) |
| Total | 488 (100.0%) | 290 (100.0%) |
Housing Structure by Heating Type in Abbotsford
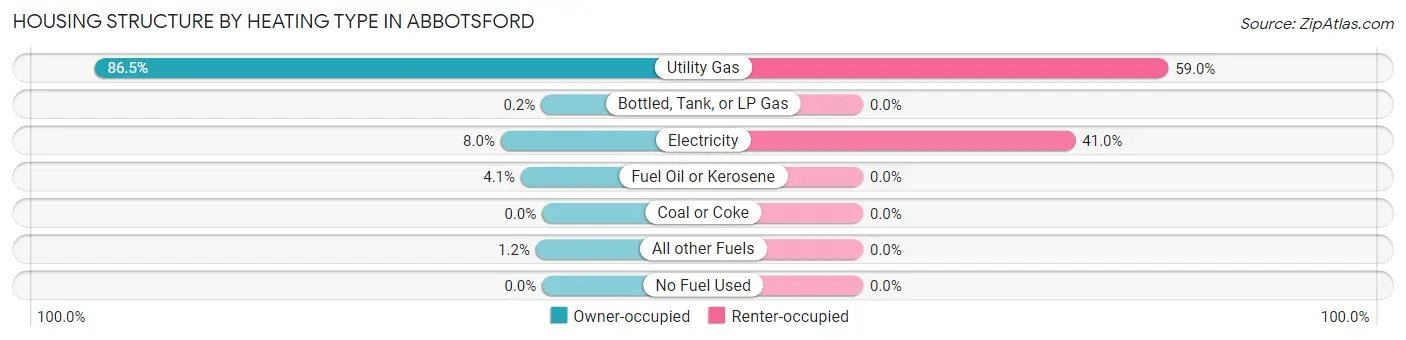
| Heating Type | Owner-occupied | Renter-occupied |
| Utility Gas | 422 (86.5%) | 171 (59.0%) |
| Bottled, Tank, or LP Gas | 1 (0.2%) | 0 (0.0%) |
| Electricity | 39 (8.0%) | 119 (41.0%) |
| Fuel Oil or Kerosene | 20 (4.1%) | 0 (0.0%) |
| Coal or Coke | 0 (0.0%) | 0 (0.0%) |
| All other Fuels | 6 (1.2%) | 0 (0.0%) |
| No Fuel Used | 0 (0.0%) | 0 (0.0%) |
| Total | 488 (100.0%) | 290 (100.0%) |
Household Vehicle Usage in Abbotsford
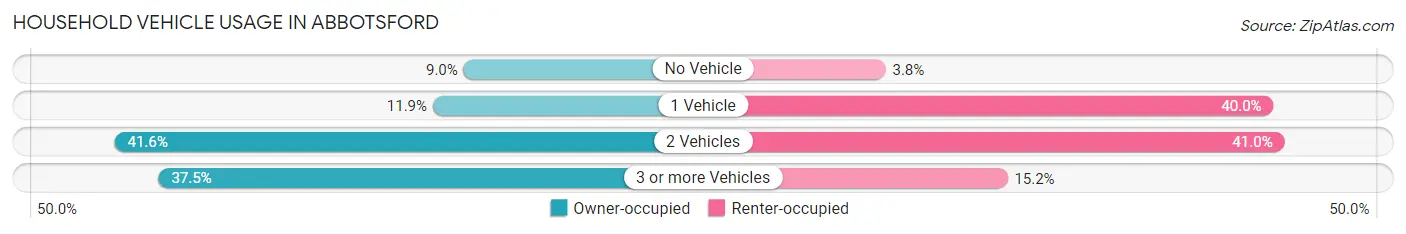
| Vehicles per Household | Owner-occupied | Renter-occupied |
| No Vehicle | 44 (9.0%) | 11 (3.8%) |
| 1 Vehicle | 58 (11.9%) | 116 (40.0%) |
| 2 Vehicles | 203 (41.6%) | 119 (41.0%) |
| 3 or more Vehicles | 183 (37.5%) | 44 (15.2%) |
| Total | 488 (100.0%) | 290 (100.0%) |
Real Estate & Mortgages in Abbotsford
Real Estate and Mortgage Overview in Abbotsford
| Characteristic | Without Mortgage | With Mortgage |
| Housing Units | 248 | 240 |
| Median Property Value | $105,800 | $138,900 |
| Median Household Income | $52,188 | $30 |
| Monthly Housing Costs | $547 | $0 |
| Real Estate Taxes | $2,414 | $20 |
Property Value by Mortgage Status in Abbotsford
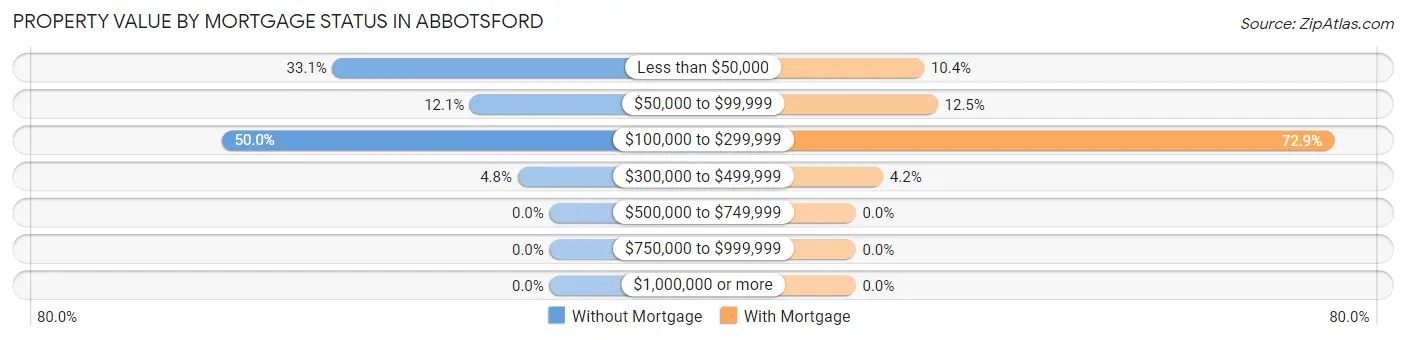
| Property Value | Without Mortgage | With Mortgage |
| Less than $50,000 | 82 (33.1%) | 25 (10.4%) |
| $50,000 to $99,999 | 30 (12.1%) | 30 (12.5%) |
| $100,000 to $299,999 | 124 (50.0%) | 175 (72.9%) |
| $300,000 to $499,999 | 12 (4.8%) | 10 (4.2%) |
| $500,000 to $749,999 | 0 (0.0%) | 0 (0.0%) |
| $750,000 to $999,999 | 0 (0.0%) | 0 (0.0%) |
| $1,000,000 or more | 0 (0.0%) | 0 (0.0%) |
| Total | 248 (100.0%) | 240 (100.0%) |
Household Income by Mortgage Status in Abbotsford
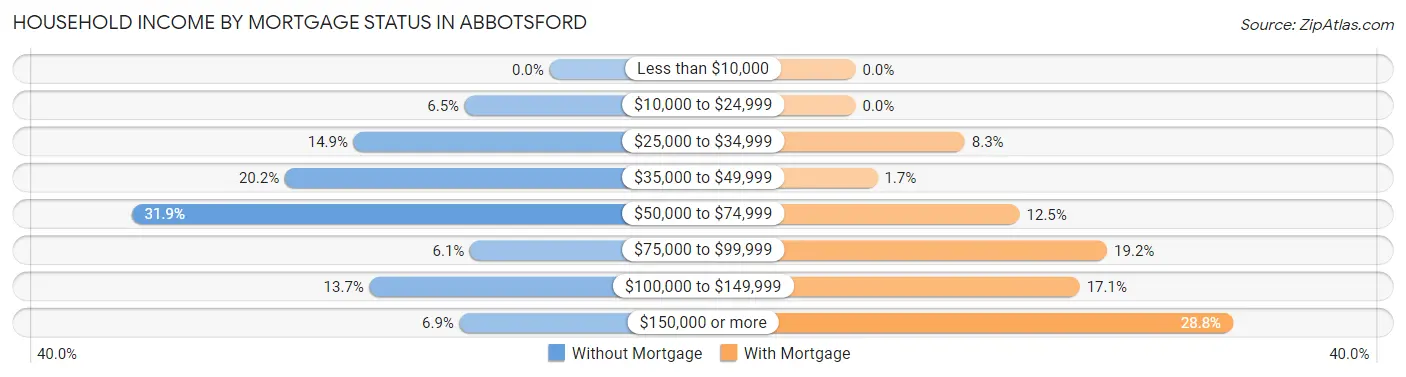
| Household Income | Without Mortgage | With Mortgage |
| Less than $10,000 | 0 (0.0%) | 0 (0.0%) |
| $10,000 to $24,999 | 16 (6.5%) | 0 (0.0%) |
| $25,000 to $34,999 | 37 (14.9%) | 20 (8.3%) |
| $35,000 to $49,999 | 50 (20.2%) | 4 (1.7%) |
| $50,000 to $74,999 | 79 (31.9%) | 30 (12.5%) |
| $75,000 to $99,999 | 15 (6.0%) | 46 (19.2%) |
| $100,000 to $149,999 | 34 (13.7%) | 41 (17.1%) |
| $150,000 or more | 17 (6.9%) | 69 (28.7%) |
| Total | 248 (100.0%) | 240 (100.0%) |
Property Value to Household Income Ratio in Abbotsford
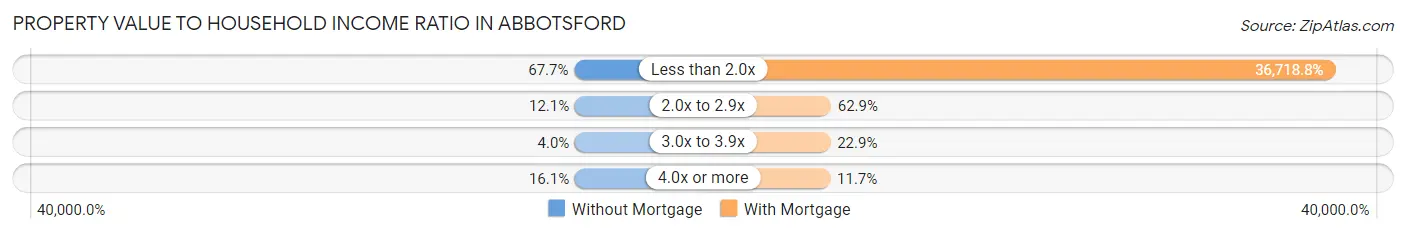
| Value-to-Income Ratio | Without Mortgage | With Mortgage |
| Less than 2.0x | 168 (67.7%) | 88,125 (36,718.8%) |
| 2.0x to 2.9x | 30 (12.1%) | 151 (62.9%) |
| 3.0x to 3.9x | 10 (4.0%) | 55 (22.9%) |
| 4.0x or more | 40 (16.1%) | 28 (11.7%) |
| Total | 248 (100.0%) | 240 (100.0%) |
Real Estate Taxes by Mortgage Status in Abbotsford
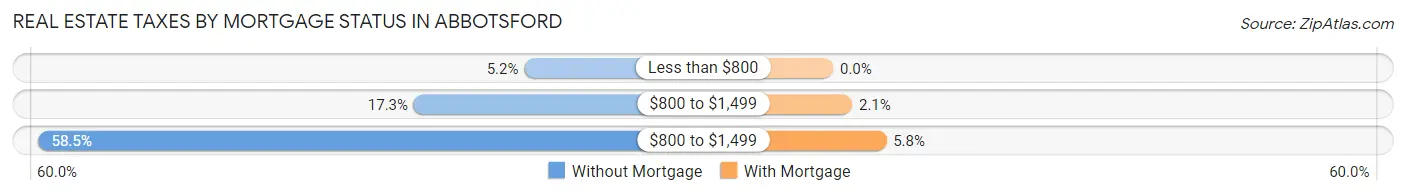
| Property Taxes | Without Mortgage | With Mortgage |
| Less than $800 | 13 (5.2%) | 0 (0.0%) |
| $800 to $1,499 | 43 (17.3%) | 5 (2.1%) |
| $800 to $1,499 | 145 (58.5%) | 14 (5.8%) |
| Total | 248 (100.0%) | 240 (100.0%) |
Health & Disability in Abbotsford
Health Insurance Coverage by Age in Abbotsford
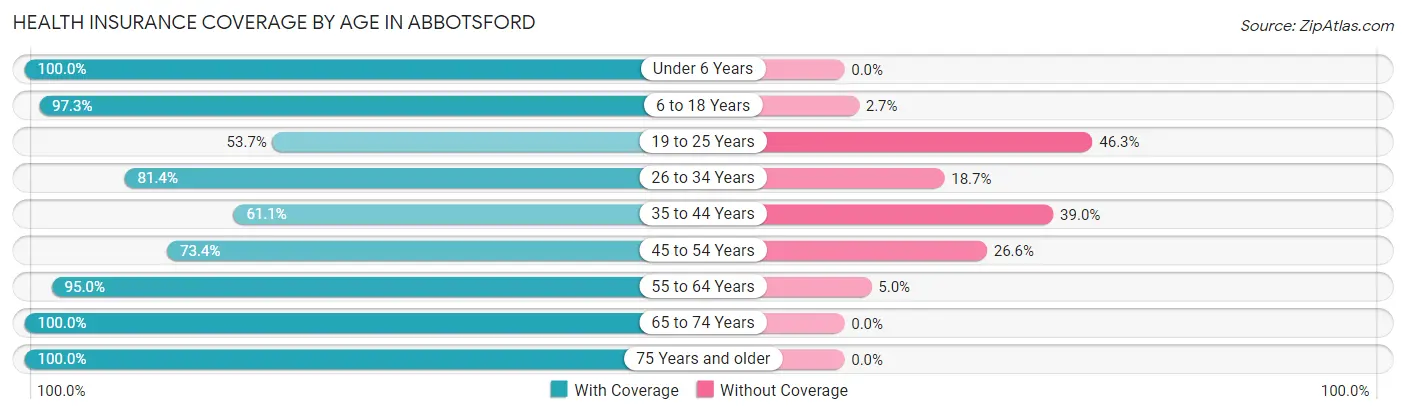
| Age Bracket | With Coverage | Without Coverage |
| Under 6 Years | 164 (100.0%) | 0 (0.0%) |
| 6 to 18 Years | 468 (97.3%) | 13 (2.7%) |
| 19 to 25 Years | 115 (53.7%) | 99 (46.3%) |
| 26 to 34 Years | 157 (81.4%) | 36 (18.6%) |
| 35 to 44 Years | 174 (61.1%) | 111 (39.0%) |
| 45 to 54 Years | 210 (73.4%) | 76 (26.6%) |
| 55 to 64 Years | 245 (95.0%) | 13 (5.0%) |
| 65 to 74 Years | 130 (100.0%) | 0 (0.0%) |
| 75 Years and older | 103 (100.0%) | 0 (0.0%) |
| Total | 1,766 (83.5%) | 348 (16.5%) |
Health Insurance Coverage by Citizenship Status in Abbotsford
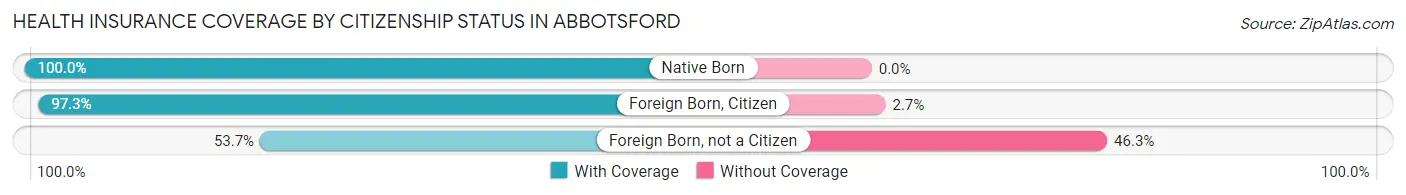
| Citizenship Status | With Coverage | Without Coverage |
| Native Born | 164 (100.0%) | 0 (0.0%) |
| Foreign Born, Citizen | 468 (97.3%) | 13 (2.7%) |
| Foreign Born, not a Citizen | 115 (53.7%) | 99 (46.3%) |
Health Insurance Coverage by Household Income in Abbotsford
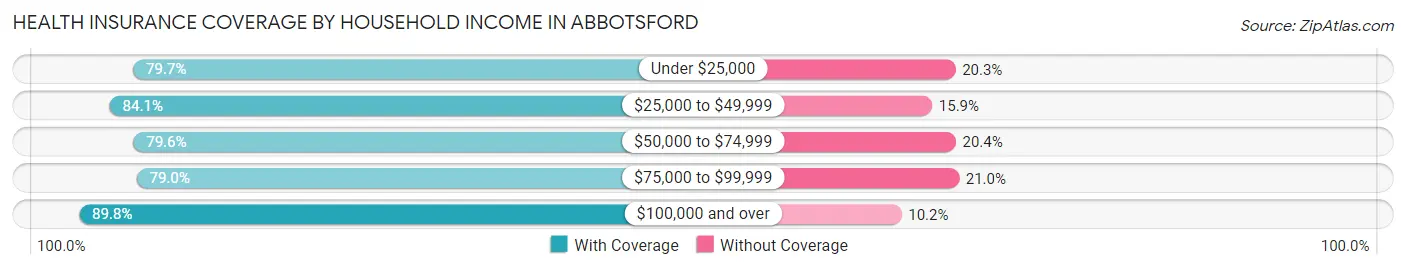
| Household Income | With Coverage | Without Coverage |
| Under $25,000 | 102 (79.7%) | 26 (20.3%) |
| $25,000 to $49,999 | 422 (84.1%) | 80 (15.9%) |
| $50,000 to $74,999 | 383 (79.6%) | 98 (20.4%) |
| $75,000 to $99,999 | 305 (79.0%) | 81 (21.0%) |
| $100,000 and over | 554 (89.8%) | 63 (10.2%) |
Public vs Private Health Insurance Coverage by Age in Abbotsford
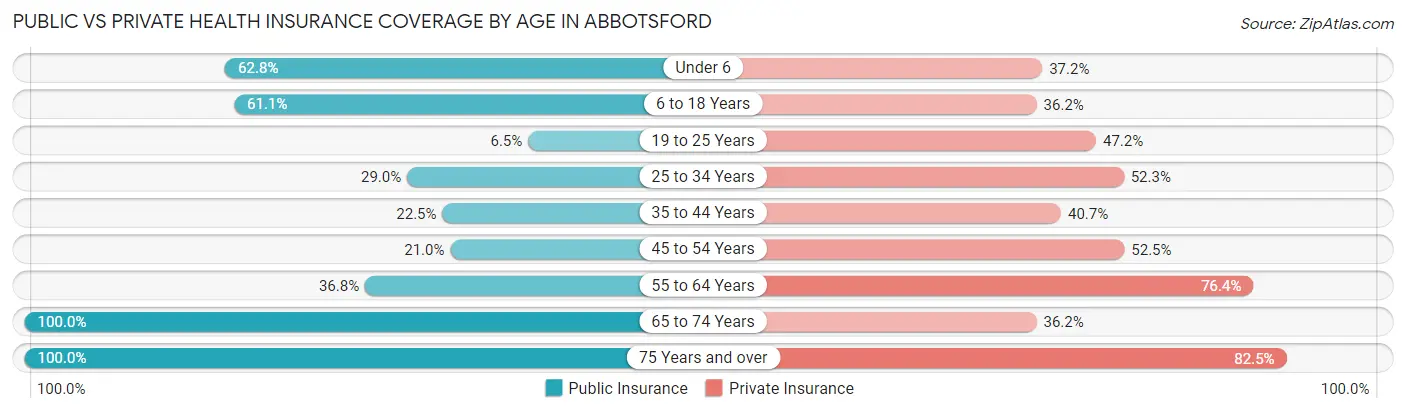
| Age Bracket | Public Insurance | Private Insurance |
| Under 6 | 103 (62.8%) | 61 (37.2%) |
| 6 to 18 Years | 294 (61.1%) | 174 (36.2%) |
| 19 to 25 Years | 14 (6.5%) | 101 (47.2%) |
| 25 to 34 Years | 56 (29.0%) | 101 (52.3%) |
| 35 to 44 Years | 64 (22.5%) | 116 (40.7%) |
| 45 to 54 Years | 60 (21.0%) | 150 (52.4%) |
| 55 to 64 Years | 95 (36.8%) | 197 (76.4%) |
| 65 to 74 Years | 130 (100.0%) | 47 (36.1%) |
| 75 Years and over | 103 (100.0%) | 85 (82.5%) |
| Total | 919 (43.5%) | 1,032 (48.8%) |
Disability Status by Sex by Age in Abbotsford
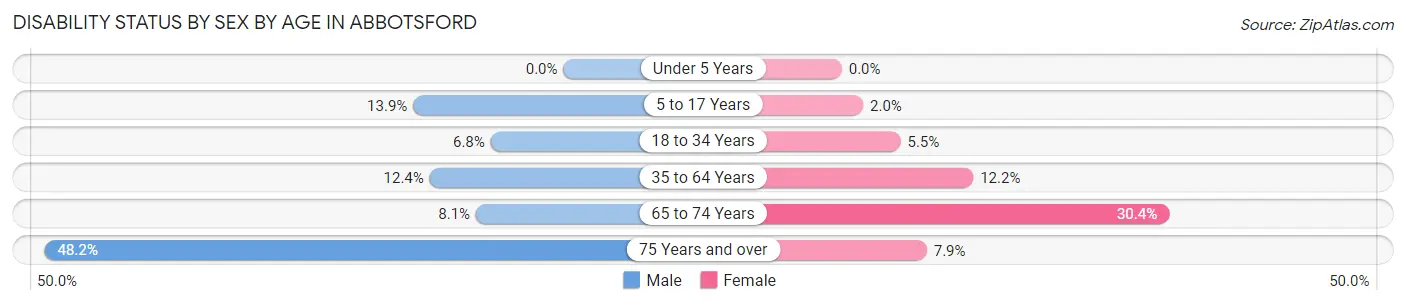
| Age Bracket | Male | Female |
| Under 5 Years | 0 (0.0%) | 0 (0.0%) |
| 5 to 17 Years | 40 (13.9%) | 4 (2.0%) |
| 18 to 34 Years | 16 (6.8%) | 11 (5.4%) |
| 35 to 64 Years | 52 (12.4%) | 50 (12.2%) |
| 65 to 74 Years | 6 (8.1%) | 17 (30.4%) |
| 75 Years and over | 13 (48.1%) | 6 (7.9%) |
Disability Class by Sex by Age in Abbotsford
Disability Class: Hearing Difficulty
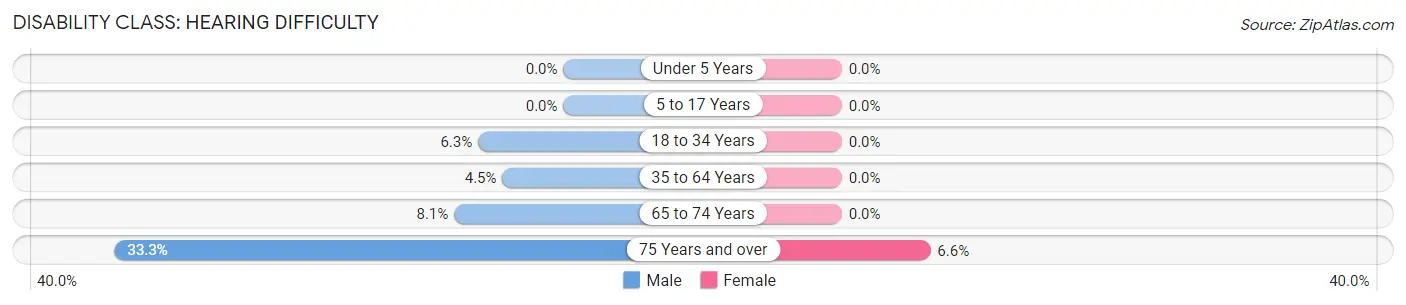
| Age Bracket | Male | Female |
| Under 5 Years | 0 (0.0%) | 0 (0.0%) |
| 5 to 17 Years | 0 (0.0%) | 0 (0.0%) |
| 18 to 34 Years | 15 (6.3%) | 0 (0.0%) |
| 35 to 64 Years | 19 (4.5%) | 0 (0.0%) |
| 65 to 74 Years | 6 (8.1%) | 0 (0.0%) |
| 75 Years and over | 9 (33.3%) | 5 (6.6%) |
Disability Class: Vision Difficulty
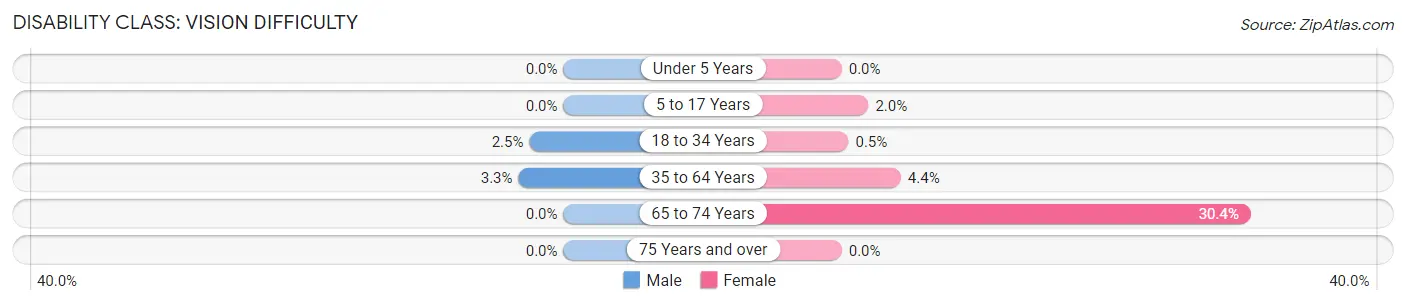
| Age Bracket | Male | Female |
| Under 5 Years | 0 (0.0%) | 0 (0.0%) |
| 5 to 17 Years | 0 (0.0%) | 4 (2.0%) |
| 18 to 34 Years | 6 (2.5%) | 1 (0.5%) |
| 35 to 64 Years | 14 (3.3%) | 18 (4.4%) |
| 65 to 74 Years | 0 (0.0%) | 17 (30.4%) |
| 75 Years and over | 0 (0.0%) | 0 (0.0%) |
Disability Class: Cognitive Difficulty
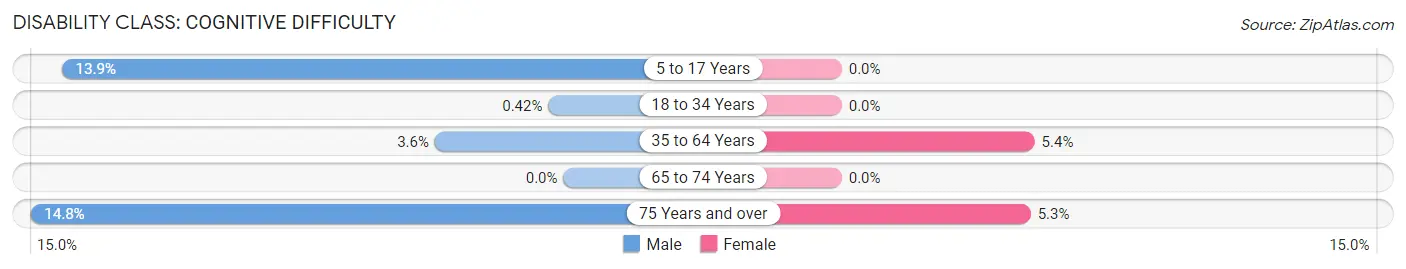
| Age Bracket | Male | Female |
| 5 to 17 Years | 40 (13.9%) | 0 (0.0%) |
| 18 to 34 Years | 1 (0.4%) | 0 (0.0%) |
| 35 to 64 Years | 15 (3.6%) | 22 (5.4%) |
| 65 to 74 Years | 0 (0.0%) | 0 (0.0%) |
| 75 Years and over | 4 (14.8%) | 4 (5.3%) |
Disability Class: Ambulatory Difficulty
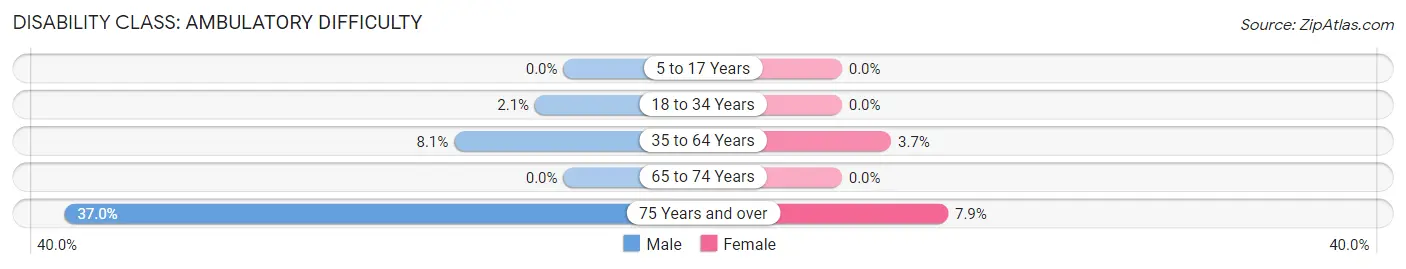
| Age Bracket | Male | Female |
| 5 to 17 Years | 0 (0.0%) | 0 (0.0%) |
| 18 to 34 Years | 5 (2.1%) | 0 (0.0%) |
| 35 to 64 Years | 34 (8.1%) | 15 (3.7%) |
| 65 to 74 Years | 0 (0.0%) | 0 (0.0%) |
| 75 Years and over | 10 (37.0%) | 6 (7.9%) |
Disability Class: Self-Care Difficulty
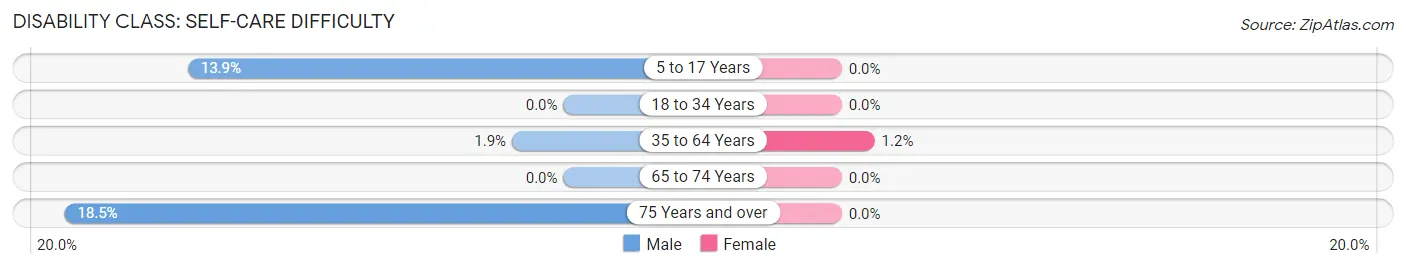
| Age Bracket | Male | Female |
| 5 to 17 Years | 40 (13.9%) | 0 (0.0%) |
| 18 to 34 Years | 0 (0.0%) | 0 (0.0%) |
| 35 to 64 Years | 8 (1.9%) | 5 (1.2%) |
| 65 to 74 Years | 0 (0.0%) | 0 (0.0%) |
| 75 Years and over | 5 (18.5%) | 0 (0.0%) |
Technology Access in Abbotsford
Computing Device Access in Abbotsford
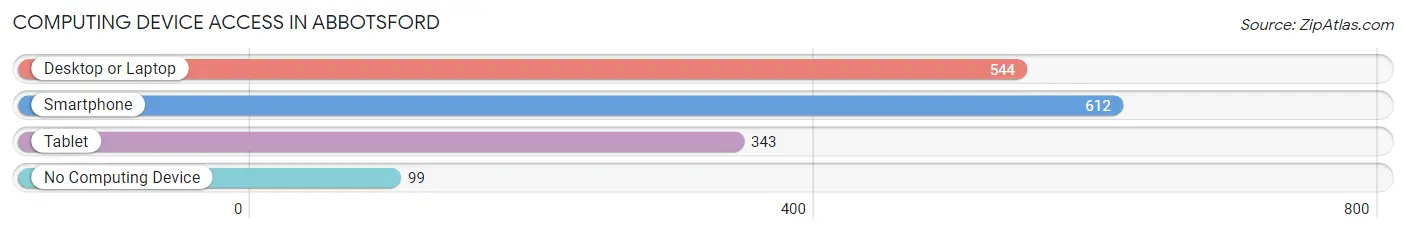
| Device Type | # Households | % Households |
| Desktop or Laptop | 544 | 69.9% |
| Smartphone | 612 | 78.7% |
| Tablet | 343 | 44.1% |
| No Computing Device | 99 | 12.7% |
| Total | 778 | 100.0% |
Internet Access in Abbotsford
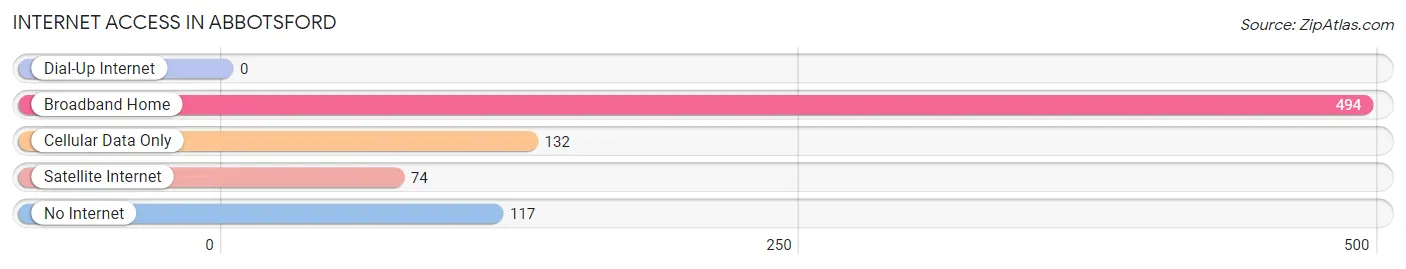
| Internet Type | # Households | % Households |
| Dial-Up Internet | 0 | 0.0% |
| Broadband Home | 494 | 63.5% |
| Cellular Data Only | 132 | 17.0% |
| Satellite Internet | 74 | 9.5% |
| No Internet | 117 | 15.0% |
| Total | 778 | 100.0% |
Abbotsford Summary
Abbotsford, Wisconsin is a small city located in Clark County, Wisconsin. It is situated on the banks of the Eau Claire River, and is home to a population of approximately 2,000 people. The city is known for its rich history, diverse geography, and vibrant economy.
History
Abbotsford was founded in 1872 by a group of settlers from New York. The city was named after Abbotsford, Scotland, the ancestral home of Sir Walter Scott. The settlers were attracted to the area due to its abundance of natural resources, including timber and water. The city quickly grew, and by the early 1900s, it had become a bustling center of commerce and industry.
The city was home to a variety of businesses, including sawmills, gristmills, and a brickyard. The city also had a thriving agricultural sector, with dairy farms, orchards, and vegetable gardens. The city was also home to a number of churches, schools, and other civic organizations.
In the early 1900s, the city was connected to the rest of the state by the Wisconsin Central Railroad. This allowed the city to become a major hub for the lumber industry, and it also allowed the city to become a major center for the dairy industry.
Geography
Abbotsford is located in the heart of Wisconsin’s Central Sands region. The city is situated on the banks of the Eau Claire River, and is surrounded by rolling hills and lush forests. The city is located approximately 30 miles from the city of Eau Claire, and is approximately 90 miles from the state capital of Madison.
The city is home to a variety of natural attractions, including the Abbotsford Dam, which was built in the early 1900s to provide hydroelectric power to the city. The city is also home to a number of parks, including the Abbotsford City Park, which features a variety of recreational activities, including fishing, swimming, and hiking.
Economy
Abbotsford’s economy is largely based on agriculture and manufacturing. The city is home to a number of dairy farms, as well as a variety of other agricultural operations. The city is also home to a number of manufacturing companies, including a paper mill, a furniture factory, and a plastics factory.
The city is also home to a number of retail stores, restaurants, and other businesses. The city is also home to a number of medical facilities, including a hospital and a number of clinics.
Demographics
As of the 2010 census, the population of Abbotsford was 2,000. The city is predominantly white, with approximately 95% of the population identifying as white. The city is also home to a small Hispanic population, with approximately 3% of the population identifying as Hispanic. The city is also home to a small African American population, with approximately 1% of the population identifying as African American. The city is also home to a small Asian population, with approximately 1% of the population identifying as Asian. The city is also home to a small Native American population, with approximately 1% of the population identifying as Native American.
Common Questions
What is Per Capita Income in Abbotsford?
Per Capita income in Abbotsford is $26,963.
What is the Median Family Income in Abbotsford?
Median Family Income in Abbotsford is $75,750.
What is the Median Household income in Abbotsford?
Median Household Income in Abbotsford is $58,125.
What is Income or Wage Gap in Abbotsford?
Income or Wage Gap in Abbotsford is 35.8%.
Women in Abbotsford earn 64.2 cents for every dollar earned by a man.
What is Inequality or Gini Index in Abbotsford?
Inequality or Gini Index in Abbotsford is 0.38.
What is the Total Population of Abbotsford?
Total Population of Abbotsford is 2,186.
What is the Total Male Population of Abbotsford?
Total Male Population of Abbotsford is 1,150.
What is the Total Female Population of Abbotsford?
Total Female Population of Abbotsford is 1,036.
What is the Ratio of Males per 100 Females in Abbotsford?
There are 111.00 Males per 100 Females in Abbotsford.
What is the Ratio of Females per 100 Males in Abbotsford?
There are 90.09 Females per 100 Males in Abbotsford.
What is the Median Population Age in Abbotsford?
Median Population Age in Abbotsford is 36.6 Years.
What is the Average Family Size in Abbotsford
Average Family Size in Abbotsford is 3.2 People.
What is the Average Household Size in Abbotsford
Average Household Size in Abbotsford is 2.7 People.
How Large is the Labor Force in Abbotsford?
There are 1,129 People in the Labor Forcein in Abbotsford.
What is the Percentage of People in the Labor Force in Abbotsford?
68.9% of People are in the Labor Force in Abbotsford.
What is the Unemployment Rate in Abbotsford?
Unemployment Rate in Abbotsford is 6.2%.