Menasha, WI Map & Demographics
Menasha Map
Menasha Overview
$35,252
PER CAPITA INCOME
$86,734
AVG FAMILY INCOME
$62,514
AVG HOUSEHOLD INCOME
29.7%
WAGE / INCOME GAP [ % ]
70.3¢/ $1
WAGE / INCOME GAP [ $ ]
$16,647
FAMILY INCOME DEFICIT
0.42
INEQUALITY / GINI INDEX
18,125
TOTAL POPULATION
8,877
MALE POPULATION
9,248
FEMALE POPULATION
95.99
MALES / 100 FEMALES
104.18
FEMALES / 100 MALES
36.1
MEDIAN AGE
3.0
AVG FAMILY SIZE
2.2
AVG HOUSEHOLD SIZE
10,377
LABOR FORCE [ PEOPLE ]
72.6%
PERCENT IN LABOR FORCE
3.2%
UNEMPLOYMENT RATE
Menasha Zip Codes
Income in Menasha
Income Overview in Menasha
Per Capita Income in Menasha is $35,252, while median incomes of families and households are $86,734 and $62,514 respectively.
| Characteristic | Number | Measure |
| Per Capita Income | 18,125 | $35,252 |
| Median Family Income | 4,359 | $86,734 |
| Mean Family Income | 4,359 | $101,639 |
| Median Household Income | 8,022 | $62,514 |
| Mean Household Income | 8,022 | $79,086 |
| Income Deficit | 4,359 | $16,647 |
| Wage / Income Gap (%) | 18,125 | 29.68% |
| Wage / Income Gap ($) | 18,125 | 70.32¢ per $1 |
| Gini / Inequality Index | 18,125 | 0.42 |
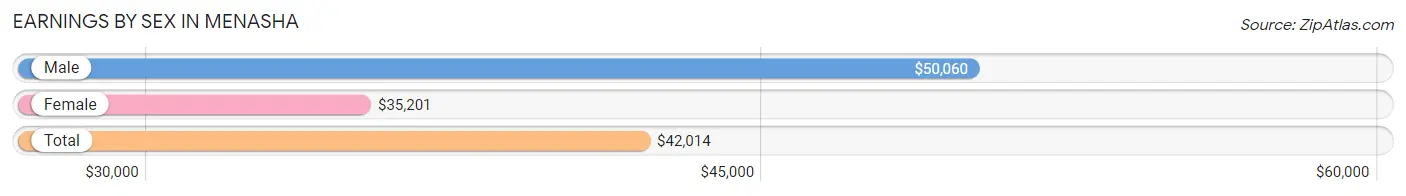
Earnings by Sex in Menasha
Average Earnings in Menasha are $42,014, $50,060 for men and $35,201 for women, a difference of 29.7%.
| Sex | Number | Average Earnings |
| Male | 5,578 (51.9%) | $50,060 |
| Female | 5,163 (48.1%) | $35,201 |
| Total | 10,741 (100.0%) | $42,014 |
Earnings by Sex by Income Bracket in Menasha
The most common earnings brackets in Menasha are $75,000 to $99,999 for men (838 | 15.0%) and $35,000 to $39,999 for women (477 | 9.2%).
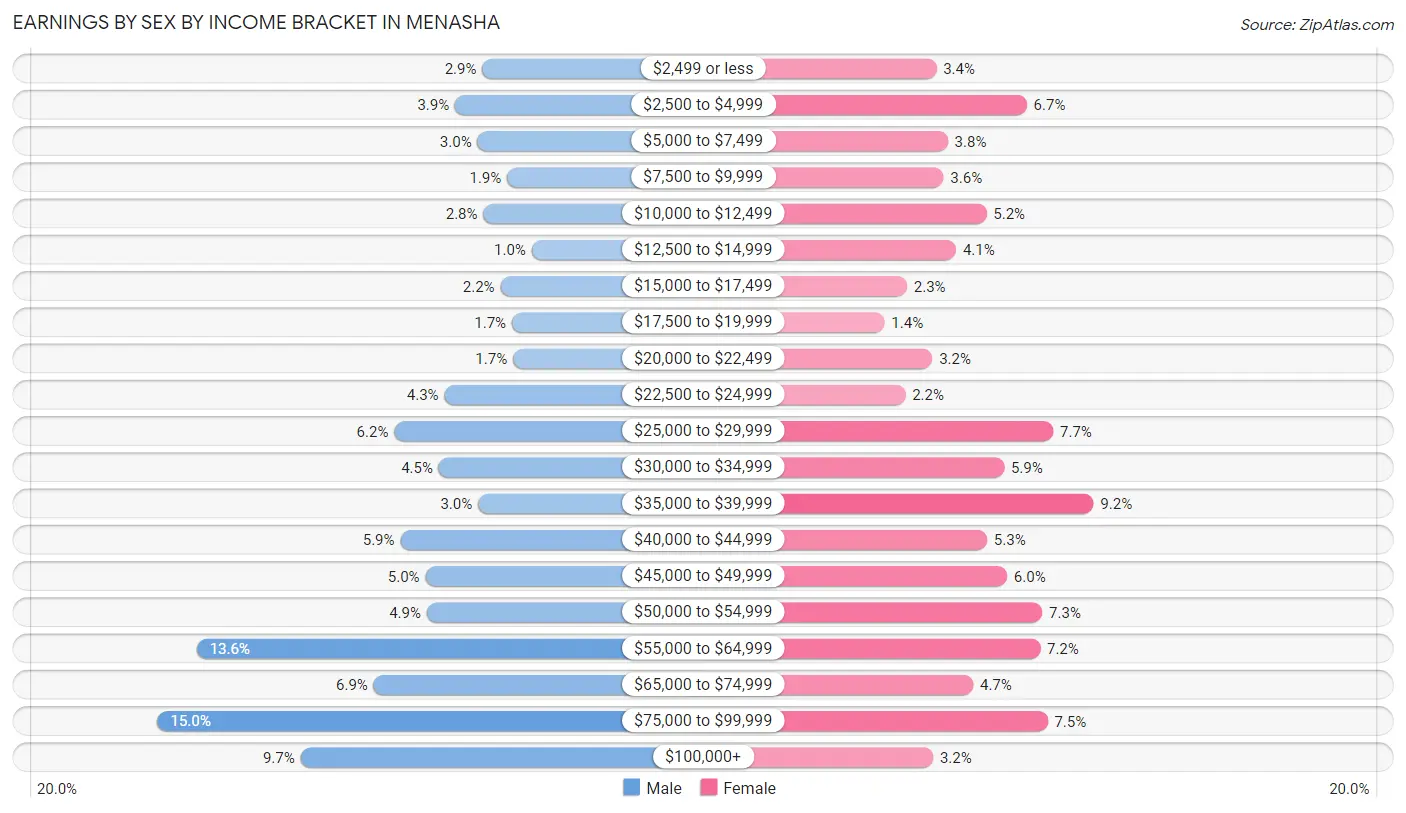
| Income | Male | Female |
| $2,499 or less | 159 (2.9%) | 173 (3.4%) |
| $2,500 to $4,999 | 216 (3.9%) | 348 (6.7%) |
| $5,000 to $7,499 | 169 (3.0%) | 195 (3.8%) |
| $7,500 to $9,999 | 107 (1.9%) | 187 (3.6%) |
| $10,000 to $12,499 | 157 (2.8%) | 270 (5.2%) |
| $12,500 to $14,999 | 56 (1.0%) | 211 (4.1%) |
| $15,000 to $17,499 | 121 (2.2%) | 116 (2.2%) |
| $17,500 to $19,999 | 97 (1.7%) | 73 (1.4%) |
| $20,000 to $22,499 | 95 (1.7%) | 165 (3.2%) |
| $22,500 to $24,999 | 238 (4.3%) | 113 (2.2%) |
| $25,000 to $29,999 | 343 (6.1%) | 399 (7.7%) |
| $30,000 to $34,999 | 250 (4.5%) | 304 (5.9%) |
| $35,000 to $39,999 | 168 (3.0%) | 477 (9.2%) |
| $40,000 to $44,999 | 330 (5.9%) | 271 (5.2%) |
| $45,000 to $49,999 | 278 (5.0%) | 310 (6.0%) |
| $50,000 to $54,999 | 275 (4.9%) | 378 (7.3%) |
| $55,000 to $64,999 | 756 (13.6%) | 374 (7.2%) |
| $65,000 to $74,999 | 386 (6.9%) | 244 (4.7%) |
| $75,000 to $99,999 | 838 (15.0%) | 388 (7.5%) |
| $100,000+ | 539 (9.7%) | 167 (3.2%) |
| Total | 5,578 (100.0%) | 5,163 (100.0%) |
Earnings by Sex by Educational Attainment in Menasha
Average earnings in Menasha are $56,178 for men and $36,851 for women, a difference of 34.4%. Men with an educational attainment of graduate degree enjoy the highest average annual earnings of $76,058, while those with high school diploma education earn the least with $43,441. Women with an educational attainment of graduate degree earn the most with the average annual earnings of $62,500, while those with high school diploma education have the smallest earnings of $29,409.
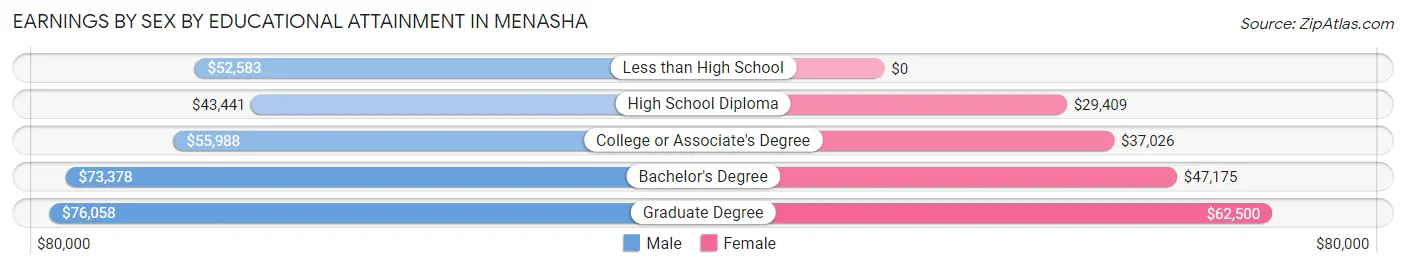
| Educational Attainment | Male Income | Female Income |
| Less than High School | $52,583 | $0 |
| High School Diploma | $43,441 | $29,409 |
| College or Associate's Degree | $55,988 | $37,026 |
| Bachelor's Degree | $73,378 | $47,175 |
| Graduate Degree | $76,058 | $62,500 |
| Total | $56,178 | $36,851 |
Family Income in Menasha
Family Income Brackets in Menasha
According to the Menasha family income data, there are 1,159 families falling into the $100,000 to $149,999 income range, which is the most common income bracket and makes up 26.6% of all families. Conversely, the $10,000 to $14,999 income bracket is the least frequent group with only 39 families (0.9%) belonging to this category.
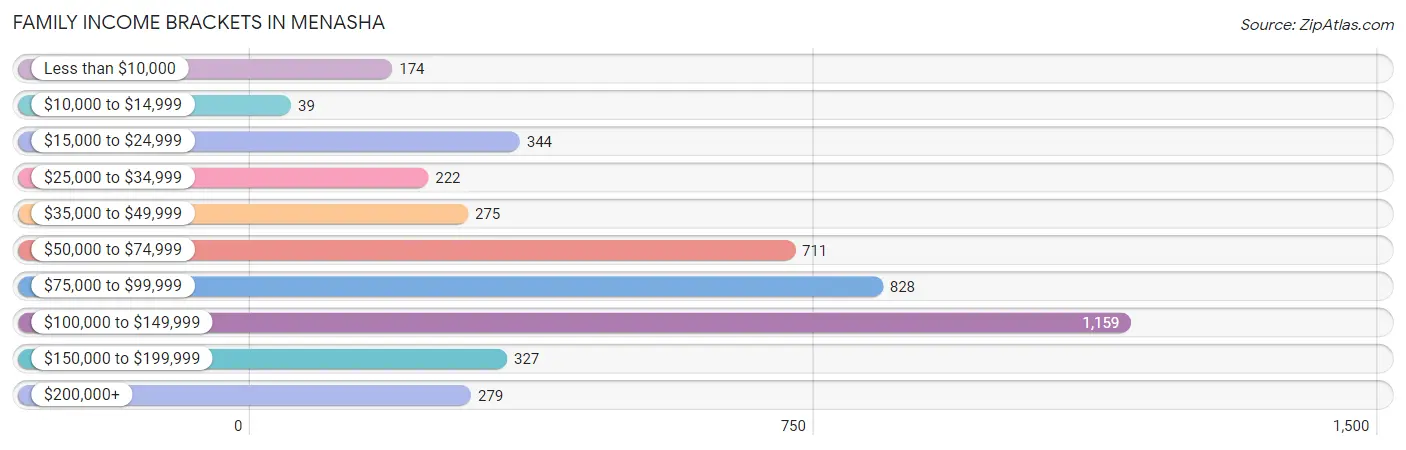
| Income Bracket | # Families | % Families |
| Less than $10,000 | 174 | 4.0% |
| $10,000 to $14,999 | 39 | 0.9% |
| $15,000 to $24,999 | 344 | 7.9% |
| $25,000 to $34,999 | 222 | 5.1% |
| $35,000 to $49,999 | 275 | 6.3% |
| $50,000 to $74,999 | 711 | 16.3% |
| $75,000 to $99,999 | 828 | 19.0% |
| $100,000 to $149,999 | 1,159 | 26.6% |
| $150,000 to $199,999 | 327 | 7.5% |
| $200,000+ | 279 | 6.4% |
Family Income by Famaliy Size in Menasha
4-person families (829 | 19.0%) account for the highest median family income in Menasha with $112,413 per family, while 3-person families (935 | 21.4%) have the highest median income of $34,238 per family member.
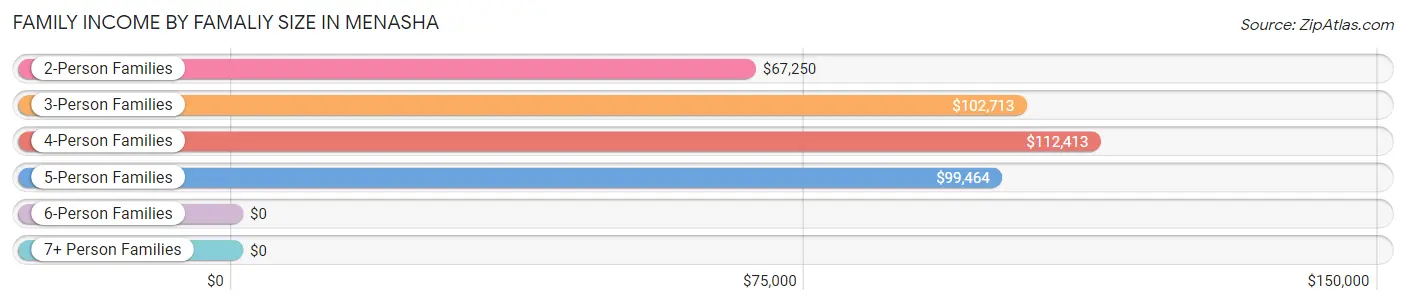
| Income Bracket | # Families | Median Income |
| 2-Person Families | 2,187 (50.2%) | $67,250 |
| 3-Person Families | 935 (21.4%) | $102,713 |
| 4-Person Families | 829 (19.0%) | $112,413 |
| 5-Person Families | 202 (4.6%) | $99,464 |
| 6-Person Families | 157 (3.6%) | $0 |
| 7+ Person Families | 49 (1.1%) | $0 |
| Total | 4,359 (100.0%) | $86,734 |
Family Income by Number of Earners in Menasha
The median family income in Menasha is $86,734, with families comprising 3+ earners (559) having the highest median family income of $141,250, while families with no earners (575) have the lowest median family income of $48,036, accounting for 12.8% and 13.2% of families, respectively.
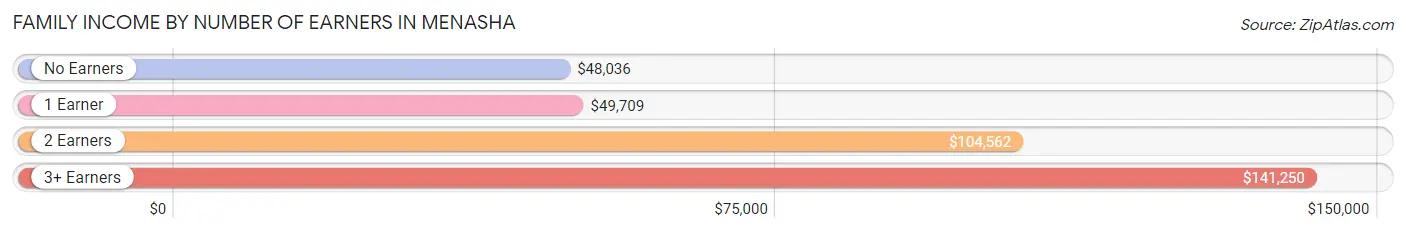
| Number of Earners | # Families | Median Income |
| No Earners | 575 (13.2%) | $48,036 |
| 1 Earner | 1,214 (27.9%) | $49,709 |
| 2 Earners | 2,011 (46.1%) | $104,562 |
| 3+ Earners | 559 (12.8%) | $141,250 |
| Total | 4,359 (100.0%) | $86,734 |
Household Income in Menasha
Household Income Brackets in Menasha
With 1,508 households falling in the category, the $50,000 to $74,999 income range is the most frequent in Menasha, accounting for 18.8% of all households. In contrast, only 297 households (3.7%) fall into the less than $10,000 income bracket, making it the least populous group.
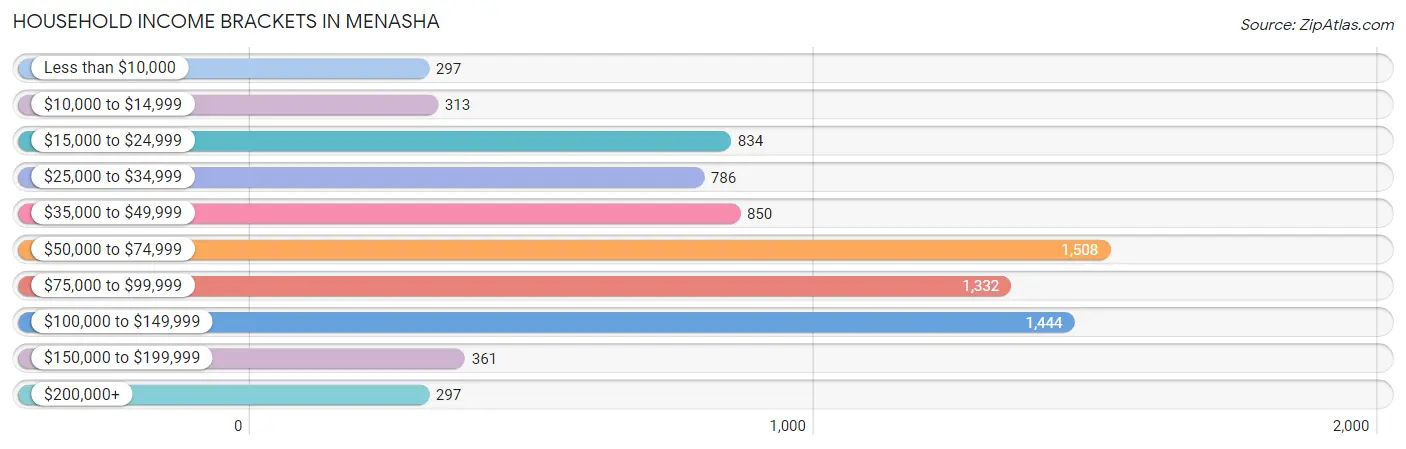
| Income Bracket | # Households | % Households |
| Less than $10,000 | 297 | 3.7% |
| $10,000 to $14,999 | 313 | 3.9% |
| $15,000 to $24,999 | 834 | 10.4% |
| $25,000 to $34,999 | 786 | 9.8% |
| $35,000 to $49,999 | 850 | 10.6% |
| $50,000 to $74,999 | 1,508 | 18.8% |
| $75,000 to $99,999 | 1,332 | 16.6% |
| $100,000 to $149,999 | 1,444 | 18.0% |
| $150,000 to $199,999 | 361 | 4.5% |
| $200,000+ | 297 | 3.7% |
Household Income by Householder Age in Menasha
The median household income in Menasha is $62,514, with the highest median household income of $81,678 found in the 25 to 44 years age bracket for the primary householder. A total of 3,175 households (39.6%) fall into this category. Meanwhile, the 15 to 24 years age bracket for the primary householder has the lowest median household income of $35,194, with 441 households (5.5%) in this group.
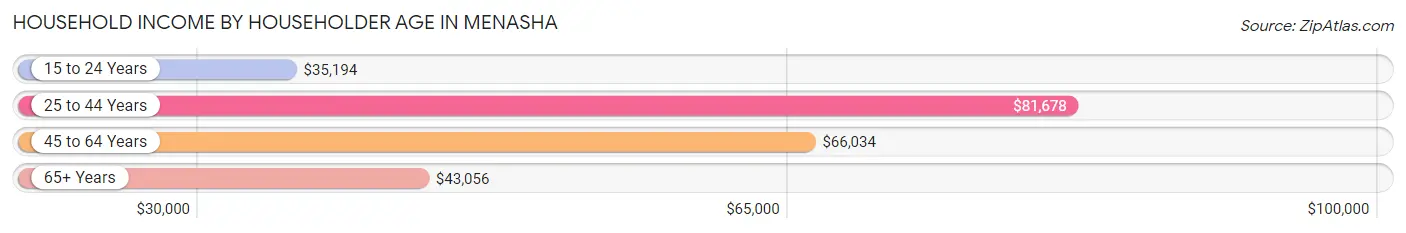
| Income Bracket | # Households | Median Income |
| 15 to 24 Years | 441 (5.5%) | $35,194 |
| 25 to 44 Years | 3,175 (39.6%) | $81,678 |
| 45 to 64 Years | 2,716 (33.9%) | $66,034 |
| 65+ Years | 1,690 (21.1%) | $43,056 |
| Total | 8,022 (100.0%) | $62,514 |
Poverty in Menasha
Income Below Poverty by Sex and Age in Menasha
With 11.0% poverty level for males and 14.4% for females among the residents of Menasha, 16 and 17 year old males and 5 year old females are the most vulnerable to poverty, with 109 males (35.9%) and 93 females (34.7%) in their respective age groups living below the poverty level.
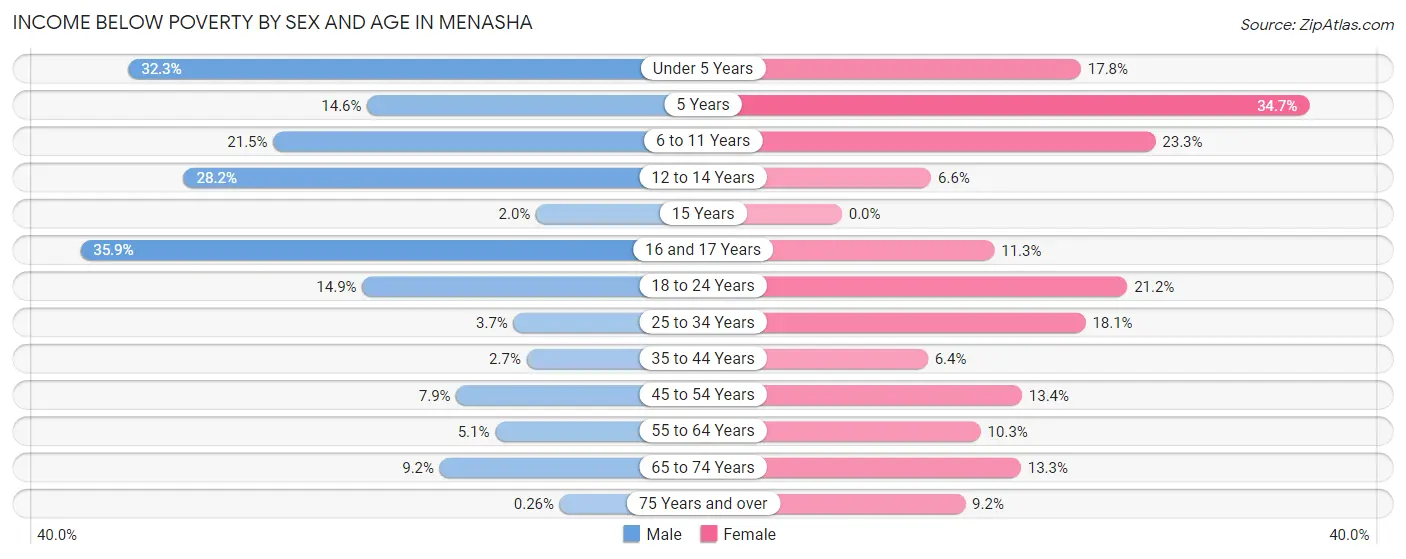
| Age Bracket | Male | Female |
| Under 5 Years | 136 (32.3%) | 123 (17.7%) |
| 5 Years | 24 (14.5%) | 93 (34.7%) |
| 6 to 11 Years | 149 (21.5%) | 139 (23.3%) |
| 12 to 14 Years | 137 (28.2%) | 13 (6.6%) |
| 15 Years | 2 (2.0%) | 0 (0.0%) |
| 16 and 17 Years | 109 (35.9%) | 24 (11.3%) |
| 18 to 24 Years | 131 (14.9%) | 181 (21.2%) |
| 25 to 34 Years | 47 (3.7%) | 261 (18.1%) |
| 35 to 44 Years | 36 (2.7%) | 87 (6.4%) |
| 45 to 54 Years | 90 (7.9%) | 134 (13.4%) |
| 55 to 64 Years | 50 (5.1%) | 128 (10.3%) |
| 65 to 74 Years | 62 (9.2%) | 95 (13.3%) |
| 75 Years and over | 1 (0.3%) | 45 (9.2%) |
| Total | 974 (11.0%) | 1,323 (14.4%) |
Income Above Poverty by Sex and Age in Menasha
According to the poverty statistics in Menasha, males aged 75 years and over and females aged 15 years are the age groups that are most secure financially, with 99.7% of males and 100.0% of females in these age groups living above the poverty line.
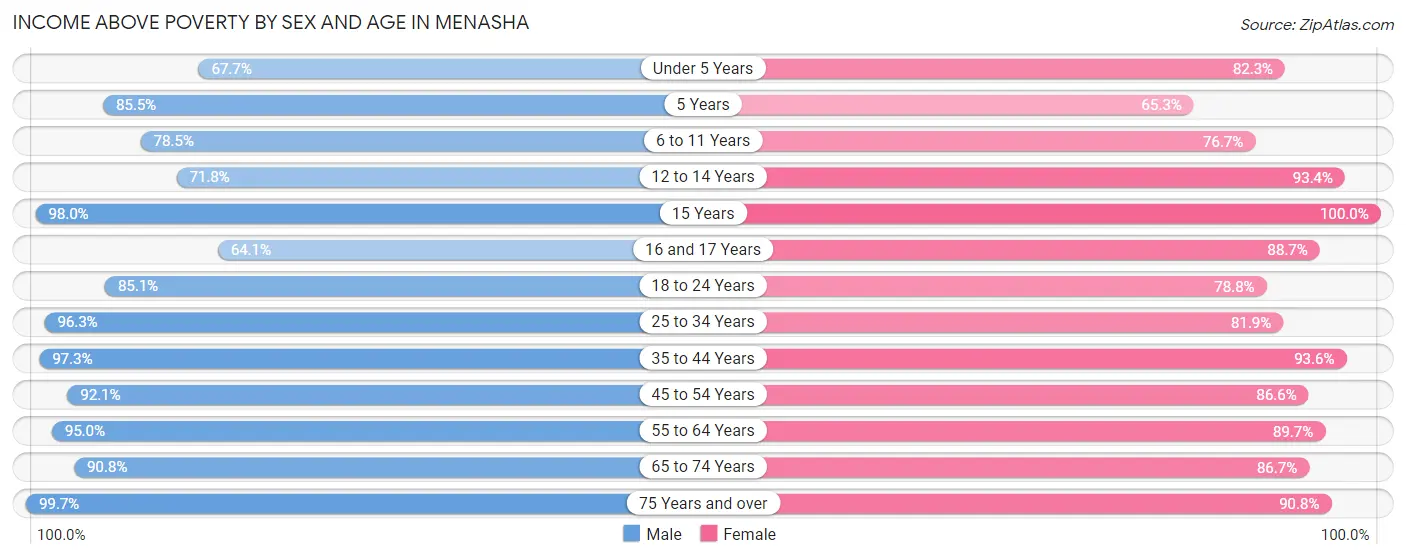
| Age Bracket | Male | Female |
| Under 5 Years | 285 (67.7%) | 570 (82.3%) |
| 5 Years | 141 (85.5%) | 175 (65.3%) |
| 6 to 11 Years | 543 (78.5%) | 458 (76.7%) |
| 12 to 14 Years | 349 (71.8%) | 183 (93.4%) |
| 15 Years | 97 (98.0%) | 113 (100.0%) |
| 16 and 17 Years | 195 (64.1%) | 188 (88.7%) |
| 18 to 24 Years | 747 (85.1%) | 673 (78.8%) |
| 25 to 34 Years | 1,226 (96.3%) | 1,182 (81.9%) |
| 35 to 44 Years | 1,286 (97.3%) | 1,277 (93.6%) |
| 45 to 54 Years | 1,043 (92.1%) | 868 (86.6%) |
| 55 to 64 Years | 941 (95.0%) | 1,113 (89.7%) |
| 65 to 74 Years | 614 (90.8%) | 620 (86.7%) |
| 75 Years and over | 390 (99.7%) | 446 (90.8%) |
| Total | 7,857 (89.0%) | 7,866 (85.6%) |
Income Below Poverty Among Married-Couple Families in Menasha
The poverty statistics for married-couple families in Menasha show that 0.4% or 14 of the total 3,104 families live below the poverty line. Families with no children have the highest poverty rate of 0.9%, comprising of 14 families. On the other hand, families with 1 or 2 children have the lowest poverty rate of 0.0%, which includes 0 families.
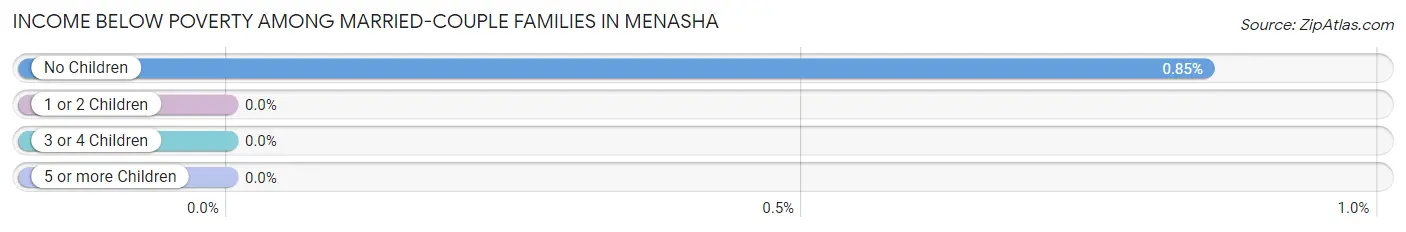
| Children | Above Poverty | Below Poverty |
| No Children | 1,625 (99.2%) | 14 (0.9%) |
| 1 or 2 Children | 1,252 (100.0%) | 0 (0.0%) |
| 3 or 4 Children | 207 (100.0%) | 0 (0.0%) |
| 5 or more Children | 6 (100.0%) | 0 (0.0%) |
| Total | 3,090 (99.6%) | 14 (0.4%) |
Income Below Poverty Among Single-Parent Households in Menasha
According to the poverty data in Menasha, 7.8% or 27 single-father households and 28.2% or 256 single-mother households are living below the poverty line. Among single-father households, those with 1 or 2 children have the highest poverty rate, with 27 households (16.6%) experiencing poverty. Likewise, among single-mother households, those with 5 or more children have the highest poverty rate, with 83 households (100.0%) falling below the poverty line.
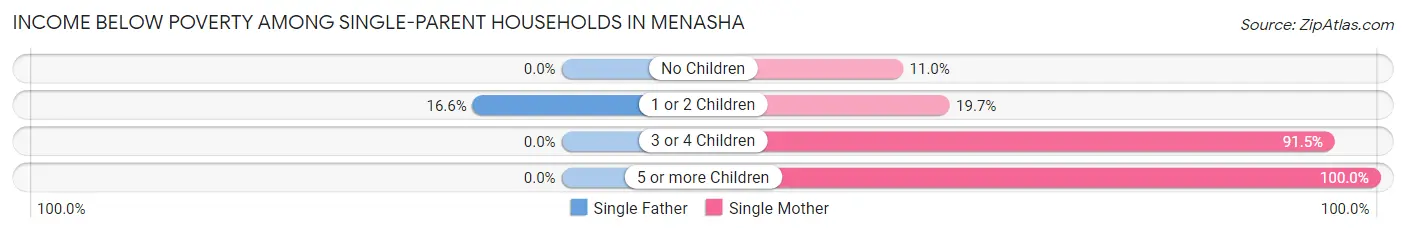
| Children | Single Father | Single Mother |
| No Children | 0 (0.0%) | 29 (11.0%) |
| 1 or 2 Children | 27 (16.6%) | 101 (19.7%) |
| 3 or 4 Children | 0 (0.0%) | 43 (91.5%) |
| 5 or more Children | 0 (0.0%) | 83 (100.0%) |
| Total | 27 (7.8%) | 256 (28.2%) |
Income Below Poverty Among Married-Couple vs Single-Parent Households in Menasha
The poverty data for Menasha shows that 14 of the married-couple family households (0.4%) and 283 of the single-parent households (22.6%) are living below the poverty level. Within the married-couple family households, those with no children have the highest poverty rate, with 14 households (0.9%) falling below the poverty line. Among the single-parent households, those with 5 or more children have the highest poverty rate, with 83 household (100.0%) living below poverty.
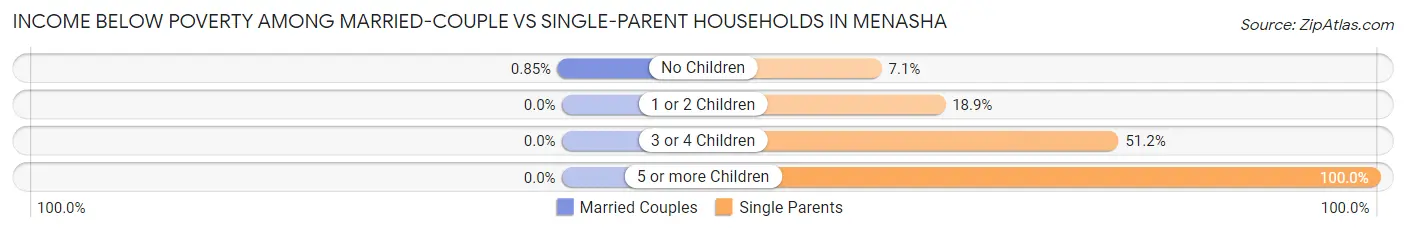
| Children | Married-Couple Families | Single-Parent Households |
| No Children | 14 (0.9%) | 29 (7.1%) |
| 1 or 2 Children | 0 (0.0%) | 128 (18.9%) |
| 3 or 4 Children | 0 (0.0%) | 43 (51.2%) |
| 5 or more Children | 0 (0.0%) | 83 (100.0%) |
| Total | 14 (0.4%) | 283 (22.6%) |
Race in Menasha
The most populous races in Menasha are White / Caucasian (14,916 | 82.3%), Hispanic or Latino (2,078 | 11.5%), and Two or more Races (1,308 | 7.2%).
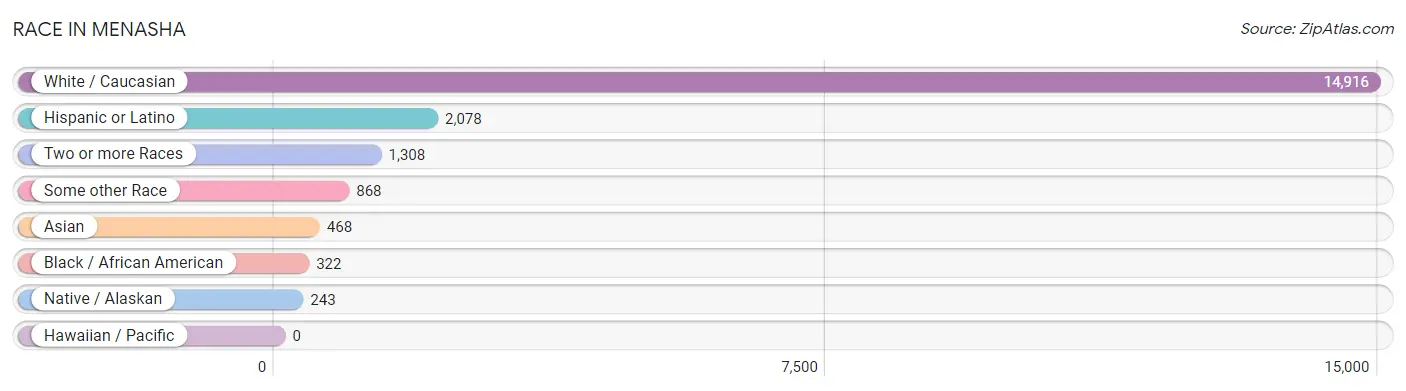
| Race | # Population | % Population |
| Asian | 468 | 2.6% |
| Black / African American | 322 | 1.8% |
| Hawaiian / Pacific | 0 | 0.0% |
| Hispanic or Latino | 2,078 | 11.5% |
| Native / Alaskan | 243 | 1.3% |
| White / Caucasian | 14,916 | 82.3% |
| Two or more Races | 1,308 | 7.2% |
| Some other Race | 868 | 4.8% |
| Total | 18,125 | 100.0% |
Ancestry in Menasha
The most populous ancestries reported in Menasha are German (7,651 | 42.2%), Irish (1,831 | 10.1%), Polish (1,055 | 5.8%), Mexican (998 | 5.5%), and Puerto Rican (879 | 4.9%), together accounting for 68.5% of all Menasha residents.
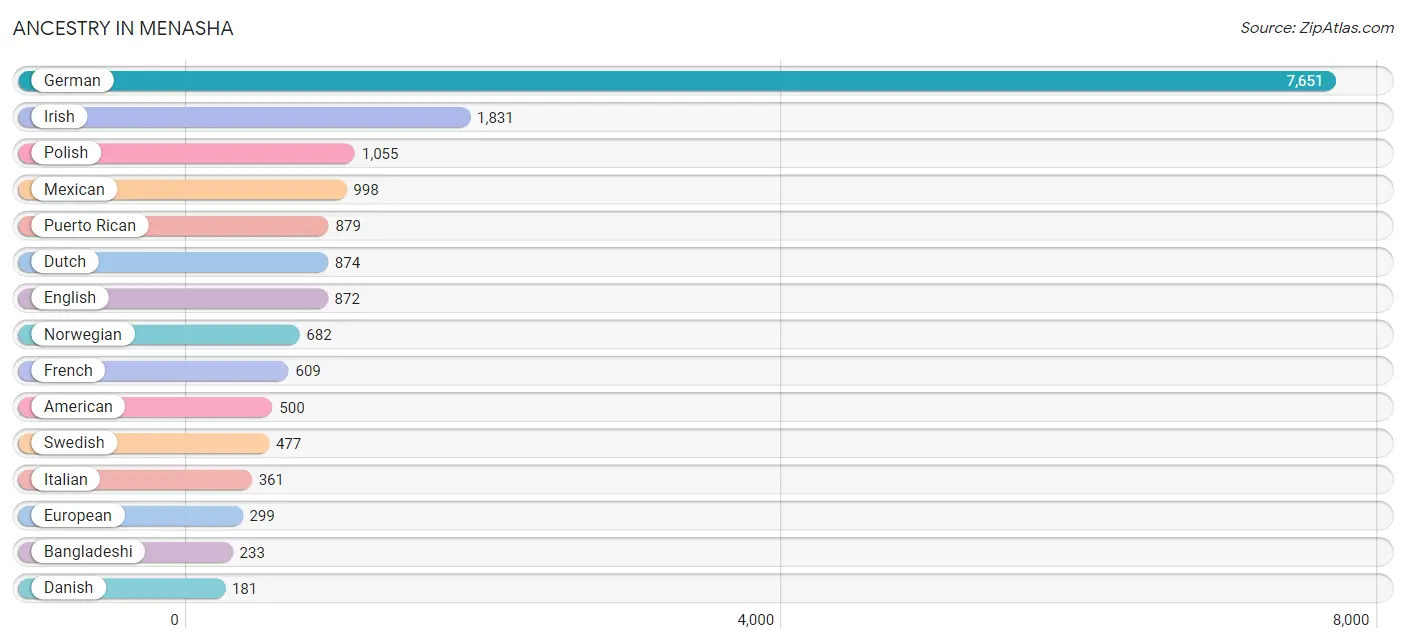
| Ancestry | # Population | % Population |
| American | 500 | 2.8% |
| Apache | 28 | 0.2% |
| Austrian | 104 | 0.6% |
| Bangladeshi | 233 | 1.3% |
| Belgian | 73 | 0.4% |
| Bhutanese | 99 | 0.5% |
| Blackfeet | 2 | 0.0% |
| Brazilian | 34 | 0.2% |
| British | 92 | 0.5% |
| Burmese | 33 | 0.2% |
| Celtic | 7 | 0.0% |
| Central American | 51 | 0.3% |
| Cherokee | 5 | 0.0% |
| Chilean | 6 | 0.0% |
| Chippewa | 71 | 0.4% |
| Colombian | 6 | 0.0% |
| Cuban | 7 | 0.0% |
| Czech | 49 | 0.3% |
| Danish | 181 | 1.0% |
| Dutch | 874 | 4.8% |
| Eastern European | 18 | 0.1% |
| Ecuadorian | 66 | 0.4% |
| English | 872 | 4.8% |
| European | 299 | 1.7% |
| Finnish | 93 | 0.5% |
| French | 609 | 3.4% |
| French Canadian | 64 | 0.4% |
| German | 7,651 | 42.2% |
| Greek | 68 | 0.4% |
| Guatemalan | 8 | 0.0% |
| Haitian | 28 | 0.2% |
| Honduran | 36 | 0.2% |
| Hungarian | 13 | 0.1% |
| Indian (Asian) | 122 | 0.7% |
| Iranian | 13 | 0.1% |
| Irish | 1,831 | 10.1% |
| Iroquois | 10 | 0.1% |
| Italian | 361 | 2.0% |
| Jamaican | 4 | 0.0% |
| Japanese | 7 | 0.0% |
| Mexican | 998 | 5.5% |
| Mexican American Indian | 95 | 0.5% |
| Norwegian | 682 | 3.8% |
| Polish | 1,055 | 5.8% |
| Portuguese | 9 | 0.1% |
| Potawatomi | 6 | 0.0% |
| Puerto Rican | 879 | 4.9% |
| Russian | 68 | 0.4% |
| Salvadoran | 7 | 0.0% |
| Scotch-Irish | 30 | 0.2% |
| Scottish | 78 | 0.4% |
| Serbian | 16 | 0.1% |
| Slovak | 1 | 0.0% |
| South American | 78 | 0.4% |
| South American Indian | 66 | 0.4% |
| Spaniard | 15 | 0.1% |
| Spanish | 6 | 0.0% |
| Sri Lankan | 7 | 0.0% |
| Subsaharan African | 21 | 0.1% |
| Swedish | 477 | 2.6% |
| Swiss | 45 | 0.3% |
| Thai | 91 | 0.5% |
| Welsh | 79 | 0.4% | View All 63 Rows |
Immigrants in Menasha
The most numerous immigrant groups reported in Menasha came from Latin America (512 | 2.8%), Central America (423 | 2.3%), Mexico (390 | 2.1%), Asia (217 | 1.2%), and China (111 | 0.6%), together accounting for 9.1% of all Menasha residents.
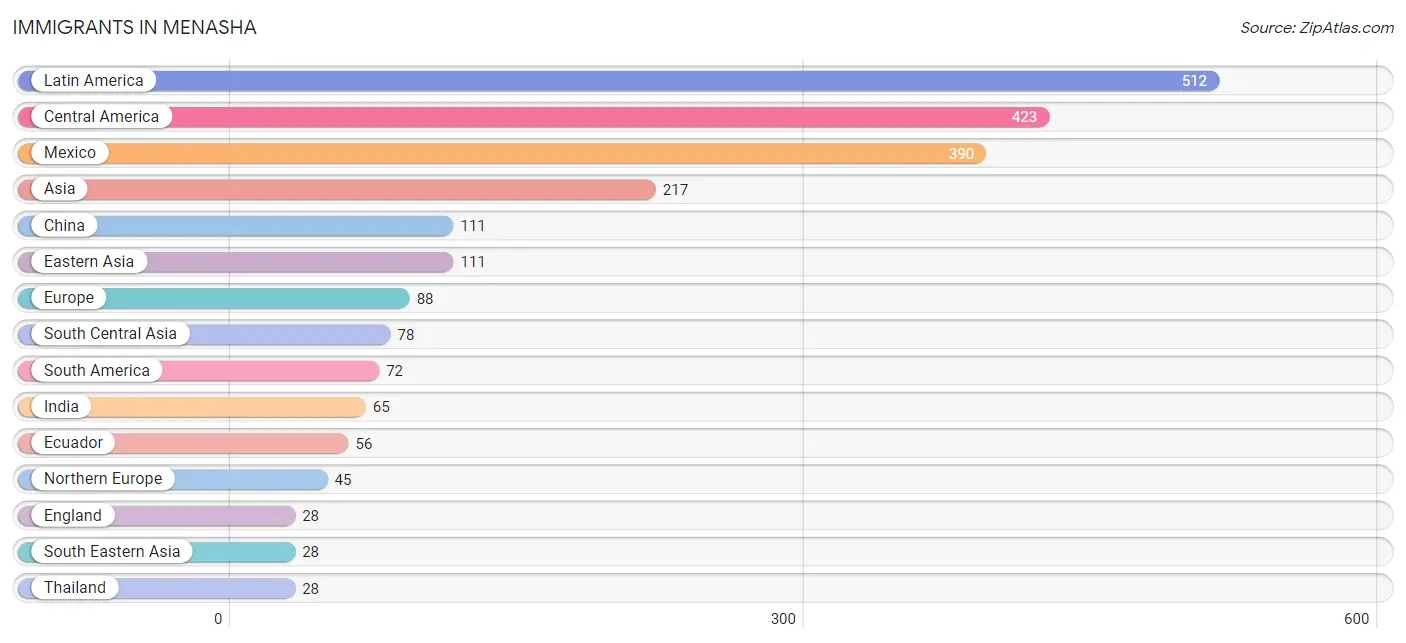
| Immigration Origin | # Population | % Population |
| Africa | 20 | 0.1% |
| Asia | 217 | 1.2% |
| Belgium | 8 | 0.0% |
| Brazil | 7 | 0.0% |
| Canada | 21 | 0.1% |
| Caribbean | 17 | 0.1% |
| Central America | 423 | 2.3% |
| Chile | 3 | 0.0% |
| China | 111 | 0.6% |
| Colombia | 6 | 0.0% |
| Croatia | 8 | 0.0% |
| Czechoslovakia | 3 | 0.0% |
| Eastern Asia | 111 | 0.6% |
| Eastern Europe | 25 | 0.1% |
| Ecuador | 56 | 0.3% |
| El Salvador | 7 | 0.0% |
| England | 28 | 0.2% |
| Europe | 88 | 0.5% |
| Germany | 10 | 0.1% |
| Guatemala | 8 | 0.0% |
| Haiti | 17 | 0.1% |
| Honduras | 18 | 0.1% |
| India | 65 | 0.4% |
| Iran | 13 | 0.1% |
| Latin America | 512 | 2.8% |
| Mexico | 390 | 2.1% |
| Nigeria | 20 | 0.1% |
| Northern Europe | 45 | 0.3% |
| Norway | 5 | 0.0% |
| Russia | 14 | 0.1% |
| South America | 72 | 0.4% |
| South Central Asia | 78 | 0.4% |
| South Eastern Asia | 28 | 0.2% |
| Thailand | 28 | 0.2% |
| Western Africa | 20 | 0.1% |
| Western Europe | 18 | 0.1% | View All 36 Rows |
Sex and Age in Menasha
Sex and Age in Menasha
The most populous age groups in Menasha are 25 to 29 Years (783 | 8.8%) for men and 25 to 29 Years (841 | 9.1%) for women.
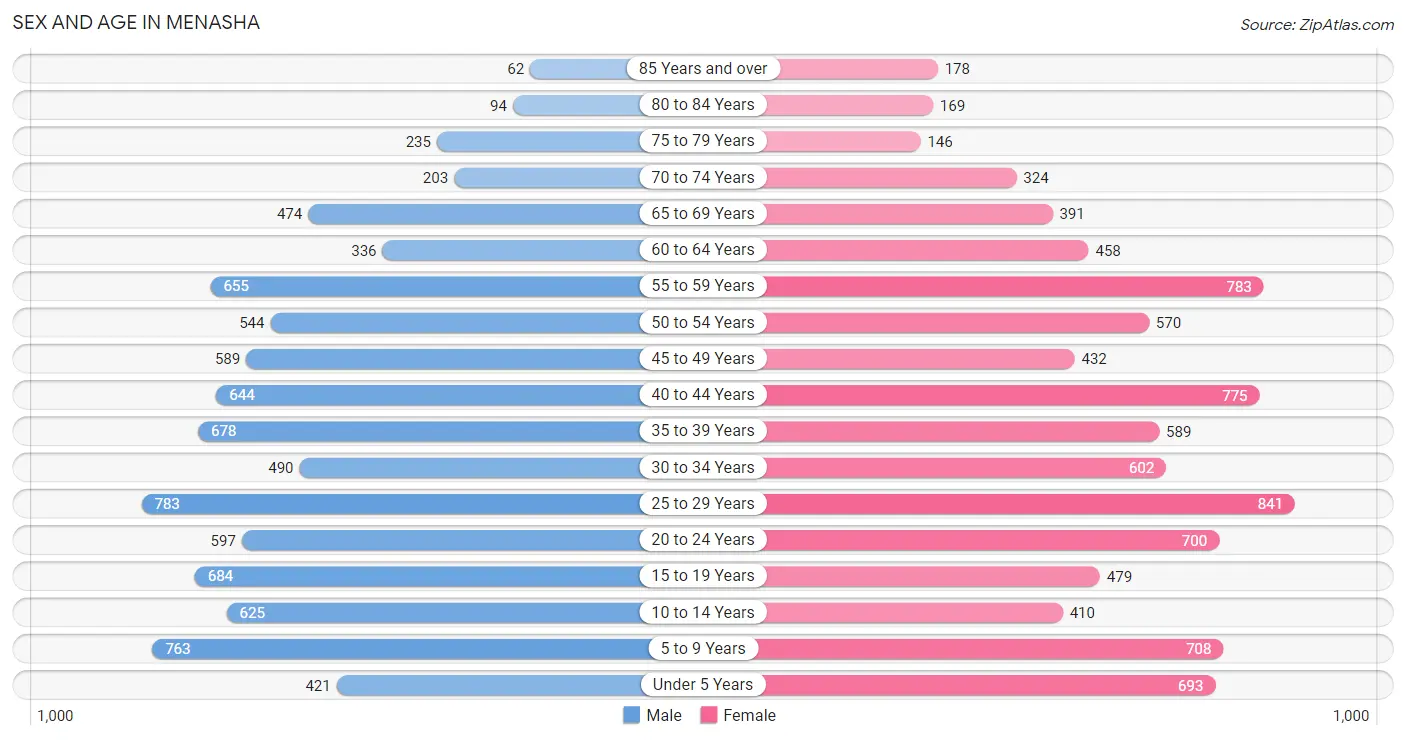
| Age Bracket | Male | Female |
| Under 5 Years | 421 (4.7%) | 693 (7.5%) |
| 5 to 9 Years | 763 (8.6%) | 708 (7.7%) |
| 10 to 14 Years | 625 (7.0%) | 410 (4.4%) |
| 15 to 19 Years | 684 (7.7%) | 479 (5.2%) |
| 20 to 24 Years | 597 (6.7%) | 700 (7.6%) |
| 25 to 29 Years | 783 (8.8%) | 841 (9.1%) |
| 30 to 34 Years | 490 (5.5%) | 602 (6.5%) |
| 35 to 39 Years | 678 (7.6%) | 589 (6.4%) |
| 40 to 44 Years | 644 (7.2%) | 775 (8.4%) |
| 45 to 49 Years | 589 (6.6%) | 432 (4.7%) |
| 50 to 54 Years | 544 (6.1%) | 570 (6.2%) |
| 55 to 59 Years | 655 (7.4%) | 783 (8.5%) |
| 60 to 64 Years | 336 (3.8%) | 458 (5.0%) |
| 65 to 69 Years | 474 (5.3%) | 391 (4.2%) |
| 70 to 74 Years | 203 (2.3%) | 324 (3.5%) |
| 75 to 79 Years | 235 (2.6%) | 146 (1.6%) |
| 80 to 84 Years | 94 (1.1%) | 169 (1.8%) |
| 85 Years and over | 62 (0.7%) | 178 (1.9%) |
| Total | 8,877 (100.0%) | 9,248 (100.0%) |
Families and Households in Menasha
Median Family Size in Menasha
The median family size in Menasha is 2.98 persons per family, with married-couple families (3,104 | 71.2%) accounting for the largest median family size of 3.02 persons per family. On the other hand, single male/father families (347 | 8.0%) represent the smallest median family size with 2.59 persons per family.
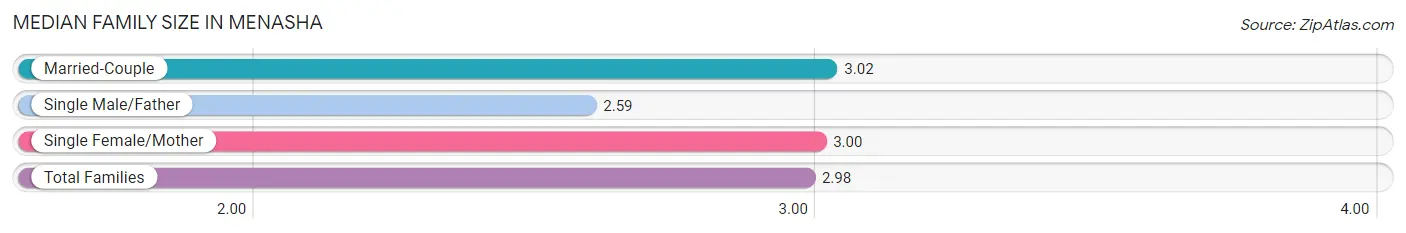
| Family Type | # Families | Family Size |
| Married-Couple | 3,104 (71.2%) | 3.02 |
| Single Male/Father | 347 (8.0%) | 2.59 |
| Single Female/Mother | 908 (20.8%) | 3.00 |
| Total Families | 4,359 (100.0%) | 2.98 |
Median Household Size in Menasha
The median household size in Menasha is 2.25 persons per household, with single female/mother households (908 | 11.3%) accounting for the largest median household size of 3.26 persons per household. non-family households (3,663 | 45.7%) represent the smallest median household size with 1.28 persons per household.
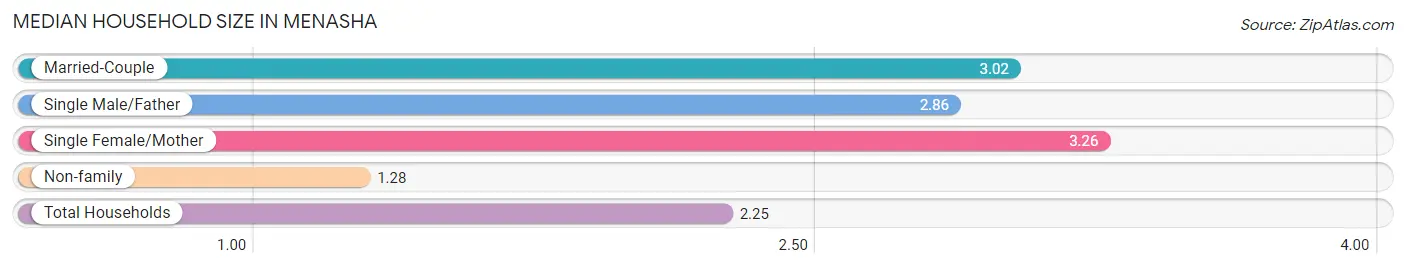
| Household Type | # Households | Household Size |
| Married-Couple | 3,104 (38.7%) | 3.02 |
| Single Male/Father | 347 (4.3%) | 2.86 |
| Single Female/Mother | 908 (11.3%) | 3.26 |
| Non-family | 3,663 (45.7%) | 1.28 |
| Total Households | 8,022 (100.0%) | 2.25 |
Household Size by Marriage Status in Menasha
Out of a total of 8,022 households in Menasha, 4,359 (54.3%) are family households, while 3,663 (45.7%) are nonfamily households. The most numerous type of family households are 2-person households, comprising 2,060, and the most common type of nonfamily households are 1-person households, comprising 2,822.
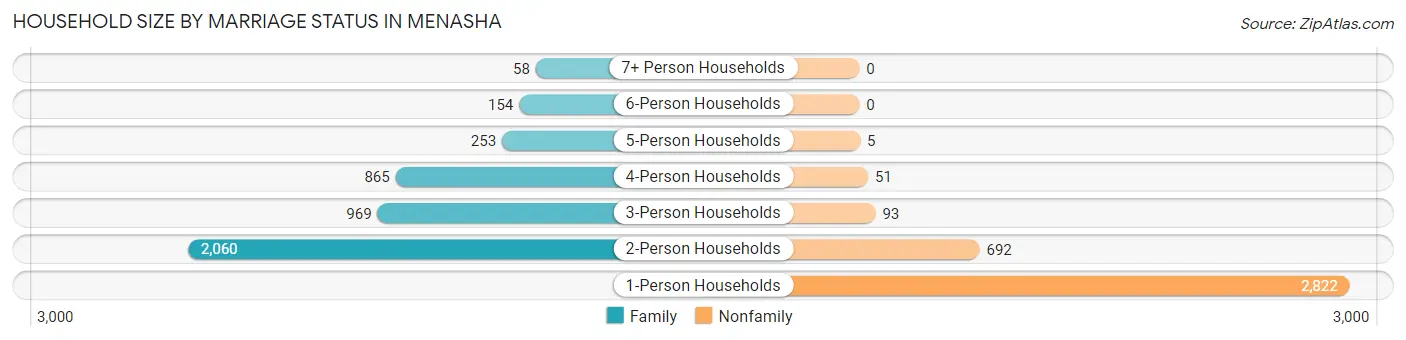
| Household Size | Family Households | Nonfamily Households |
| 1-Person Households | - | 2,822 (35.2%) |
| 2-Person Households | 2,060 (25.7%) | 692 (8.6%) |
| 3-Person Households | 969 (12.1%) | 93 (1.2%) |
| 4-Person Households | 865 (10.8%) | 51 (0.6%) |
| 5-Person Households | 253 (3.2%) | 5 (0.1%) |
| 6-Person Households | 154 (1.9%) | 0 (0.0%) |
| 7+ Person Households | 58 (0.7%) | 0 (0.0%) |
| Total | 4,359 (54.3%) | 3,663 (45.7%) |
Female Fertility in Menasha
Fertility by Age in Menasha
Average fertility rate in Menasha is 82.0 births per 1,000 women. Women in the age bracket of 20 to 34 years have the highest fertility rate with 142.0 births per 1,000 women. Women in the age bracket of 20 to 34 years acount for 82.7% of all women with births.
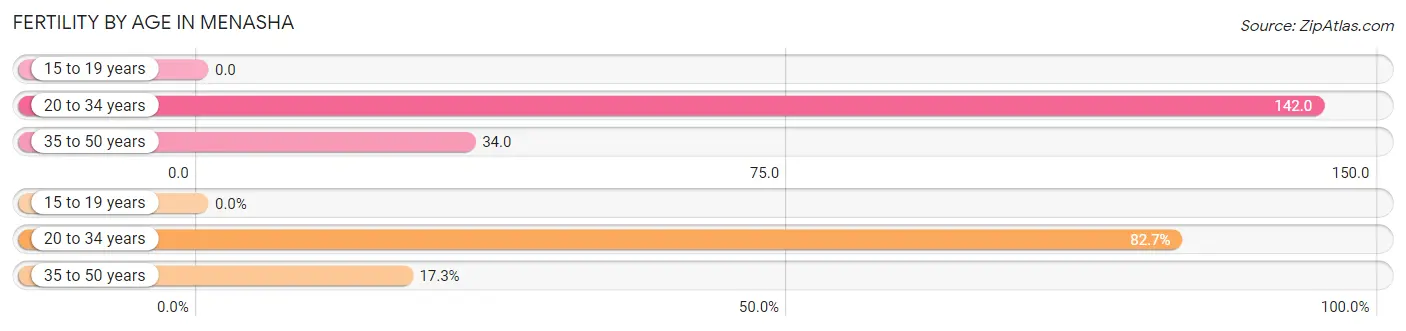
| Age Bracket | Women with Births | Births / 1,000 Women |
| 15 to 19 years | 0 (0.0%) | 0.0 |
| 20 to 34 years | 305 (82.7%) | 142.0 |
| 35 to 50 years | 64 (17.3%) | 34.0 |
| Total | 369 (100.0%) | 82.0 |
Fertility by Age by Marriage Status in Menasha
69.4% of women with births (369) in Menasha are married. The highest percentage of unmarried women with births falls into 35 to 50 years age bracket with 53.1% of them unmarried at the time of birth, while the lowest percentage of unmarried women with births belong to 20 to 34 years age bracket with 25.9% of them unmarried.
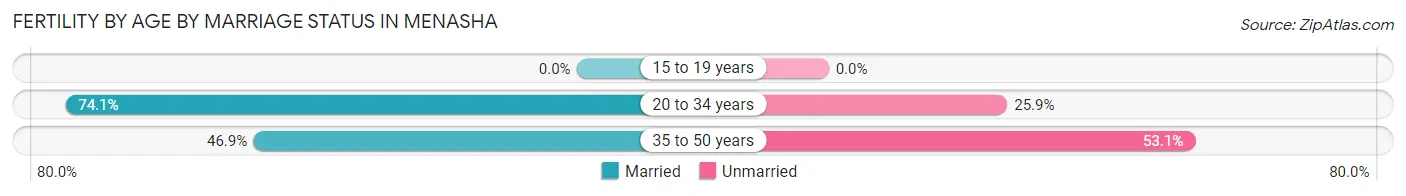
| Age Bracket | Married | Unmarried |
| 15 to 19 years | 0 (0.0%) | 0 (0.0%) |
| 20 to 34 years | 226 (74.1%) | 79 (25.9%) |
| 35 to 50 years | 30 (46.9%) | 34 (53.1%) |
| Total | 256 (69.4%) | 113 (30.6%) |
Fertility by Education in Menasha
Average fertility rate in Menasha is 82.0 births per 1,000 women. Women with the education attainment of bachelor's degree have the highest fertility rate of 161.0 births per 1,000 women, while women with the education attainment of college or associate's degree have the lowest fertility at 39.0 births per 1,000 women. Women with the education attainment of bachelor's degree represent 39.6% of all women with births.
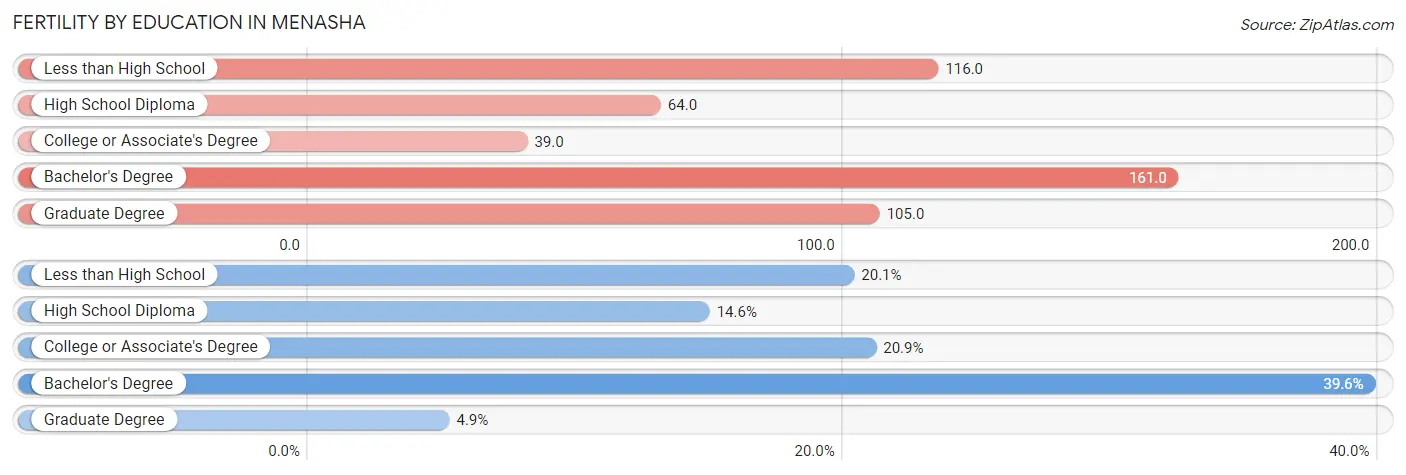
| Educational Attainment | Women with Births | Births / 1,000 Women |
| Less than High School | 74 (20.1%) | 116.0 |
| High School Diploma | 54 (14.6%) | 64.0 |
| College or Associate's Degree | 77 (20.9%) | 39.0 |
| Bachelor's Degree | 146 (39.6%) | 161.0 |
| Graduate Degree | 18 (4.9%) | 105.0 |
| Total | 369 (100.0%) | 82.0 |
Fertility by Education by Marriage Status in Menasha
30.6% of women with births in Menasha are unmarried. Women with the educational attainment of graduate degree are most likely to be married with 100.0% of them married at childbirth, while women with the educational attainment of less than high school are least likely to be married with 71.6% of them unmarried at childbirth.
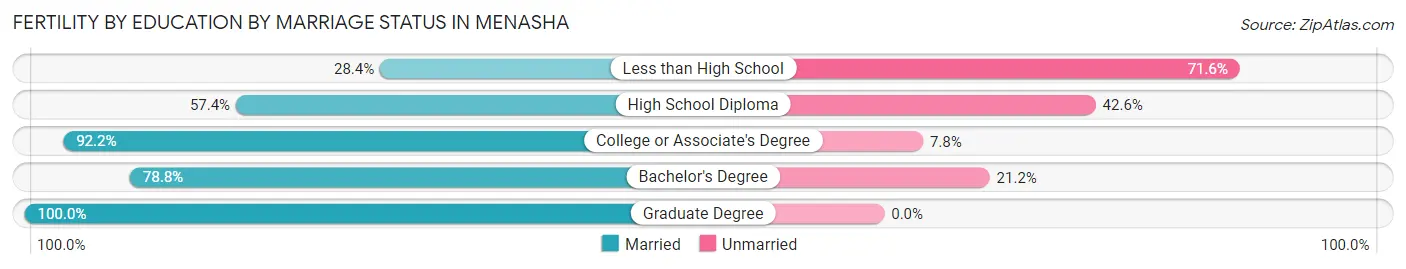
| Educational Attainment | Married | Unmarried |
| Less than High School | 21 (28.4%) | 53 (71.6%) |
| High School Diploma | 31 (57.4%) | 23 (42.6%) |
| College or Associate's Degree | 71 (92.2%) | 6 (7.8%) |
| Bachelor's Degree | 115 (78.8%) | 31 (21.2%) |
| Graduate Degree | 18 (100.0%) | 0 (0.0%) |
| Total | 256 (69.4%) | 113 (30.6%) |
Employment Characteristics in Menasha
Employment by Class of Employer in Menasha
Among the 9,799 employed individuals in Menasha, private company employees (7,663 | 78.2%), not-for-profit organizations (733 | 7.5%), and local government employees (410 | 4.2%) make up the most common classes of employment.
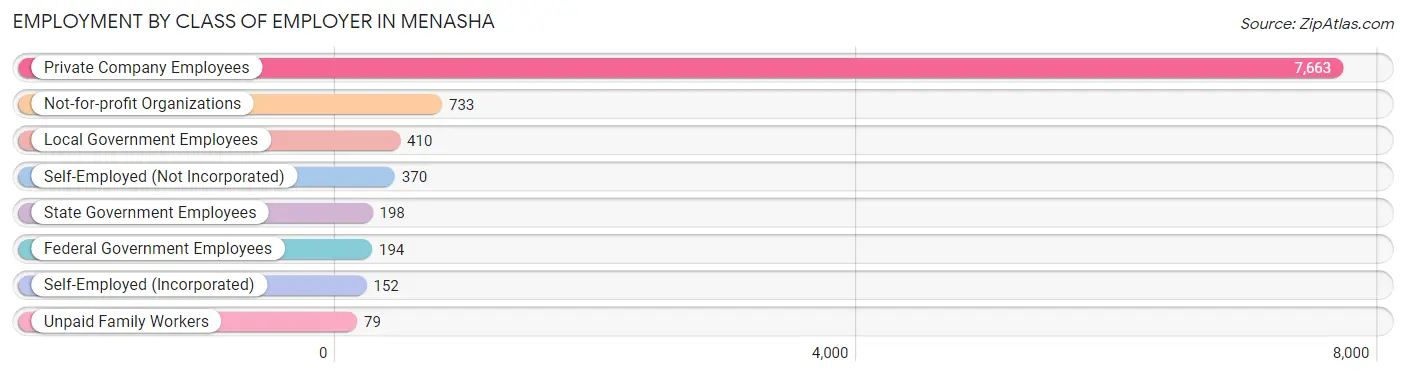
| Employer Class | # Employees | % Employees |
| Private Company Employees | 7,663 | 78.2% |
| Self-Employed (Incorporated) | 152 | 1.5% |
| Self-Employed (Not Incorporated) | 370 | 3.8% |
| Not-for-profit Organizations | 733 | 7.5% |
| Local Government Employees | 410 | 4.2% |
| State Government Employees | 198 | 2.0% |
| Federal Government Employees | 194 | 2.0% |
| Unpaid Family Workers | 79 | 0.8% |
| Total | 9,799 | 100.0% |
Employment Status by Age in Menasha
According to the labor force statistics for Menasha, out of the total population over 16 years of age (14,293), 72.6% or 10,377 individuals are in the labor force, with 3.2% or 332 of them unemployed. The age group with the highest labor force participation rate is 25 to 29 years, with 95.4% or 1,549 individuals in the labor force. Within the labor force, the 16 to 19 years age range has the highest percentage of unemployed individuals, with 11.9% or 65 of them being unemployed.
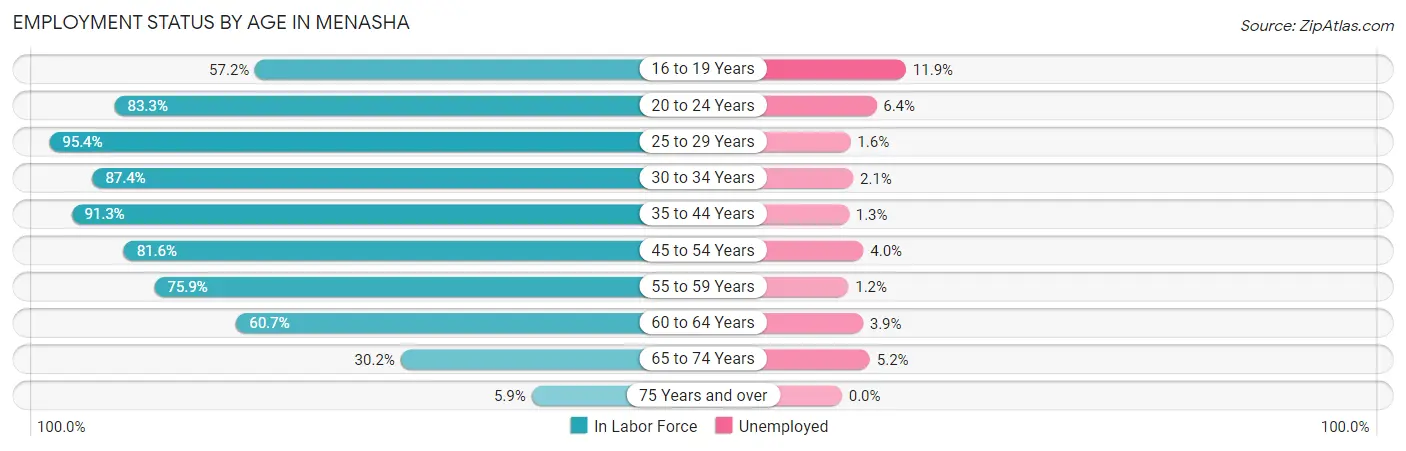
| Age Bracket | In Labor Force | Unemployed |
| 16 to 19 Years | 544 (57.2%) | 65 (11.9%) |
| 20 to 24 Years | 1,080 (83.3%) | 69 (6.4%) |
| 25 to 29 Years | 1,549 (95.4%) | 25 (1.6%) |
| 30 to 34 Years | 954 (87.4%) | 20 (2.1%) |
| 35 to 44 Years | 2,452 (91.3%) | 32 (1.3%) |
| 45 to 54 Years | 1,742 (81.6%) | 70 (4.0%) |
| 55 to 59 Years | 1,091 (75.9%) | 13 (1.2%) |
| 60 to 64 Years | 482 (60.7%) | 19 (3.9%) |
| 65 to 74 Years | 420 (30.2%) | 22 (5.2%) |
| 75 Years and over | 52 (5.9%) | 0 (0.0%) |
| Total | 10,377 (72.6%) | 332 (3.2%) |
Employment Status by Educational Attainment in Menasha
According to labor force statistics for Menasha, 84.7% of individuals (8,274) out of the total population between 25 and 64 years of age (9,769) are in the labor force, with 2.2% or 182 of them being unemployed. The group with the highest labor force participation rate are those with the educational attainment of bachelor's degree or higher, with 93.2% or 2,165 individuals in the labor force. Within the labor force, individuals with less than high school education have the highest percentage of unemployment, with 7.6% or 28 of them being unemployed.
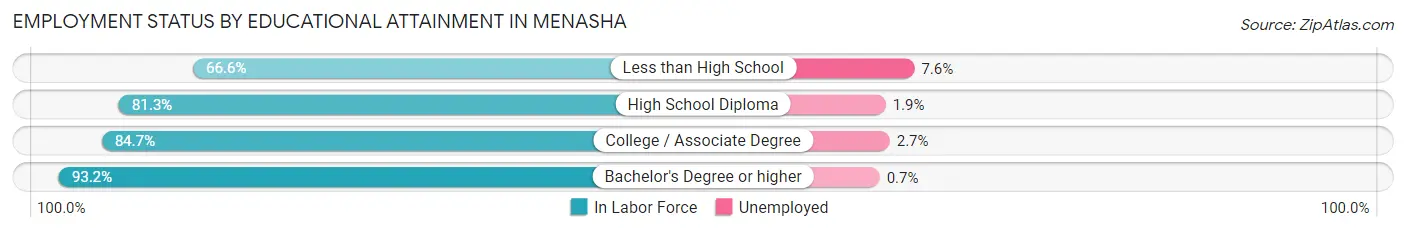
| Educational Attainment | In Labor Force | Unemployed |
| Less than High School | 369 (66.6%) | 42 (7.6%) |
| High School Diploma | 2,327 (81.3%) | 54 (1.9%) |
| College / Associate Degree | 3,413 (84.7%) | 109 (2.7%) |
| Bachelor's Degree or higher | 2,165 (93.2%) | 16 (0.7%) |
| Total | 8,274 (84.7%) | 215 (2.2%) |
Employment Occupations by Sex in Menasha
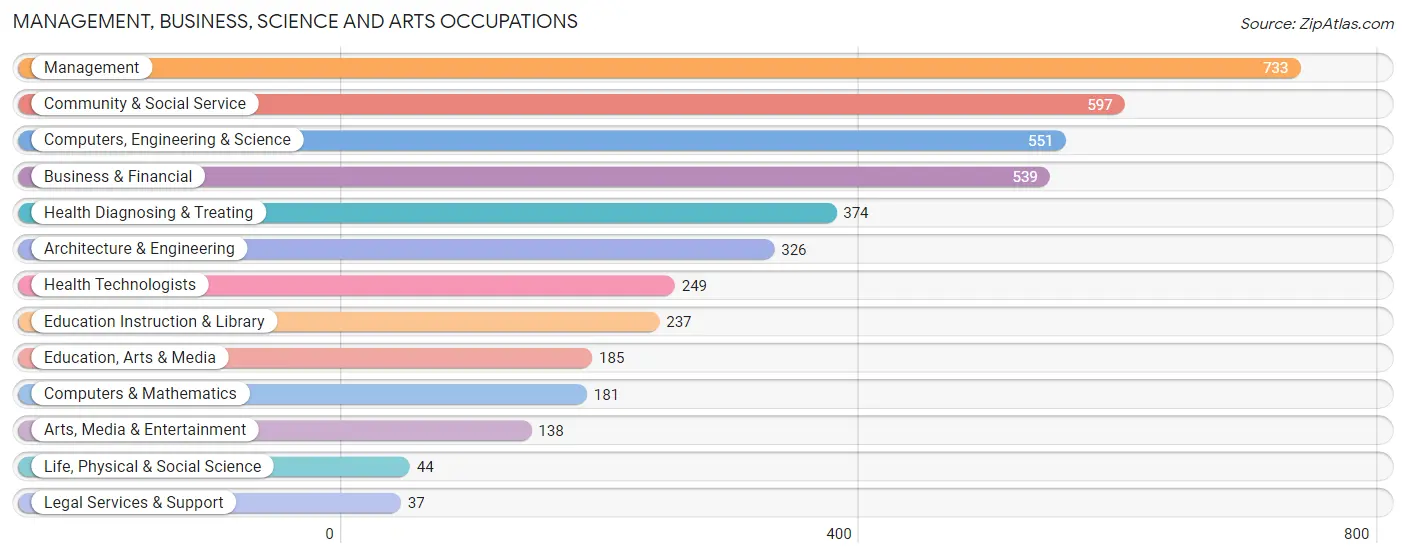
Management, Business, Science and Arts Occupations
The most common Management, Business, Science and Arts occupations in Menasha are Management (733 | 7.3%), Community & Social Service (597 | 6.0%), Computers, Engineering & Science (551 | 5.5%), Business & Financial (539 | 5.4%), and Health Diagnosing & Treating (374 | 3.7%).
Management, Business, Science and Arts Occupations by Sex
Within the Management, Business, Science and Arts occupations in Menasha, the most male-oriented occupations are Architecture & Engineering (97.9%), Computers, Engineering & Science (84.9%), and Computers & Mathematics (71.3%), while the most female-oriented occupations are Education, Arts & Media (100.0%), Arts, Media & Entertainment (87.7%), and Community & Social Service (83.9%).
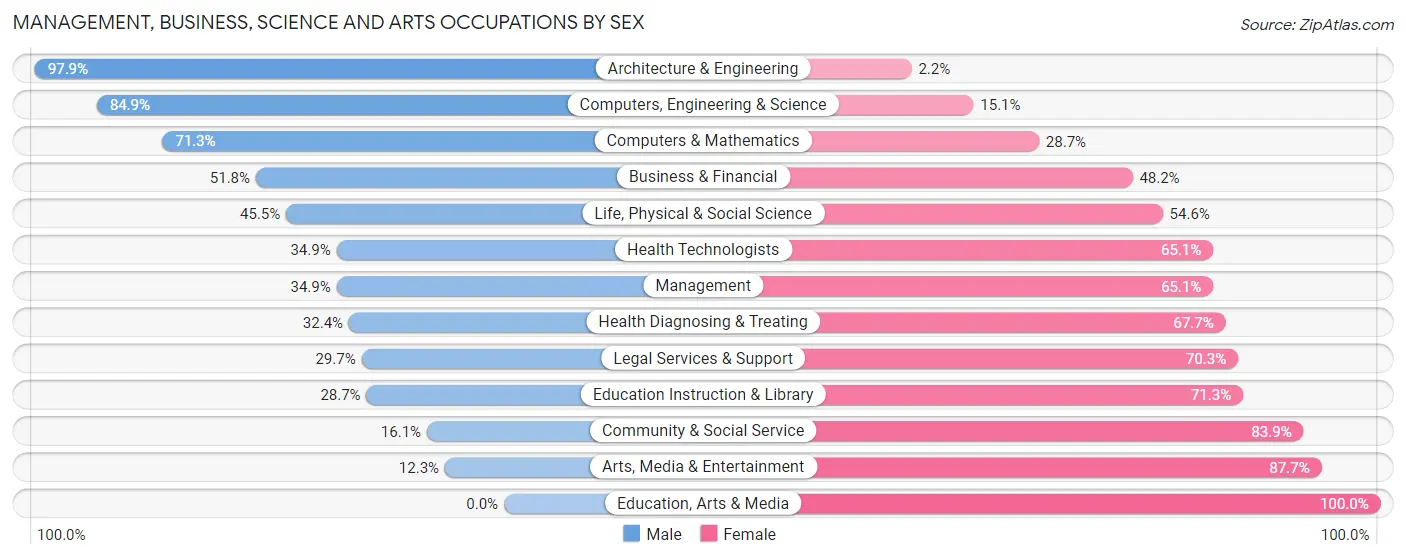
| Occupation | Male | Female |
| Management | 256 (34.9%) | 477 (65.1%) |
| Business & Financial | 279 (51.8%) | 260 (48.2%) |
| Computers, Engineering & Science | 468 (84.9%) | 83 (15.1%) |
| Computers & Mathematics | 129 (71.3%) | 52 (28.7%) |
| Architecture & Engineering | 319 (97.9%) | 7 (2.1%) |
| Life, Physical & Social Science | 20 (45.5%) | 24 (54.5%) |
| Community & Social Service | 96 (16.1%) | 501 (83.9%) |
| Education, Arts & Media | 0 (0.0%) | 185 (100.0%) |
| Legal Services & Support | 11 (29.7%) | 26 (70.3%) |
| Education Instruction & Library | 68 (28.7%) | 169 (71.3%) |
| Arts, Media & Entertainment | 17 (12.3%) | 121 (87.7%) |
| Health Diagnosing & Treating | 121 (32.4%) | 253 (67.6%) |
| Health Technologists | 87 (34.9%) | 162 (65.1%) |
| Total (Category) | 1,220 (43.7%) | 1,574 (56.3%) |
| Total (Overall) | 5,248 (52.6%) | 4,725 (47.4%) |
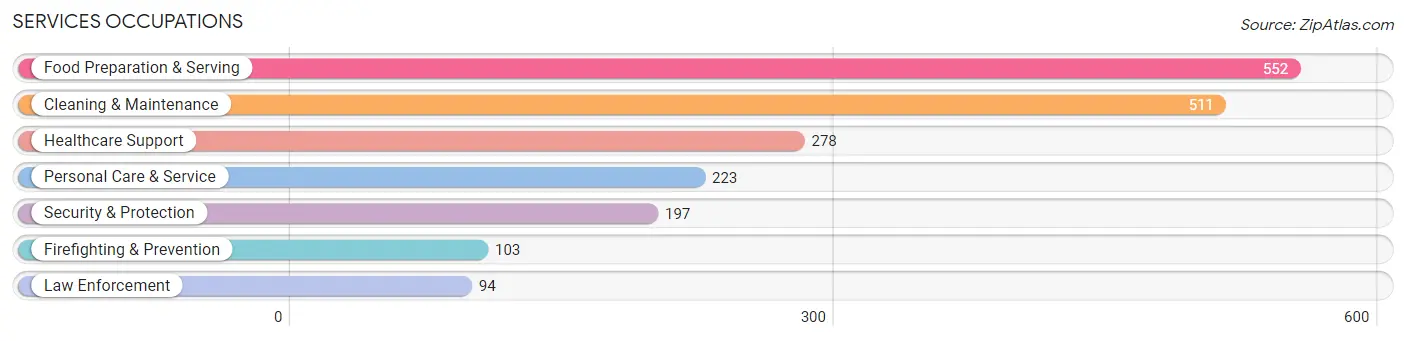
Services Occupations
The most common Services occupations in Menasha are Food Preparation & Serving (552 | 5.5%), Cleaning & Maintenance (511 | 5.1%), Healthcare Support (278 | 2.8%), Personal Care & Service (223 | 2.2%), and Security & Protection (197 | 2.0%).
Services Occupations by Sex
Within the Services occupations in Menasha, the most male-oriented occupations are Law Enforcement (100.0%), Security & Protection (74.1%), and Cleaning & Maintenance (57.9%), while the most female-oriented occupations are Healthcare Support (83.8%), Personal Care & Service (75.8%), and Food Preparation & Serving (53.3%).
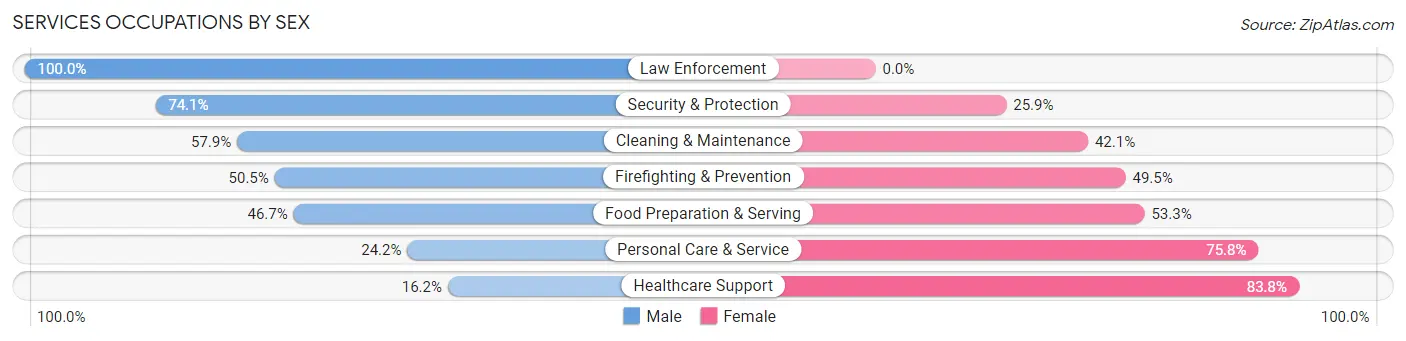
| Occupation | Male | Female |
| Healthcare Support | 45 (16.2%) | 233 (83.8%) |
| Security & Protection | 146 (74.1%) | 51 (25.9%) |
| Firefighting & Prevention | 52 (50.5%) | 51 (49.5%) |
| Law Enforcement | 94 (100.0%) | 0 (0.0%) |
| Food Preparation & Serving | 258 (46.7%) | 294 (53.3%) |
| Cleaning & Maintenance | 296 (57.9%) | 215 (42.1%) |
| Personal Care & Service | 54 (24.2%) | 169 (75.8%) |
| Total (Category) | 799 (45.4%) | 962 (54.6%) |
| Total (Overall) | 5,248 (52.6%) | 4,725 (47.4%) |
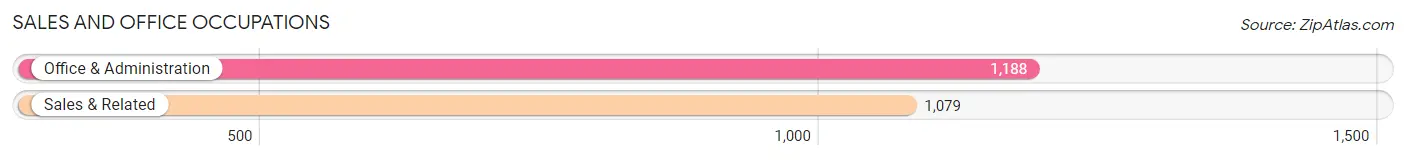
Sales and Office Occupations
The most common Sales and Office occupations in Menasha are Office & Administration (1,188 | 11.9%), and Sales & Related (1,079 | 10.8%).
Sales and Office Occupations by Sex

| Occupation | Male | Female |
| Sales & Related | 474 (43.9%) | 605 (56.1%) |
| Office & Administration | 171 (14.4%) | 1,017 (85.6%) |
| Total (Category) | 645 (28.4%) | 1,622 (71.6%) |
| Total (Overall) | 5,248 (52.6%) | 4,725 (47.4%) |
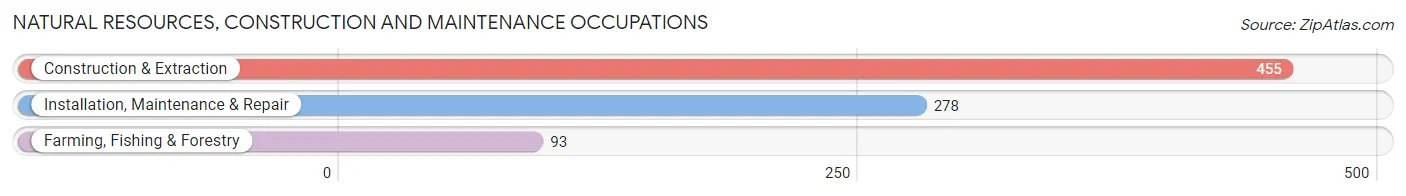
Natural Resources, Construction and Maintenance Occupations
The most common Natural Resources, Construction and Maintenance occupations in Menasha are Construction & Extraction (455 | 4.6%), Installation, Maintenance & Repair (278 | 2.8%), and Farming, Fishing & Forestry (93 | 0.9%).
Natural Resources, Construction and Maintenance Occupations by Sex
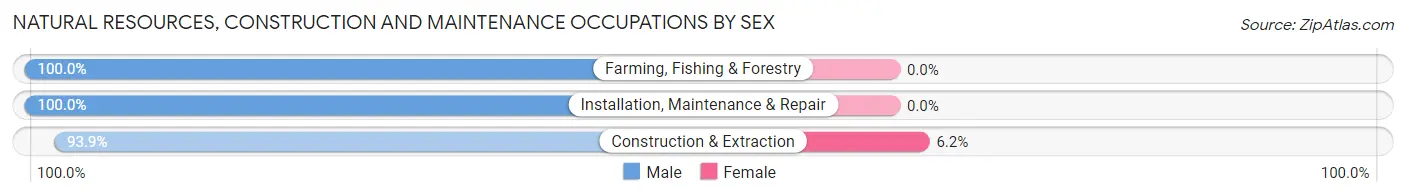
| Occupation | Male | Female |
| Farming, Fishing & Forestry | 93 (100.0%) | 0 (0.0%) |
| Construction & Extraction | 427 (93.9%) | 28 (6.1%) |
| Installation, Maintenance & Repair | 278 (100.0%) | 0 (0.0%) |
| Total (Category) | 798 (96.6%) | 28 (3.4%) |
| Total (Overall) | 5,248 (52.6%) | 4,725 (47.4%) |
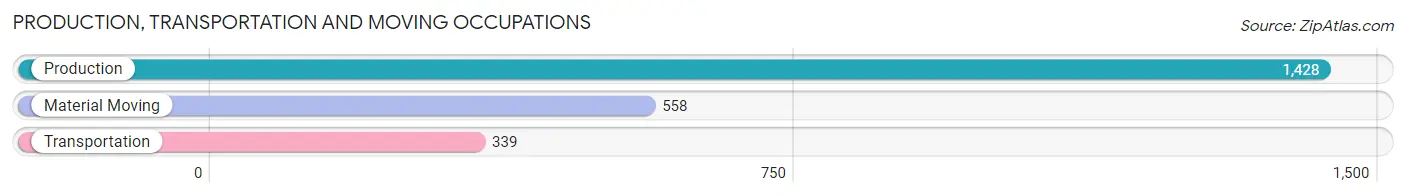
Production, Transportation and Moving Occupations
The most common Production, Transportation and Moving occupations in Menasha are Production (1,428 | 14.3%), Material Moving (558 | 5.6%), and Transportation (339 | 3.4%).
Production, Transportation and Moving Occupations by Sex
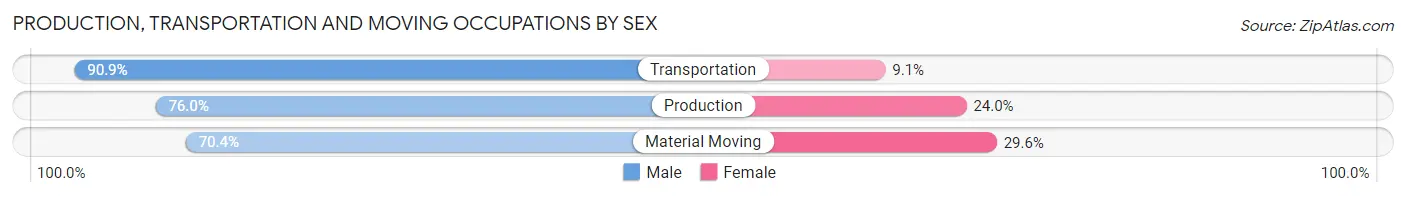
| Occupation | Male | Female |
| Production | 1,085 (76.0%) | 343 (24.0%) |
| Transportation | 308 (90.9%) | 31 (9.1%) |
| Material Moving | 393 (70.4%) | 165 (29.6%) |
| Total (Category) | 1,786 (76.8%) | 539 (23.2%) |
| Total (Overall) | 5,248 (52.6%) | 4,725 (47.4%) |
Employment Industries by Sex in Menasha
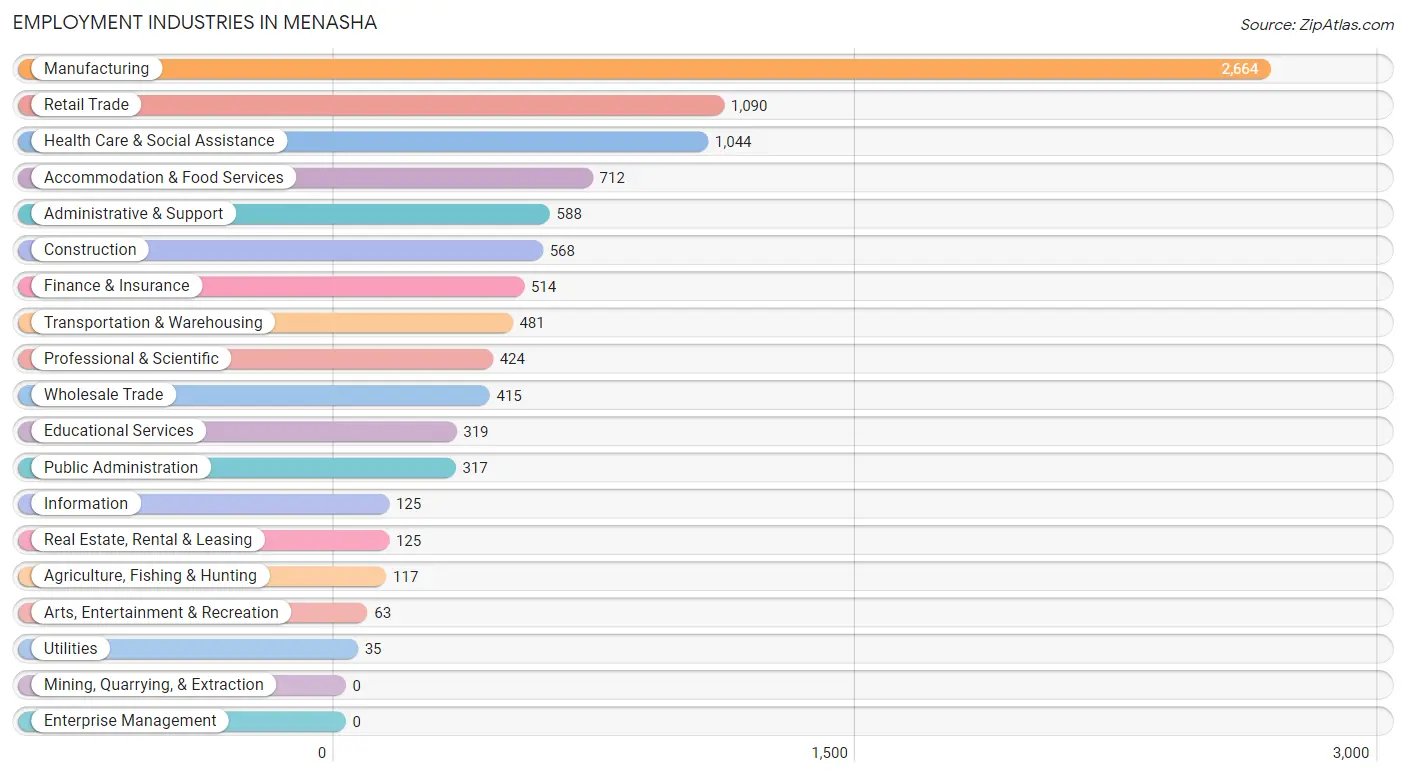
Employment Industries in Menasha
The major employment industries in Menasha include Manufacturing (2,664 | 26.7%), Retail Trade (1,090 | 10.9%), Health Care & Social Assistance (1,044 | 10.5%), Accommodation & Food Services (712 | 7.1%), and Administrative & Support (588 | 5.9%).
Employment Industries by Sex in Menasha
The Menasha industries that see more men than women are Utilities (100.0%), Construction (90.7%), and Agriculture, Fishing & Hunting (79.5%), whereas the industries that tend to have a higher number of women are Real Estate, Rental & Leasing (89.6%), Finance & Insurance (78.8%), and Educational Services (78.7%).
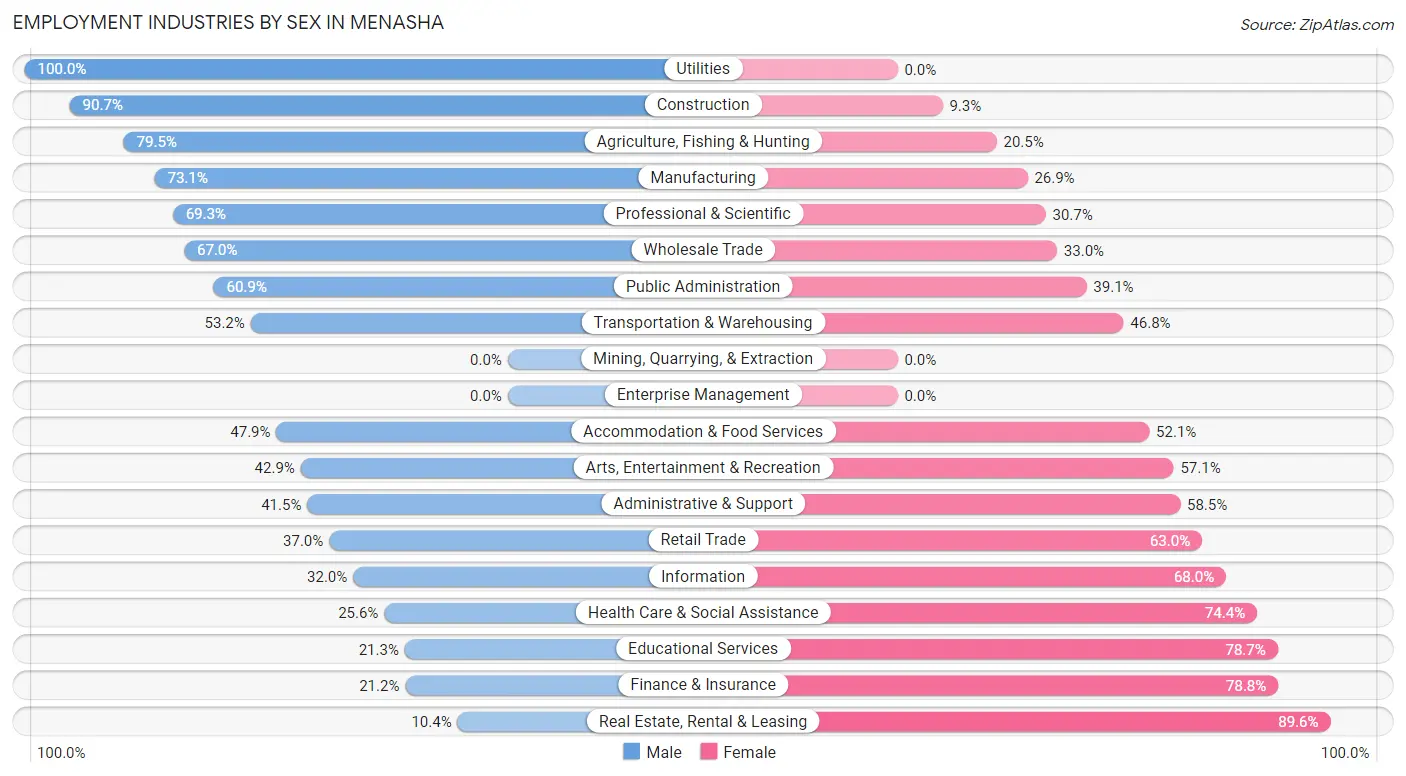
| Industry | Male | Female |
| Agriculture, Fishing & Hunting | 93 (79.5%) | 24 (20.5%) |
| Mining, Quarrying, & Extraction | 0 (0.0%) | 0 (0.0%) |
| Construction | 515 (90.7%) | 53 (9.3%) |
| Manufacturing | 1,947 (73.1%) | 717 (26.9%) |
| Wholesale Trade | 278 (67.0%) | 137 (33.0%) |
| Retail Trade | 403 (37.0%) | 687 (63.0%) |
| Transportation & Warehousing | 256 (53.2%) | 225 (46.8%) |
| Utilities | 35 (100.0%) | 0 (0.0%) |
| Information | 40 (32.0%) | 85 (68.0%) |
| Finance & Insurance | 109 (21.2%) | 405 (78.8%) |
| Real Estate, Rental & Leasing | 13 (10.4%) | 112 (89.6%) |
| Professional & Scientific | 294 (69.3%) | 130 (30.7%) |
| Enterprise Management | 0 (0.0%) | 0 (0.0%) |
| Administrative & Support | 244 (41.5%) | 344 (58.5%) |
| Educational Services | 68 (21.3%) | 251 (78.7%) |
| Health Care & Social Assistance | 267 (25.6%) | 777 (74.4%) |
| Arts, Entertainment & Recreation | 27 (42.9%) | 36 (57.1%) |
| Accommodation & Food Services | 341 (47.9%) | 371 (52.1%) |
| Public Administration | 193 (60.9%) | 124 (39.1%) |
| Total | 5,248 (52.6%) | 4,725 (47.4%) |
Education in Menasha
School Enrollment in Menasha
The most common levels of schooling among the 4,553 students in Menasha are elementary school (1,032 | 22.7%), college / undergraduate (921 | 20.2%), and high school (879 | 19.3%).
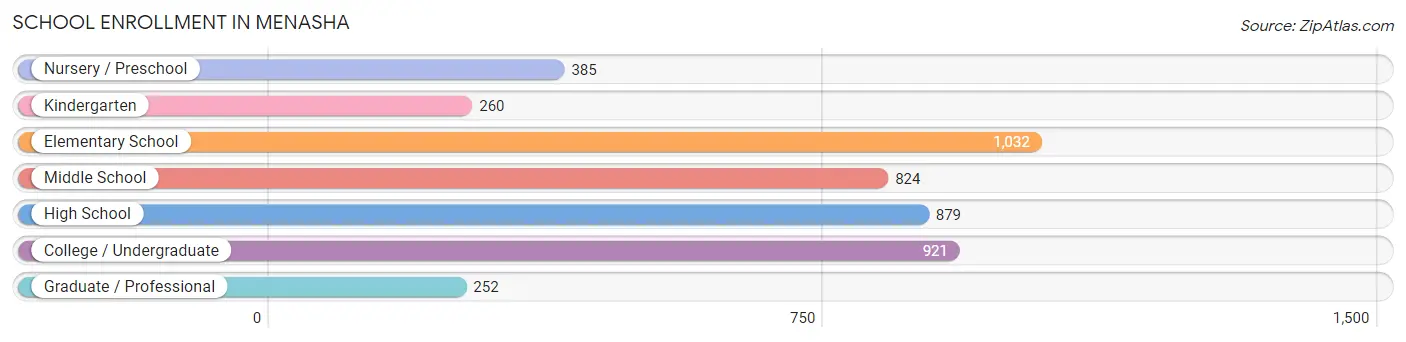
| School Level | # Students | % Students |
| Nursery / Preschool | 385 | 8.5% |
| Kindergarten | 260 | 5.7% |
| Elementary School | 1,032 | 22.7% |
| Middle School | 824 | 18.1% |
| High School | 879 | 19.3% |
| College / Undergraduate | 921 | 20.2% |
| Graduate / Professional | 252 | 5.5% |
| Total | 4,553 | 100.0% |
School Enrollment by Age by Funding Source in Menasha
Out of a total of 4,553 students who are enrolled in schools in Menasha, 578 (12.7%) attend a private institution, while the remaining 3,975 (87.3%) are enrolled in public schools. The age group of 20 to 24 year olds has the highest likelihood of being enrolled in private schools, with 117 (43.0% in the age bracket) enrolled. Conversely, the age group of 3 to 4 year olds has the lowest likelihood of being enrolled in a private school, with 121 (100.0% in the age bracket) attending a public institution.
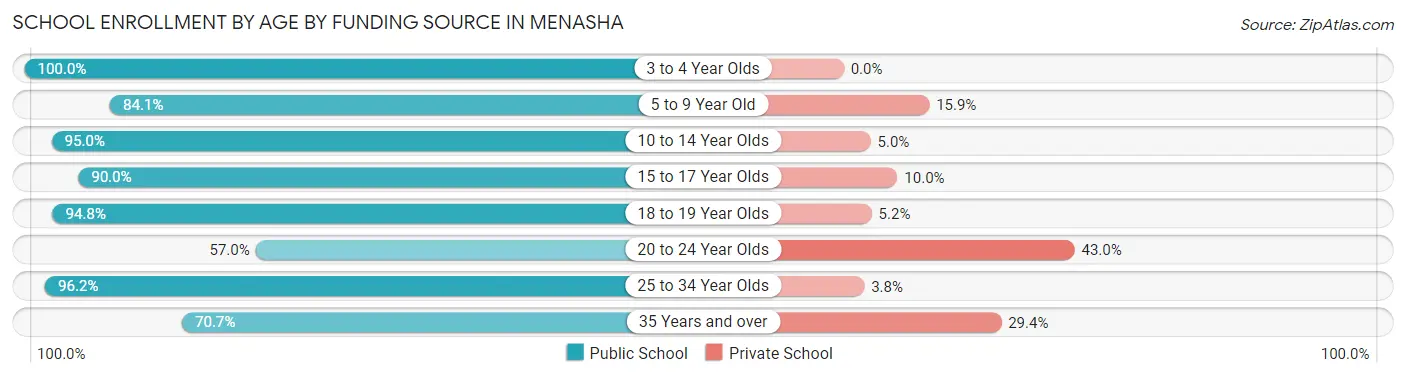
| Age Bracket | Public School | Private School |
| 3 to 4 Year Olds | 121 (100.0%) | 0 (0.0%) |
| 5 to 9 Year Old | 1,187 (84.1%) | 225 (15.9%) |
| 10 to 14 Year Olds | 983 (95.0%) | 52 (5.0%) |
| 15 to 17 Year Olds | 611 (90.0%) | 68 (10.0%) |
| 18 to 19 Year Olds | 273 (94.8%) | 15 (5.2%) |
| 20 to 24 Year Olds | 155 (57.0%) | 117 (43.0%) |
| 25 to 34 Year Olds | 452 (96.2%) | 18 (3.8%) |
| 35 Years and over | 195 (70.7%) | 81 (29.3%) |
| Total | 3,975 (87.3%) | 578 (12.7%) |
Educational Attainment by Field of Study in Menasha
Business (648 | 21.6%), education (317 | 10.6%), bio, nature & agricultural (315 | 10.5%), science & technology (298 | 9.9%), and arts & humanities (251 | 8.4%) are the most common fields of study among 2,997 individuals in Menasha who have obtained a bachelor's degree or higher.
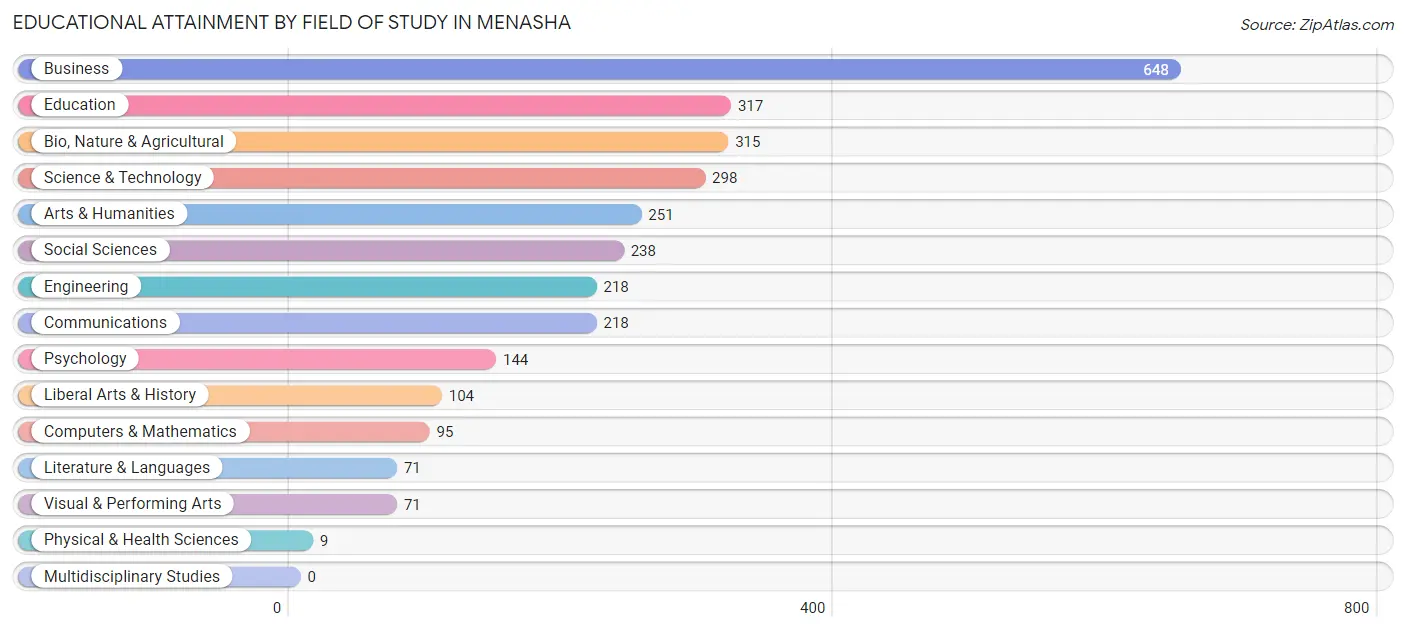
| Field of Study | # Graduates | % Graduates |
| Computers & Mathematics | 95 | 3.2% |
| Bio, Nature & Agricultural | 315 | 10.5% |
| Physical & Health Sciences | 9 | 0.3% |
| Psychology | 144 | 4.8% |
| Social Sciences | 238 | 7.9% |
| Engineering | 218 | 7.3% |
| Multidisciplinary Studies | 0 | 0.0% |
| Science & Technology | 298 | 9.9% |
| Business | 648 | 21.6% |
| Education | 317 | 10.6% |
| Literature & Languages | 71 | 2.4% |
| Liberal Arts & History | 104 | 3.5% |
| Visual & Performing Arts | 71 | 2.4% |
| Communications | 218 | 7.3% |
| Arts & Humanities | 251 | 8.4% |
| Total | 2,997 | 100.0% |
Transportation & Commute in Menasha
Vehicle Availability by Sex in Menasha
The most prevalent vehicle ownership categories in Menasha are males with 2 vehicles (2,264, accounting for 44.5%) and females with 2 vehicles (2,090, making up 48.2%).
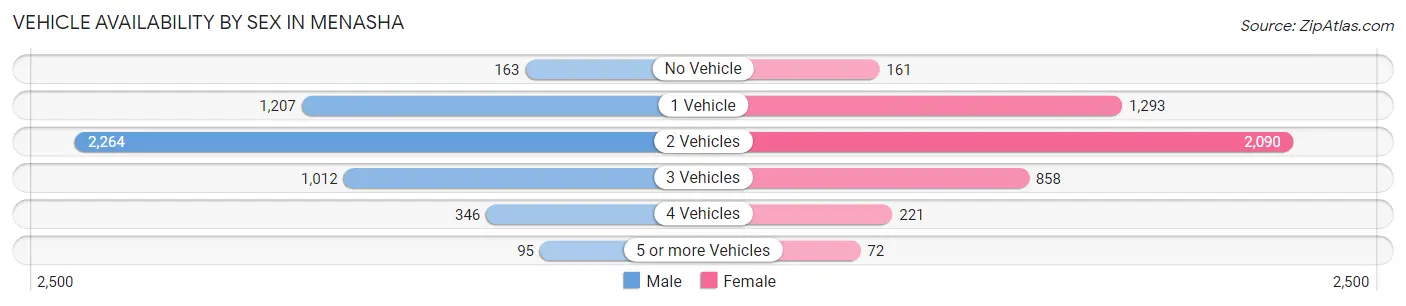
| Vehicles Available | Male | Female |
| No Vehicle | 163 (3.2%) | 161 (3.4%) |
| 1 Vehicle | 1,207 (23.7%) | 1,293 (27.5%) |
| 2 Vehicles | 2,264 (44.5%) | 2,090 (44.5%) |
| 3 Vehicles | 1,012 (19.9%) | 858 (18.3%) |
| 4 Vehicles | 346 (6.8%) | 221 (4.7%) |
| 5 or more Vehicles | 95 (1.9%) | 72 (1.5%) |
| Total | 5,087 (100.0%) | 4,695 (100.0%) |
Commute Time in Menasha
The most frequently occuring commute durations in Menasha are 15 to 19 minutes (2,492 commuters, 28.2%), 10 to 14 minutes (1,671 commuters, 18.9%), and 20 to 24 minutes (1,256 commuters, 14.2%).
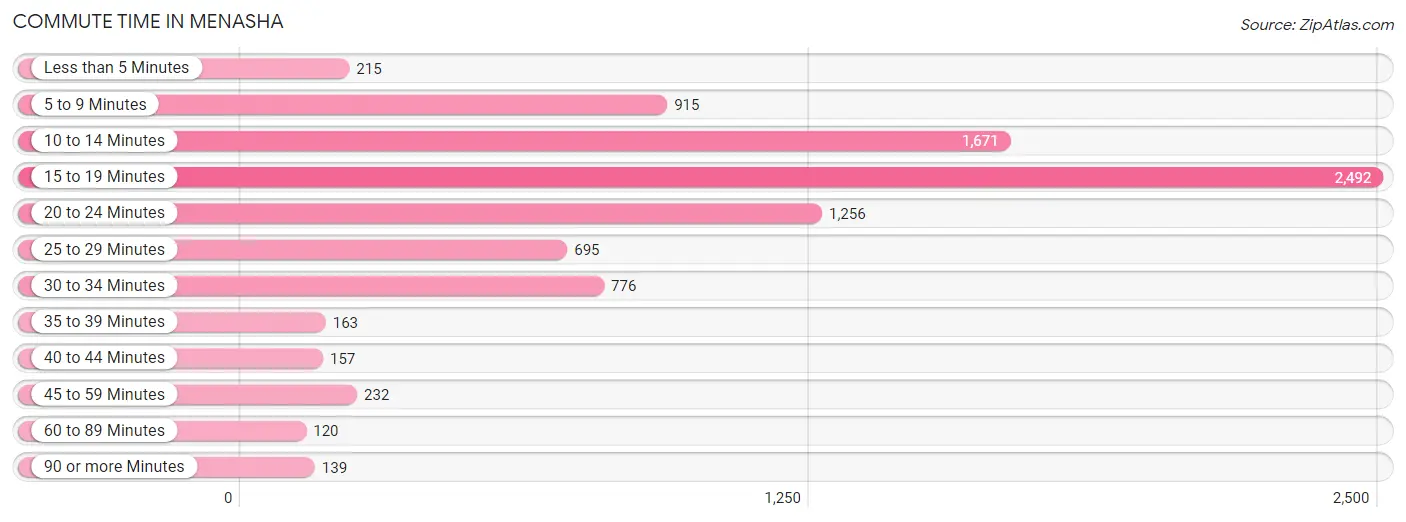
| Commute Time | # Commuters | % Commuters |
| Less than 5 Minutes | 215 | 2.4% |
| 5 to 9 Minutes | 915 | 10.4% |
| 10 to 14 Minutes | 1,671 | 18.9% |
| 15 to 19 Minutes | 2,492 | 28.2% |
| 20 to 24 Minutes | 1,256 | 14.2% |
| 25 to 29 Minutes | 695 | 7.9% |
| 30 to 34 Minutes | 776 | 8.8% |
| 35 to 39 Minutes | 163 | 1.8% |
| 40 to 44 Minutes | 157 | 1.8% |
| 45 to 59 Minutes | 232 | 2.6% |
| 60 to 89 Minutes | 120 | 1.4% |
| 90 or more Minutes | 139 | 1.6% |
Commute Time by Sex in Menasha
The most common commute times in Menasha are 15 to 19 minutes (1,216 commuters, 25.6%) for males and 15 to 19 minutes (1,276 commuters, 31.3%) for females.
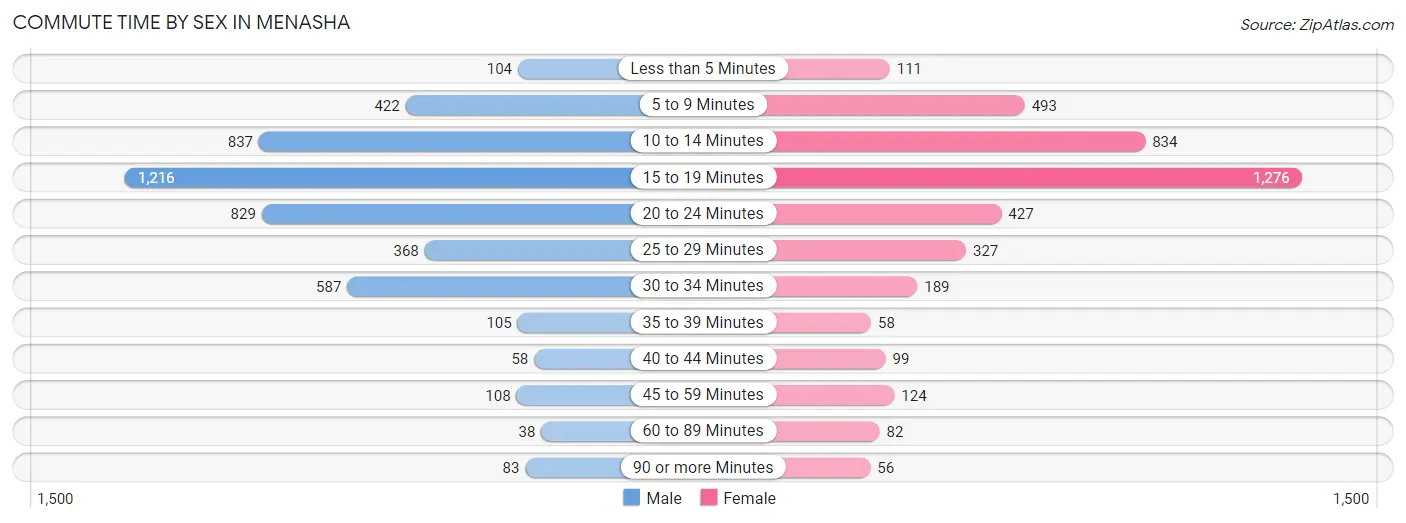
| Commute Time | Male | Female |
| Less than 5 Minutes | 104 (2.2%) | 111 (2.7%) |
| 5 to 9 Minutes | 422 (8.9%) | 493 (12.1%) |
| 10 to 14 Minutes | 837 (17.6%) | 834 (20.5%) |
| 15 to 19 Minutes | 1,216 (25.6%) | 1,276 (31.3%) |
| 20 to 24 Minutes | 829 (17.4%) | 427 (10.5%) |
| 25 to 29 Minutes | 368 (7.7%) | 327 (8.0%) |
| 30 to 34 Minutes | 587 (12.3%) | 189 (4.6%) |
| 35 to 39 Minutes | 105 (2.2%) | 58 (1.4%) |
| 40 to 44 Minutes | 58 (1.2%) | 99 (2.4%) |
| 45 to 59 Minutes | 108 (2.3%) | 124 (3.0%) |
| 60 to 89 Minutes | 38 (0.8%) | 82 (2.0%) |
| 90 or more Minutes | 83 (1.8%) | 56 (1.4%) |
Time of Departure to Work by Sex in Menasha
The most frequent times of departure to work in Menasha are 12:00 AM to 4:59 AM (735, 15.5%) for males and 7:00 AM to 7:29 AM (707, 17.3%) for females.
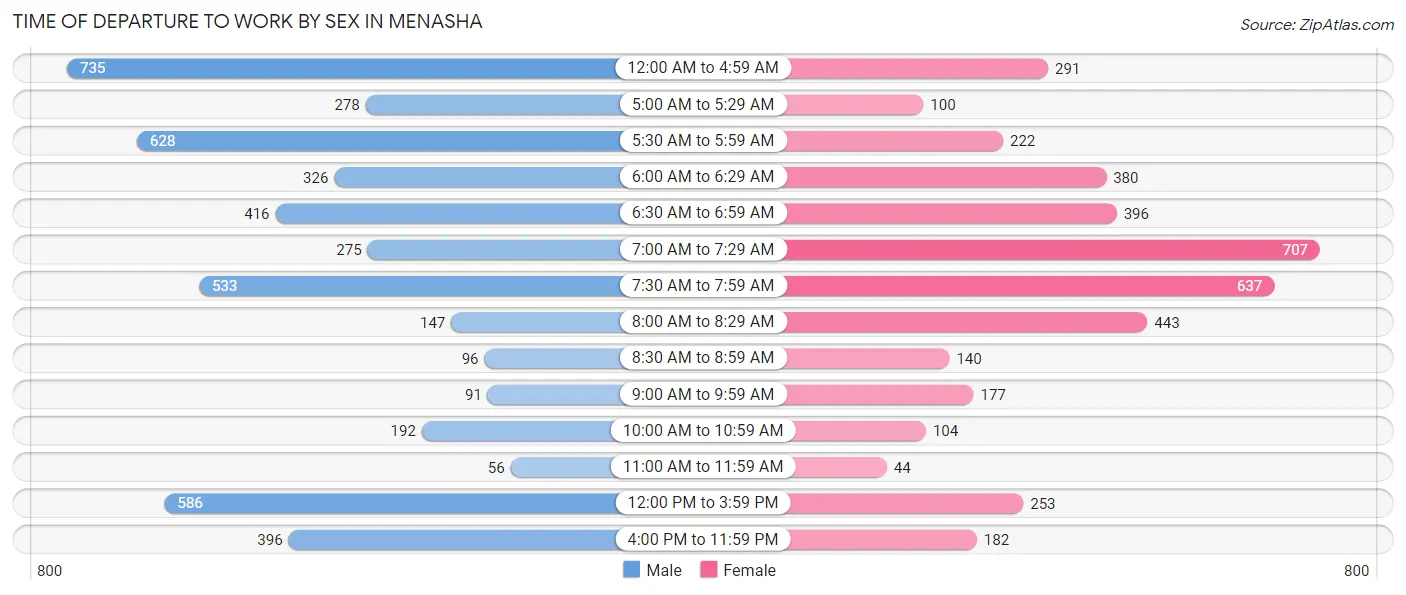
| Time of Departure | Male | Female |
| 12:00 AM to 4:59 AM | 735 (15.5%) | 291 (7.1%) |
| 5:00 AM to 5:29 AM | 278 (5.9%) | 100 (2.5%) |
| 5:30 AM to 5:59 AM | 628 (13.2%) | 222 (5.4%) |
| 6:00 AM to 6:29 AM | 326 (6.9%) | 380 (9.3%) |
| 6:30 AM to 6:59 AM | 416 (8.7%) | 396 (9.7%) |
| 7:00 AM to 7:29 AM | 275 (5.8%) | 707 (17.3%) |
| 7:30 AM to 7:59 AM | 533 (11.2%) | 637 (15.6%) |
| 8:00 AM to 8:29 AM | 147 (3.1%) | 443 (10.9%) |
| 8:30 AM to 8:59 AM | 96 (2.0%) | 140 (3.4%) |
| 9:00 AM to 9:59 AM | 91 (1.9%) | 177 (4.3%) |
| 10:00 AM to 10:59 AM | 192 (4.0%) | 104 (2.5%) |
| 11:00 AM to 11:59 AM | 56 (1.2%) | 44 (1.1%) |
| 12:00 PM to 3:59 PM | 586 (12.3%) | 253 (6.2%) |
| 4:00 PM to 11:59 PM | 396 (8.3%) | 182 (4.5%) |
| Total | 4,755 (100.0%) | 4,076 (100.0%) |
Housing Occupancy in Menasha
Occupancy by Ownership in Menasha
Of the total 8,022 dwellings in Menasha, owner-occupied units account for 5,152 (64.2%), while renter-occupied units make up 2,870 (35.8%).
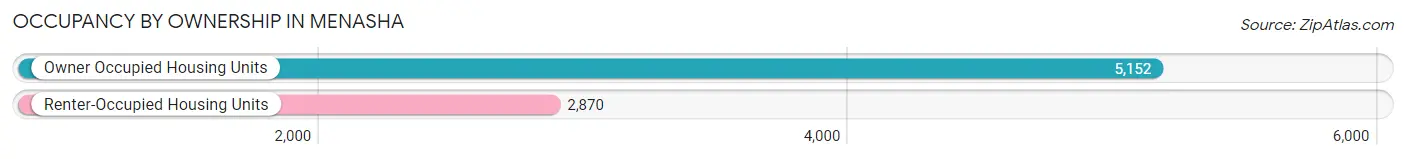
| Occupancy | # Housing Units | % Housing Units |
| Owner Occupied Housing Units | 5,152 | 64.2% |
| Renter-Occupied Housing Units | 2,870 | 35.8% |
| Total Occupied Housing Units | 8,022 | 100.0% |
Occupancy by Household Size in Menasha
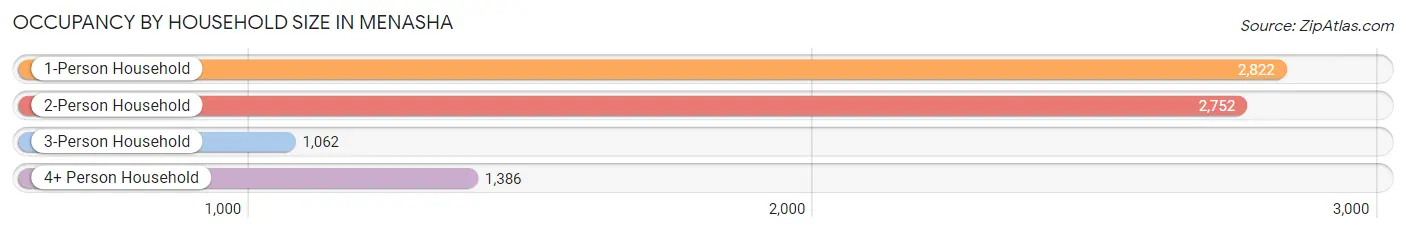
| Household Size | # Housing Units | % Housing Units |
| 1-Person Household | 2,822 | 35.2% |
| 2-Person Household | 2,752 | 34.3% |
| 3-Person Household | 1,062 | 13.2% |
| 4+ Person Household | 1,386 | 17.3% |
| Total Housing Units | 8,022 | 100.0% |
Occupancy by Ownership by Household Size in Menasha
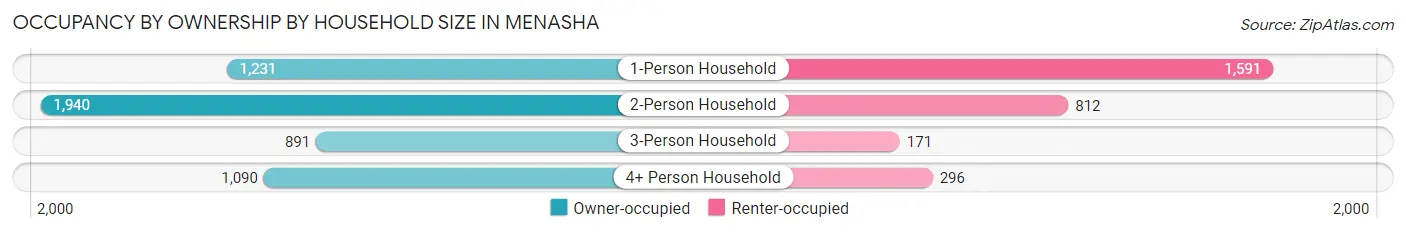
| Household Size | Owner-occupied | Renter-occupied |
| 1-Person Household | 1,231 (43.6%) | 1,591 (56.4%) |
| 2-Person Household | 1,940 (70.5%) | 812 (29.5%) |
| 3-Person Household | 891 (83.9%) | 171 (16.1%) |
| 4+ Person Household | 1,090 (78.6%) | 296 (21.4%) |
| Total Housing Units | 5,152 (64.2%) | 2,870 (35.8%) |
Occupancy by Educational Attainment in Menasha
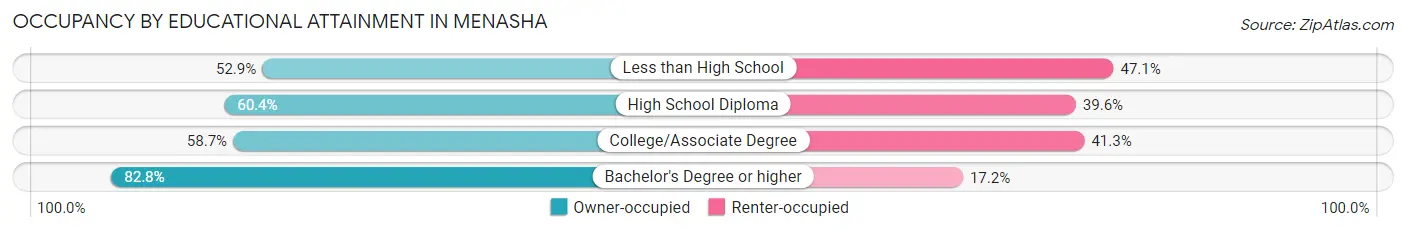
| Household Size | Owner-occupied | Renter-occupied |
| Less than High School | 271 (52.9%) | 241 (47.1%) |
| High School Diploma | 1,429 (60.4%) | 937 (39.6%) |
| College/Associate Degree | 1,966 (58.7%) | 1,383 (41.3%) |
| Bachelor's Degree or higher | 1,486 (82.8%) | 309 (17.2%) |
Occupancy by Age of Householder in Menasha
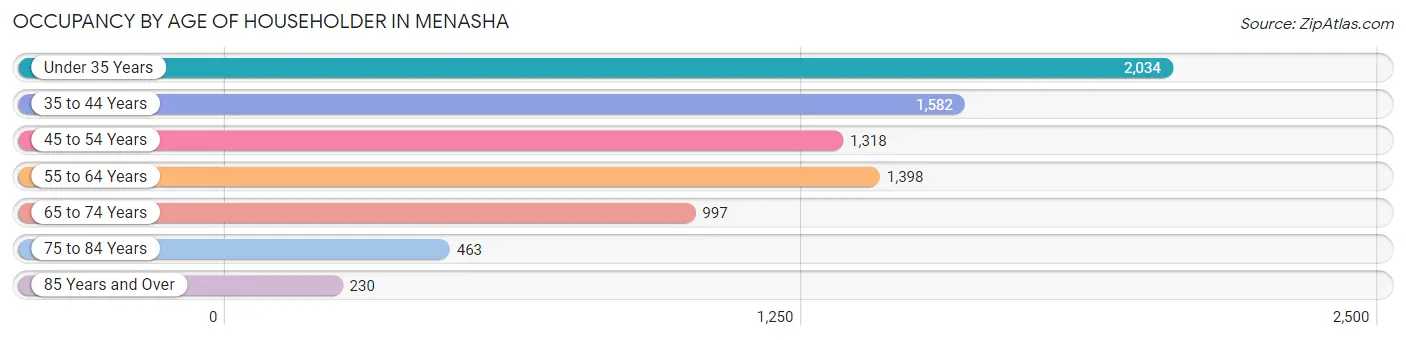
| Age Bracket | # Households | % Households |
| Under 35 Years | 2,034 | 25.4% |
| 35 to 44 Years | 1,582 | 19.7% |
| 45 to 54 Years | 1,318 | 16.4% |
| 55 to 64 Years | 1,398 | 17.4% |
| 65 to 74 Years | 997 | 12.4% |
| 75 to 84 Years | 463 | 5.8% |
| 85 Years and Over | 230 | 2.9% |
| Total | 8,022 | 100.0% |
Housing Finances in Menasha
Median Income by Occupancy in Menasha
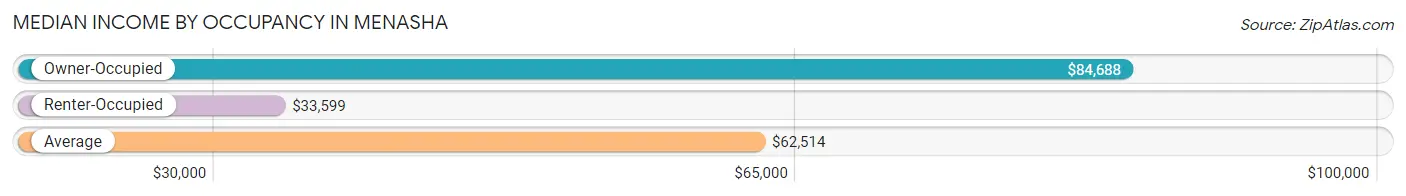
| Occupancy Type | # Households | Median Income |
| Owner-Occupied | 5,152 (64.2%) | $84,688 |
| Renter-Occupied | 2,870 (35.8%) | $33,599 |
| Average | 8,022 (100.0%) | $62,514 |
Occupancy by Householder Income Bracket in Menasha
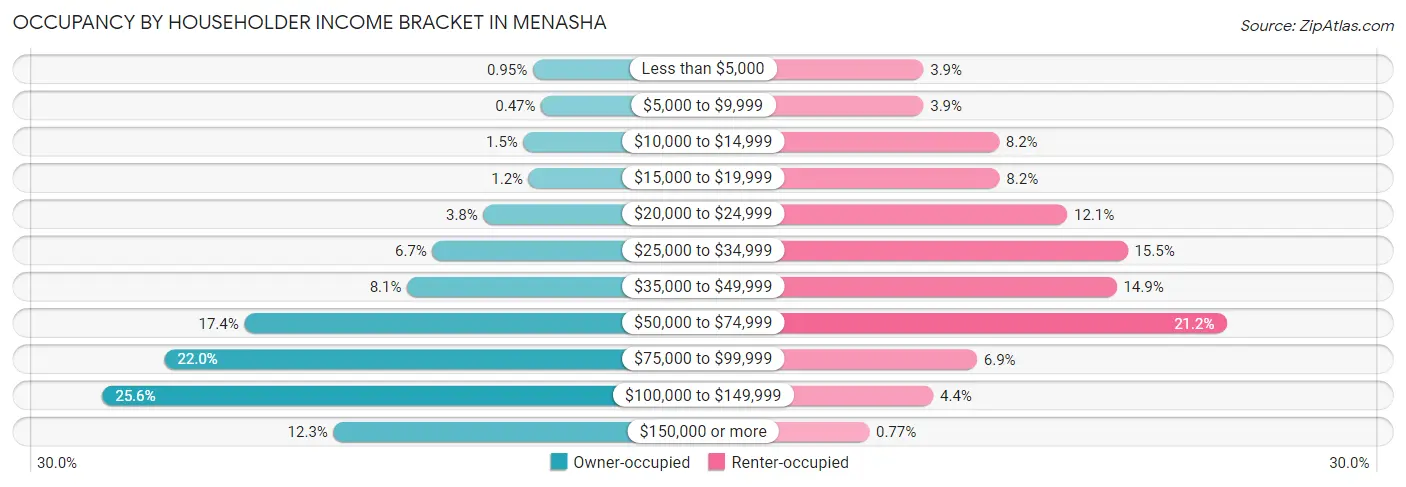
| Income Bracket | Owner-occupied | Renter-occupied |
| Less than $5,000 | 49 (0.9%) | 111 (3.9%) |
| $5,000 to $9,999 | 24 (0.5%) | 111 (3.9%) |
| $10,000 to $14,999 | 76 (1.5%) | 235 (8.2%) |
| $15,000 to $19,999 | 61 (1.2%) | 236 (8.2%) |
| $20,000 to $24,999 | 194 (3.8%) | 347 (12.1%) |
| $25,000 to $34,999 | 344 (6.7%) | 446 (15.5%) |
| $35,000 to $49,999 | 419 (8.1%) | 428 (14.9%) |
| $50,000 to $74,999 | 898 (17.4%) | 608 (21.2%) |
| $75,000 to $99,999 | 1,134 (22.0%) | 199 (6.9%) |
| $100,000 to $149,999 | 1,317 (25.6%) | 127 (4.4%) |
| $150,000 or more | 636 (12.3%) | 22 (0.8%) |
| Total | 5,152 (100.0%) | 2,870 (100.0%) |
Monthly Housing Cost Tiers in Menasha
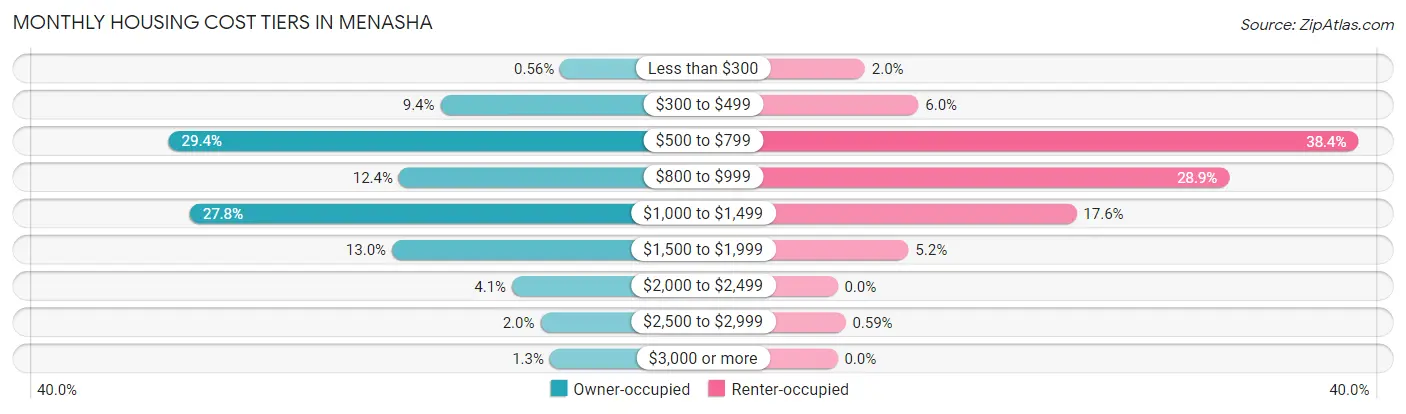
| Monthly Cost | Owner-occupied | Renter-occupied |
| Less than $300 | 29 (0.6%) | 58 (2.0%) |
| $300 to $499 | 483 (9.4%) | 171 (6.0%) |
| $500 to $799 | 1,514 (29.4%) | 1,101 (38.4%) |
| $800 to $999 | 641 (12.4%) | 828 (28.8%) |
| $1,000 to $1,499 | 1,434 (27.8%) | 505 (17.6%) |
| $1,500 to $1,999 | 667 (13.0%) | 150 (5.2%) |
| $2,000 to $2,499 | 212 (4.1%) | 0 (0.0%) |
| $2,500 to $2,999 | 104 (2.0%) | 17 (0.6%) |
| $3,000 or more | 68 (1.3%) | 0 (0.0%) |
| Total | 5,152 (100.0%) | 2,870 (100.0%) |
Physical Housing Characteristics in Menasha
Housing Structures in Menasha
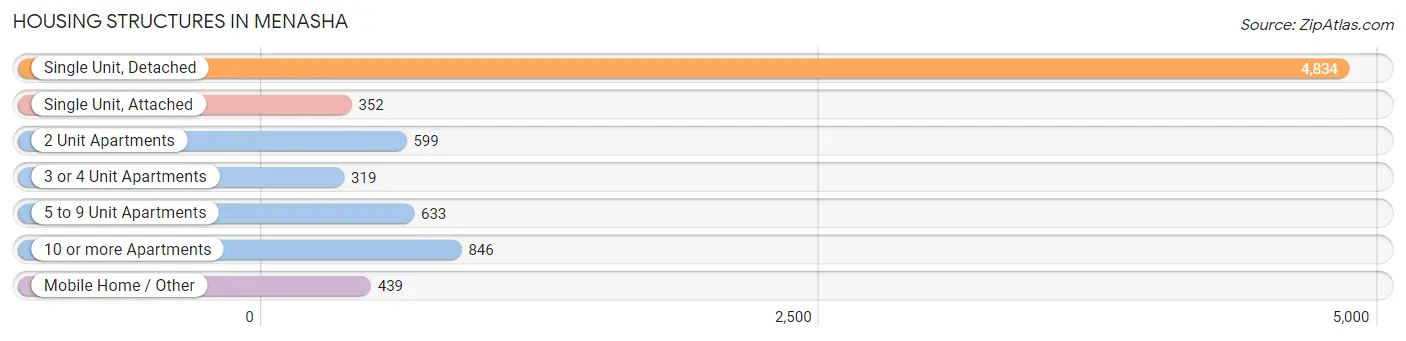
| Structure Type | # Housing Units | % Housing Units |
| Single Unit, Detached | 4,834 | 60.3% |
| Single Unit, Attached | 352 | 4.4% |
| 2 Unit Apartments | 599 | 7.5% |
| 3 or 4 Unit Apartments | 319 | 4.0% |
| 5 to 9 Unit Apartments | 633 | 7.9% |
| 10 or more Apartments | 846 | 10.5% |
| Mobile Home / Other | 439 | 5.5% |
| Total | 8,022 | 100.0% |
Housing Structures by Occupancy in Menasha
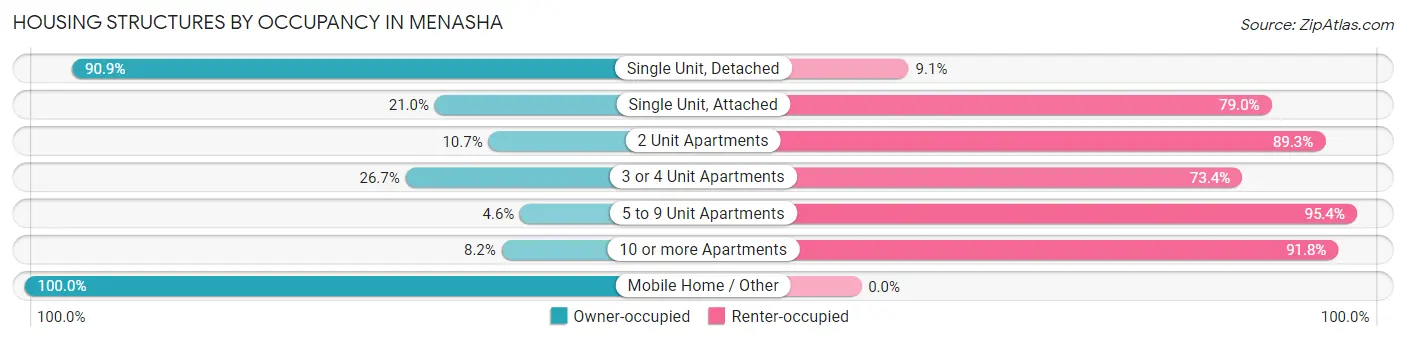
| Structure Type | Owner-occupied | Renter-occupied |
| Single Unit, Detached | 4,392 (90.9%) | 442 (9.1%) |
| Single Unit, Attached | 74 (21.0%) | 278 (79.0%) |
| 2 Unit Apartments | 64 (10.7%) | 535 (89.3%) |
| 3 or 4 Unit Apartments | 85 (26.7%) | 234 (73.4%) |
| 5 to 9 Unit Apartments | 29 (4.6%) | 604 (95.4%) |
| 10 or more Apartments | 69 (8.2%) | 777 (91.8%) |
| Mobile Home / Other | 439 (100.0%) | 0 (0.0%) |
| Total | 5,152 (64.2%) | 2,870 (35.8%) |
Housing Structures by Number of Rooms in Menasha
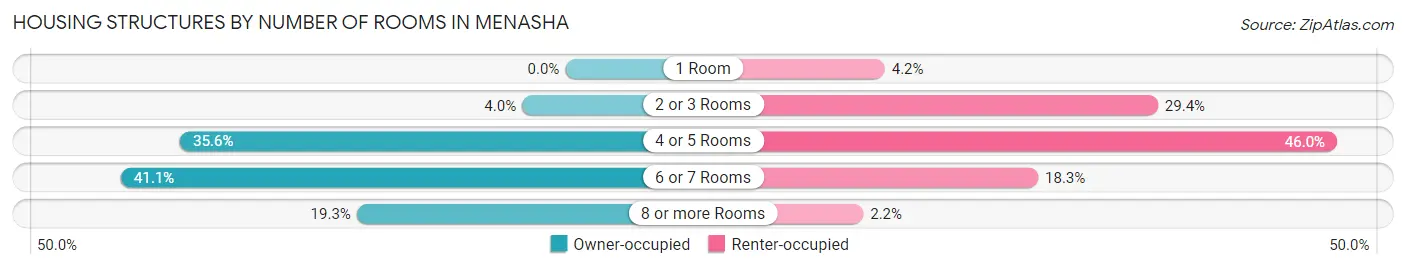
| Number of Rooms | Owner-occupied | Renter-occupied |
| 1 Room | 0 (0.0%) | 119 (4.2%) |
| 2 or 3 Rooms | 206 (4.0%) | 844 (29.4%) |
| 4 or 5 Rooms | 1,835 (35.6%) | 1,319 (46.0%) |
| 6 or 7 Rooms | 2,117 (41.1%) | 526 (18.3%) |
| 8 or more Rooms | 994 (19.3%) | 62 (2.2%) |
| Total | 5,152 (100.0%) | 2,870 (100.0%) |
Housing Structure by Heating Type in Menasha
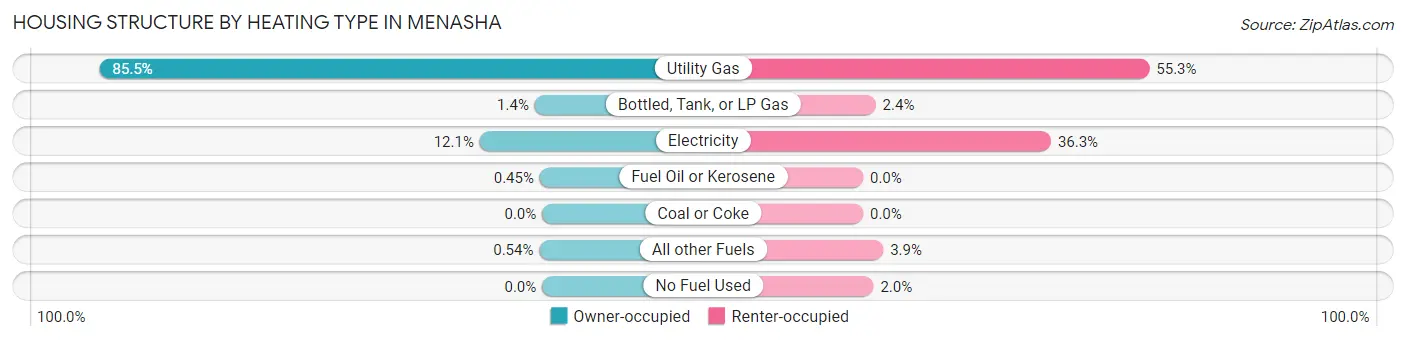
| Heating Type | Owner-occupied | Renter-occupied |
| Utility Gas | 4,407 (85.5%) | 1,588 (55.3%) |
| Bottled, Tank, or LP Gas | 73 (1.4%) | 70 (2.4%) |
| Electricity | 621 (12.0%) | 1,042 (36.3%) |
| Fuel Oil or Kerosene | 23 (0.4%) | 0 (0.0%) |
| Coal or Coke | 0 (0.0%) | 0 (0.0%) |
| All other Fuels | 28 (0.5%) | 112 (3.9%) |
| No Fuel Used | 0 (0.0%) | 58 (2.0%) |
| Total | 5,152 (100.0%) | 2,870 (100.0%) |
Household Vehicle Usage in Menasha
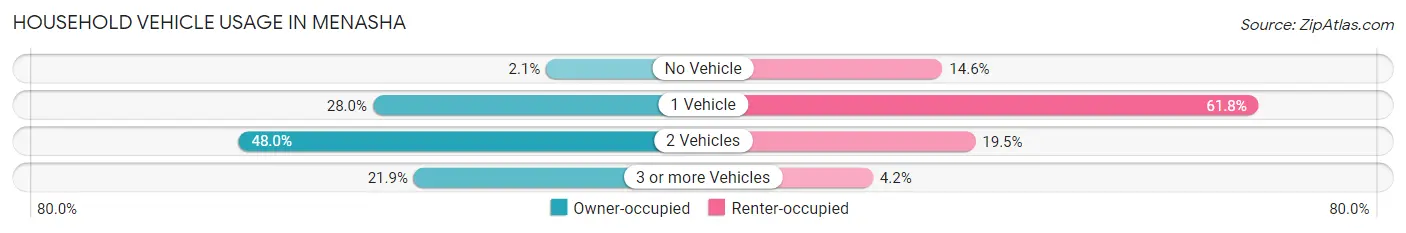
| Vehicles per Household | Owner-occupied | Renter-occupied |
| No Vehicle | 108 (2.1%) | 418 (14.6%) |
| 1 Vehicle | 1,442 (28.0%) | 1,773 (61.8%) |
| 2 Vehicles | 2,475 (48.0%) | 559 (19.5%) |
| 3 or more Vehicles | 1,127 (21.9%) | 120 (4.2%) |
| Total | 5,152 (100.0%) | 2,870 (100.0%) |
Real Estate & Mortgages in Menasha
Real Estate and Mortgage Overview in Menasha
| Characteristic | Without Mortgage | With Mortgage |
| Housing Units | 2,088 | 3,064 |
| Median Property Value | $142,600 | $165,700 |
| Median Household Income | $63,043 | $483 |
| Monthly Housing Costs | $570 | $68 |
| Real Estate Taxes | $3,076 | $46 |
Property Value by Mortgage Status in Menasha
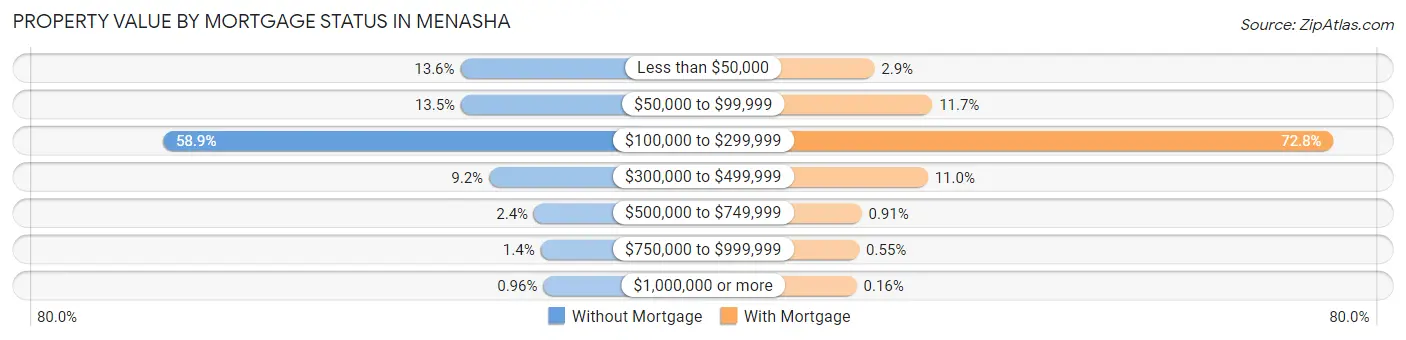
| Property Value | Without Mortgage | With Mortgage |
| Less than $50,000 | 284 (13.6%) | 88 (2.9%) |
| $50,000 to $99,999 | 282 (13.5%) | 358 (11.7%) |
| $100,000 to $299,999 | 1,230 (58.9%) | 2,231 (72.8%) |
| $300,000 to $499,999 | 193 (9.2%) | 337 (11.0%) |
| $500,000 to $749,999 | 50 (2.4%) | 28 (0.9%) |
| $750,000 to $999,999 | 29 (1.4%) | 17 (0.5%) |
| $1,000,000 or more | 20 (1.0%) | 5 (0.2%) |
| Total | 2,088 (100.0%) | 3,064 (100.0%) |
Household Income by Mortgage Status in Menasha
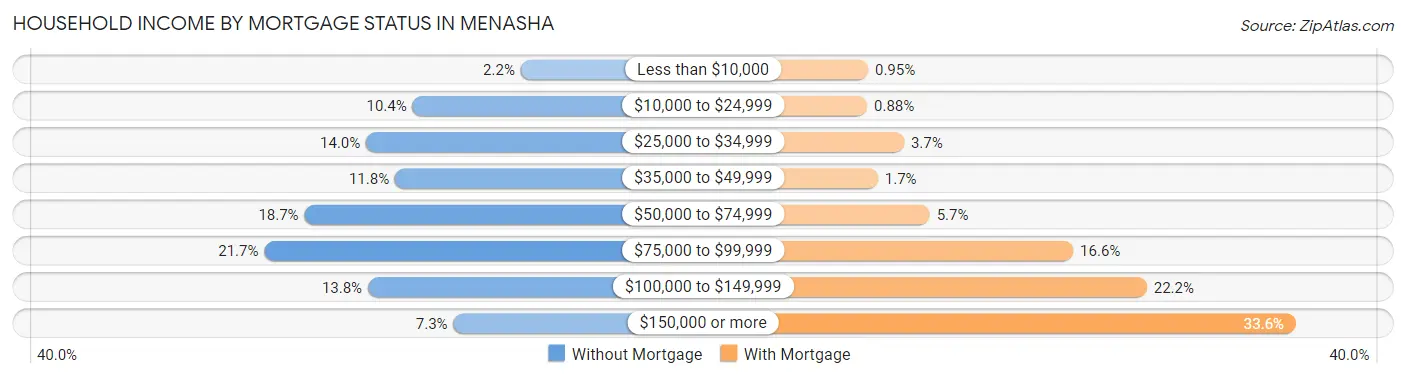
| Household Income | Without Mortgage | With Mortgage |
| Less than $10,000 | 46 (2.2%) | 29 (0.9%) |
| $10,000 to $24,999 | 218 (10.4%) | 27 (0.9%) |
| $25,000 to $34,999 | 292 (14.0%) | 113 (3.7%) |
| $35,000 to $49,999 | 246 (11.8%) | 52 (1.7%) |
| $50,000 to $74,999 | 390 (18.7%) | 173 (5.7%) |
| $75,000 to $99,999 | 454 (21.7%) | 508 (16.6%) |
| $100,000 to $149,999 | 289 (13.8%) | 680 (22.2%) |
| $150,000 or more | 153 (7.3%) | 1,028 (33.6%) |
| Total | 2,088 (100.0%) | 3,064 (100.0%) |
Property Value to Household Income Ratio in Menasha
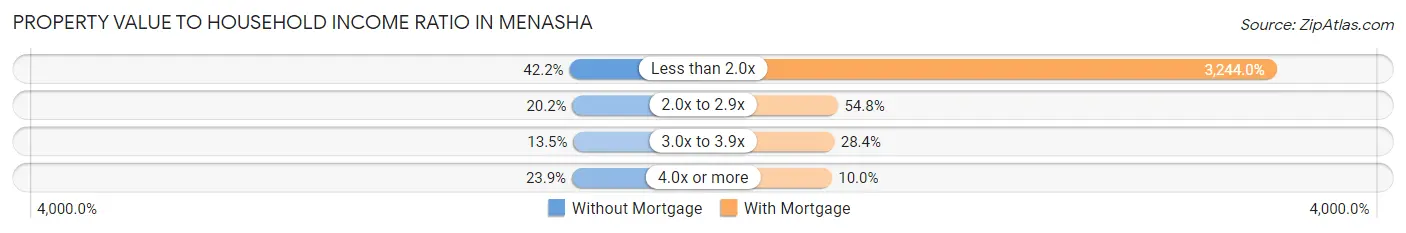
| Value-to-Income Ratio | Without Mortgage | With Mortgage |
| Less than 2.0x | 882 (42.2%) | 99,397 (3,244.0%) |
| 2.0x to 2.9x | 422 (20.2%) | 1,678 (54.8%) |
| 3.0x to 3.9x | 281 (13.5%) | 869 (28.4%) |
| 4.0x or more | 498 (23.8%) | 306 (10.0%) |
| Total | 2,088 (100.0%) | 3,064 (100.0%) |
Real Estate Taxes by Mortgage Status in Menasha
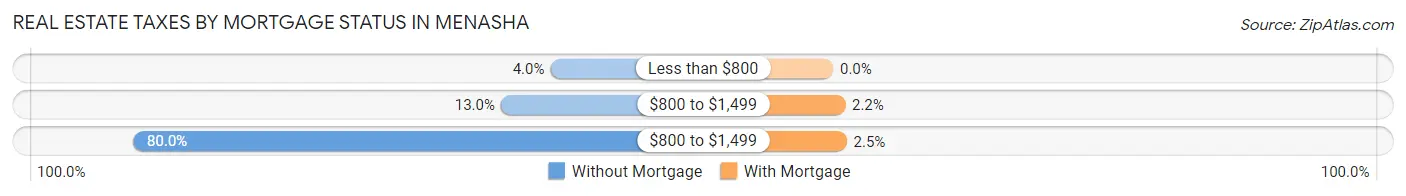
| Property Taxes | Without Mortgage | With Mortgage |
| Less than $800 | 83 (4.0%) | 0 (0.0%) |
| $800 to $1,499 | 272 (13.0%) | 67 (2.2%) |
| $800 to $1,499 | 1,671 (80.0%) | 76 (2.5%) |
| Total | 2,088 (100.0%) | 3,064 (100.0%) |
Health & Disability in Menasha
Health Insurance Coverage by Age in Menasha
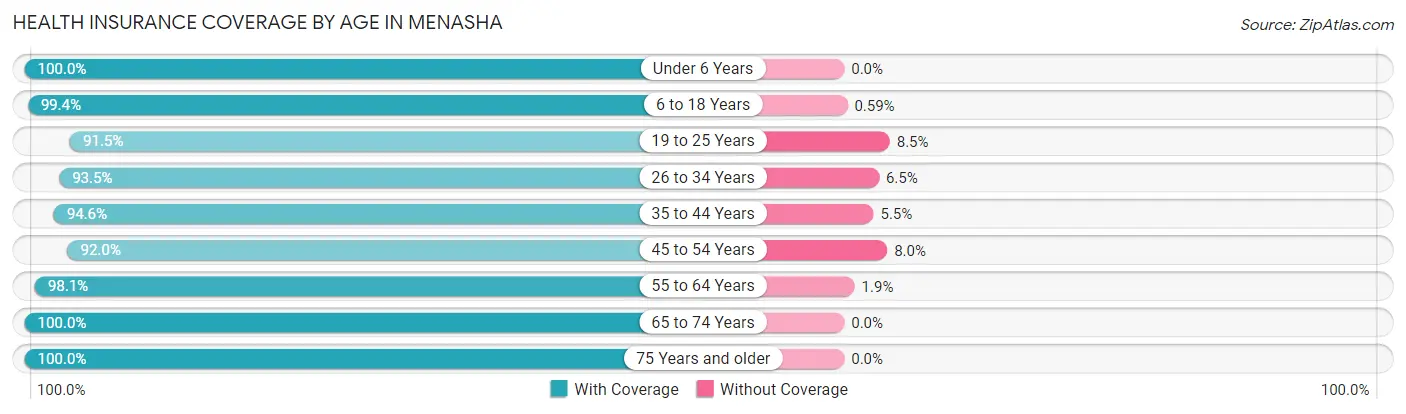
| Age Bracket | With Coverage | Without Coverage |
| Under 6 Years | 1,555 (100.0%) | 0 (0.0%) |
| 6 to 18 Years | 3,058 (99.4%) | 18 (0.6%) |
| 19 to 25 Years | 1,489 (91.5%) | 138 (8.5%) |
| 26 to 34 Years | 2,374 (93.5%) | 164 (6.5%) |
| 35 to 44 Years | 2,481 (94.6%) | 143 (5.4%) |
| 45 to 54 Years | 1,964 (92.0%) | 171 (8.0%) |
| 55 to 64 Years | 2,189 (98.1%) | 43 (1.9%) |
| 65 to 74 Years | 1,391 (100.0%) | 0 (0.0%) |
| 75 Years and older | 882 (100.0%) | 0 (0.0%) |
| Total | 17,383 (96.3%) | 677 (3.7%) |
Health Insurance Coverage by Citizenship Status in Menasha
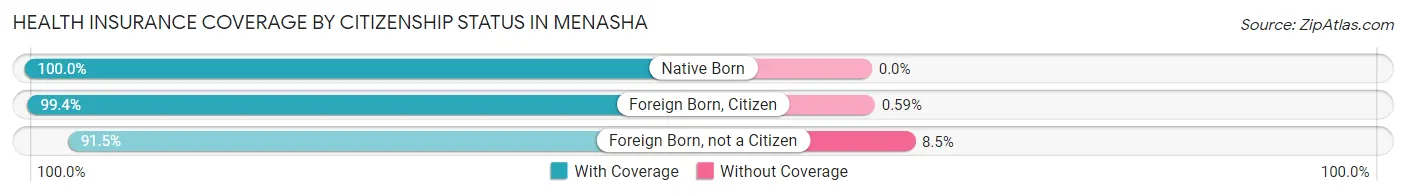
| Citizenship Status | With Coverage | Without Coverage |
| Native Born | 1,555 (100.0%) | 0 (0.0%) |
| Foreign Born, Citizen | 3,058 (99.4%) | 18 (0.6%) |
| Foreign Born, not a Citizen | 1,489 (91.5%) | 138 (8.5%) |
Health Insurance Coverage by Household Income in Menasha
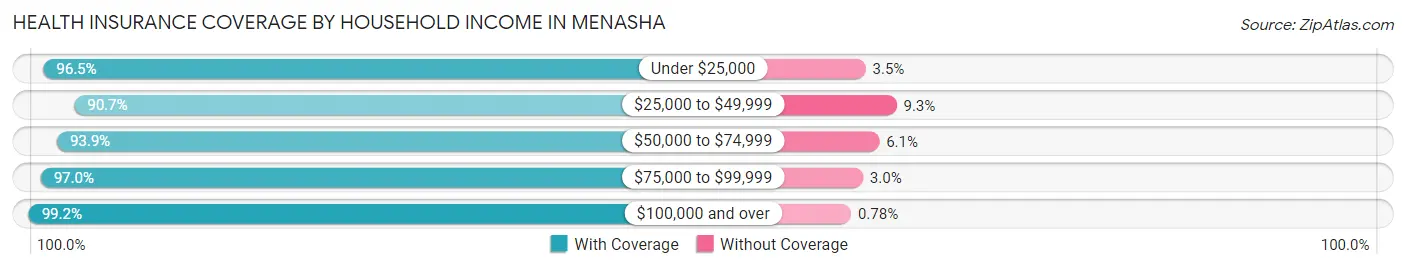
| Household Income | With Coverage | Without Coverage |
| Under $25,000 | 2,469 (96.5%) | 90 (3.5%) |
| $25,000 to $49,999 | 2,296 (90.7%) | 236 (9.3%) |
| $50,000 to $74,999 | 2,923 (93.9%) | 189 (6.1%) |
| $75,000 to $99,999 | 3,149 (97.0%) | 98 (3.0%) |
| $100,000 and over | 6,475 (99.2%) | 51 (0.8%) |
Public vs Private Health Insurance Coverage by Age in Menasha
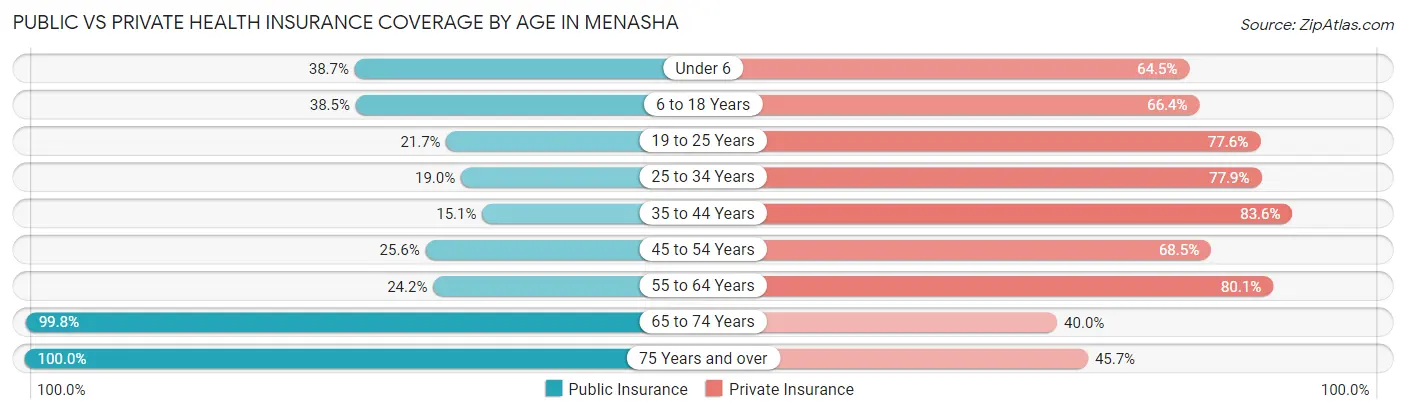
| Age Bracket | Public Insurance | Private Insurance |
| Under 6 | 602 (38.7%) | 1,003 (64.5%) |
| 6 to 18 Years | 1,185 (38.5%) | 2,041 (66.3%) |
| 19 to 25 Years | 353 (21.7%) | 1,263 (77.6%) |
| 25 to 34 Years | 482 (19.0%) | 1,976 (77.9%) |
| 35 to 44 Years | 395 (15.0%) | 2,194 (83.6%) |
| 45 to 54 Years | 546 (25.6%) | 1,463 (68.5%) |
| 55 to 64 Years | 539 (24.1%) | 1,787 (80.1%) |
| 65 to 74 Years | 1,388 (99.8%) | 556 (40.0%) |
| 75 Years and over | 882 (100.0%) | 403 (45.7%) |
| Total | 6,372 (35.3%) | 12,686 (70.2%) |
Disability Status by Sex by Age in Menasha
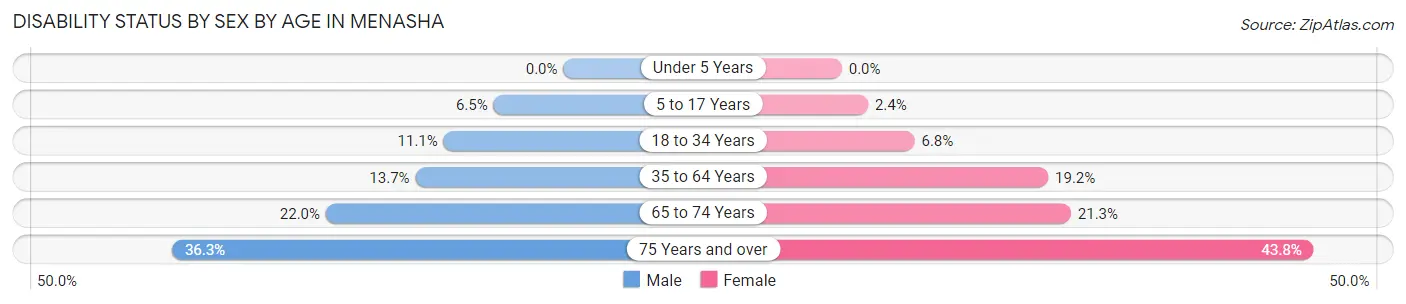
| Age Bracket | Male | Female |
| Under 5 Years | 0 (0.0%) | 0 (0.0%) |
| 5 to 17 Years | 116 (6.5%) | 35 (2.4%) |
| 18 to 34 Years | 239 (11.1%) | 155 (6.8%) |
| 35 to 64 Years | 473 (13.7%) | 679 (19.2%) |
| 65 to 74 Years | 149 (22.0%) | 152 (21.3%) |
| 75 Years and over | 142 (36.3%) | 215 (43.8%) |
Disability Class by Sex by Age in Menasha
Disability Class: Hearing Difficulty
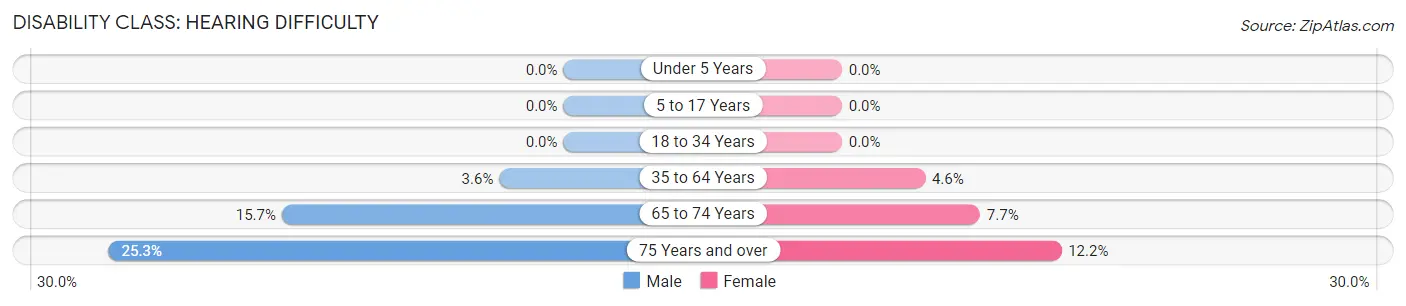
| Age Bracket | Male | Female |
| Under 5 Years | 0 (0.0%) | 0 (0.0%) |
| 5 to 17 Years | 0 (0.0%) | 0 (0.0%) |
| 18 to 34 Years | 0 (0.0%) | 0 (0.0%) |
| 35 to 64 Years | 123 (3.6%) | 164 (4.6%) |
| 65 to 74 Years | 106 (15.7%) | 55 (7.7%) |
| 75 Years and over | 99 (25.3%) | 60 (12.2%) |
Disability Class: Vision Difficulty
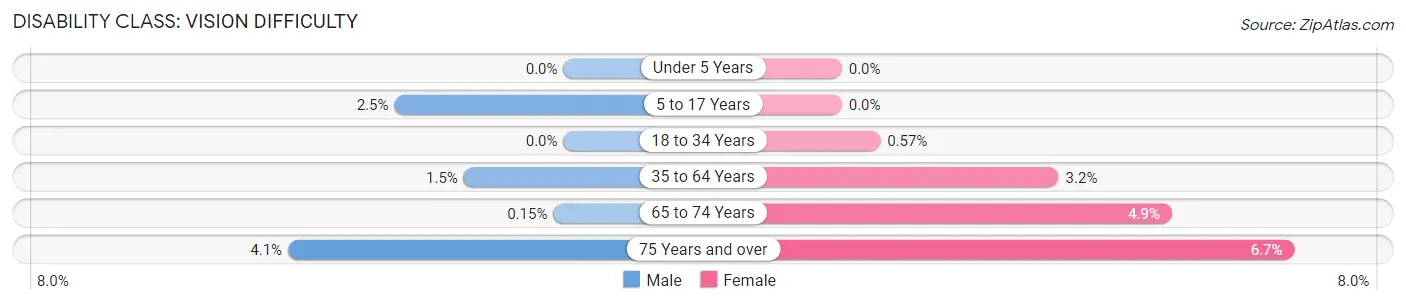
| Age Bracket | Male | Female |
| Under 5 Years | 0 (0.0%) | 0 (0.0%) |
| 5 to 17 Years | 45 (2.5%) | 0 (0.0%) |
| 18 to 34 Years | 0 (0.0%) | 13 (0.6%) |
| 35 to 64 Years | 51 (1.5%) | 114 (3.2%) |
| 65 to 74 Years | 1 (0.2%) | 35 (4.9%) |
| 75 Years and over | 16 (4.1%) | 33 (6.7%) |
Disability Class: Cognitive Difficulty
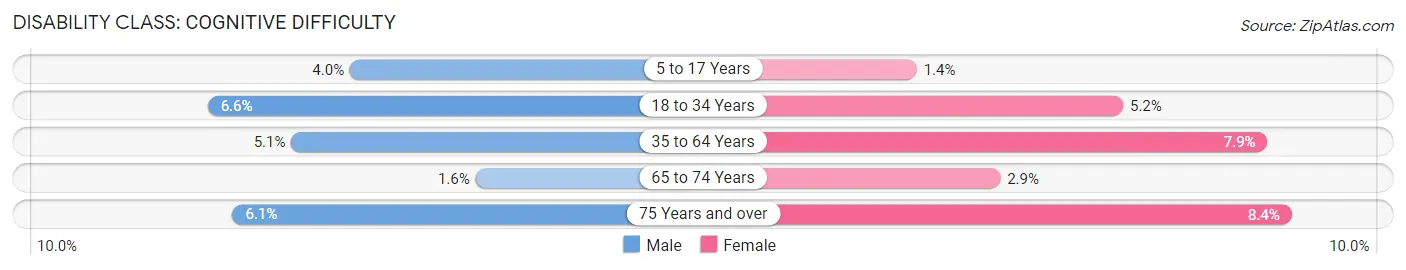
| Age Bracket | Male | Female |
| 5 to 17 Years | 71 (4.0%) | 20 (1.4%) |
| 18 to 34 Years | 142 (6.6%) | 120 (5.2%) |
| 35 to 64 Years | 174 (5.1%) | 280 (7.9%) |
| 65 to 74 Years | 11 (1.6%) | 21 (2.9%) |
| 75 Years and over | 24 (6.1%) | 41 (8.4%) |
Disability Class: Ambulatory Difficulty
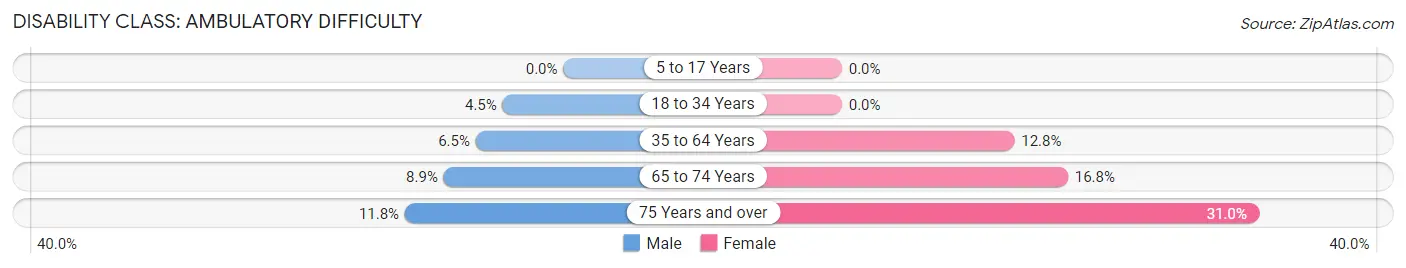
| Age Bracket | Male | Female |
| 5 to 17 Years | 0 (0.0%) | 0 (0.0%) |
| 18 to 34 Years | 97 (4.5%) | 0 (0.0%) |
| 35 to 64 Years | 224 (6.5%) | 454 (12.8%) |
| 65 to 74 Years | 60 (8.9%) | 120 (16.8%) |
| 75 Years and over | 46 (11.8%) | 152 (31.0%) |
Disability Class: Self-Care Difficulty
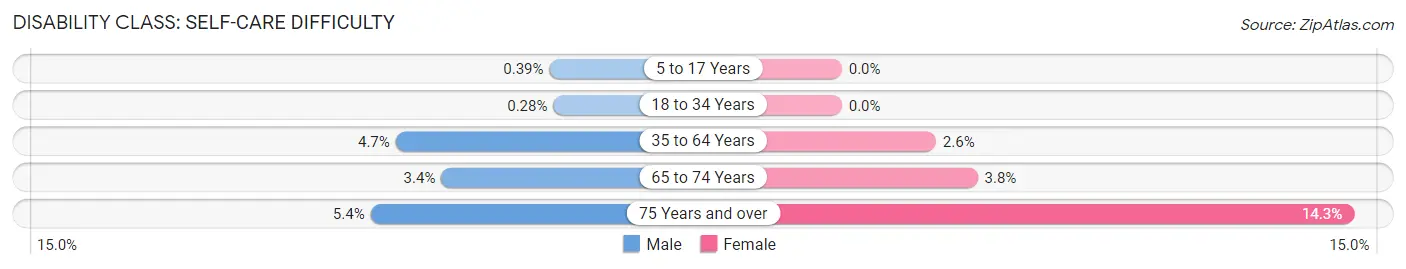
| Age Bracket | Male | Female |
| 5 to 17 Years | 7 (0.4%) | 0 (0.0%) |
| 18 to 34 Years | 6 (0.3%) | 0 (0.0%) |
| 35 to 64 Years | 161 (4.7%) | 93 (2.6%) |
| 65 to 74 Years | 23 (3.4%) | 27 (3.8%) |
| 75 Years and over | 21 (5.4%) | 70 (14.3%) |
Technology Access in Menasha
Computing Device Access in Menasha
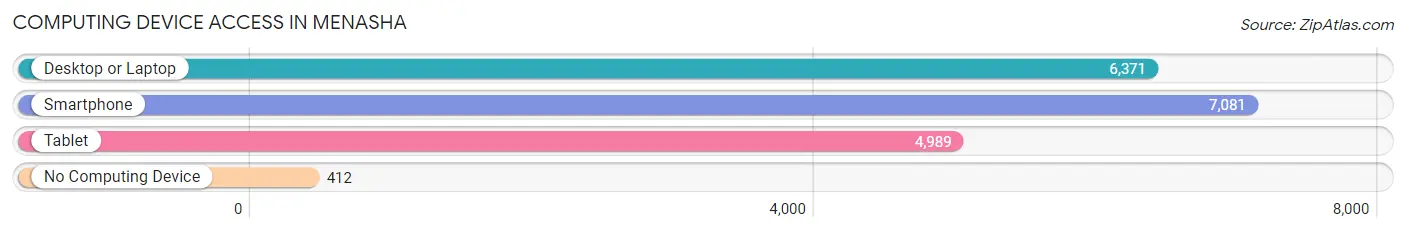
| Device Type | # Households | % Households |
| Desktop or Laptop | 6,371 | 79.4% |
| Smartphone | 7,081 | 88.3% |
| Tablet | 4,989 | 62.2% |
| No Computing Device | 412 | 5.1% |
| Total | 8,022 | 100.0% |
Internet Access in Menasha
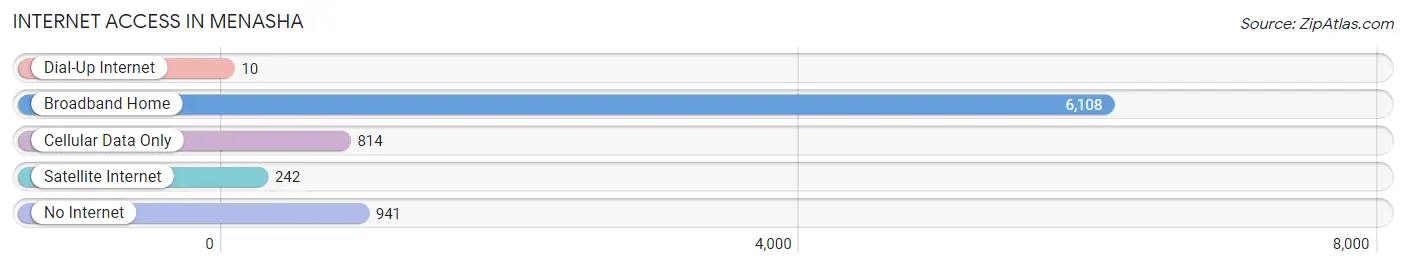
| Internet Type | # Households | % Households |
| Dial-Up Internet | 10 | 0.1% |
| Broadband Home | 6,108 | 76.1% |
| Cellular Data Only | 814 | 10.2% |
| Satellite Internet | 242 | 3.0% |
| No Internet | 941 | 11.7% |
| Total | 8,022 | 100.0% |
Menasha Summary
History
The city of Menasha, Wisconsin is located in the Fox Cities region of the state, and is part of the Appleton-Oshkosh-Neenah Metropolitan Statistical Area. The city was first settled in 1848 by a group of French-Canadian immigrants, who named the area “Little Chute” after the nearby rapids. The city was officially incorporated in 1853, and was renamed Menasha in 1855. The name is derived from the Menominee Indian word “minishe”, which means “thorn”.
The city of Menasha was an important industrial center in the late 19th and early 20th centuries. The city was home to several paper mills, as well as a large tannery and a number of other factories. The city was also home to a large number of immigrants, including Germans, Poles, and Italians. The city was also home to a large number of African-American residents, who were employed in the city’s factories.
In the late 20th century, the city of Menasha underwent a period of economic decline. Many of the city’s factories closed, and the city’s population declined. In recent years, however, the city has seen a resurgence in economic activity. The city has become a popular tourist destination, and is home to a number of restaurants, shops, and other attractions.
Geography
The city of Menasha is located in the Fox Cities region of Wisconsin, in the northeastern part of the state. The city is situated on the south shore of Lake Winnebago, and is bordered by the cities of Neenah, Appleton, and Oshkosh. The city is located approximately 30 miles south of Green Bay, and is approximately 90 miles north of Milwaukee.
The city of Menasha covers an area of 8.3 square miles, and has a population of 17,719 people, according to the 2010 census. The city is divided into four distinct neighborhoods: Downtown, Eastside, Westside, and Southside. The city is home to a number of parks and recreational areas, including the Menasha Lock, the Menasha Dam, and the Menasha Woods State Natural Area.
Economy
The city of Menasha is home to a number of businesses and industries. The city is home to a number of manufacturing companies, including a paper mill, a printing company, and a number of other factories. The city is also home to a number of retail stores, restaurants, and other businesses.
The city is also home to a number of educational institutions, including the University of Wisconsin-Fox Valley, Fox Valley Technical College, and the Menasha Joint School District. The city is also home to a number of healthcare facilities, including the ThedaCare Regional Medical Center-Neenah and the Mercy Medical Center-Oshkosh.
Demographics
The city of Menasha has a population of 17,719 people, according to the 2010 census. The city has a median household income of $50,945, and a median age of 38.7 years. The city is majority white (90.2%), with a small percentage of African-American (3.2%), Asian (2.2%), and Hispanic (2.1%) residents. The city is also home to a large number of immigrants, with a foreign-born population of 8.3%.
Common Questions
What is Per Capita Income in Menasha?
Per Capita income in Menasha is $35,252.
What is the Median Family Income in Menasha?
Median Family Income in Menasha is $86,734.
What is the Median Household income in Menasha?
Median Household Income in Menasha is $62,514.
What is Income or Wage Gap in Menasha?
Income or Wage Gap in Menasha is 29.7%.
Women in Menasha earn 70.3 cents for every dollar earned by a man.
What is Family Income Deficit in Menasha?
Family Income Deficit in Menasha is $16,647.
Families that are below poverty line in Menasha earn $16,647 less on average than the poverty threshold level.
What is Inequality or Gini Index in Menasha?
Inequality or Gini Index in Menasha is 0.42.
What is the Total Population of Menasha?
Total Population of Menasha is 18,125.
What is the Total Male Population of Menasha?
Total Male Population of Menasha is 8,877.
What is the Total Female Population of Menasha?
Total Female Population of Menasha is 9,248.
What is the Ratio of Males per 100 Females in Menasha?
There are 95.99 Males per 100 Females in Menasha.
What is the Ratio of Females per 100 Males in Menasha?
There are 104.18 Females per 100 Males in Menasha.
What is the Median Population Age in Menasha?
Median Population Age in Menasha is 36.1 Years.
What is the Average Family Size in Menasha
Average Family Size in Menasha is 3.0 People.
What is the Average Household Size in Menasha
Average Household Size in Menasha is 2.2 People.
How Large is the Labor Force in Menasha?
There are 10,377 People in the Labor Forcein in Menasha.
What is the Percentage of People in the Labor Force in Menasha?
72.6% of People are in the Labor Force in Menasha.
What is the Unemployment Rate in Menasha?
Unemployment Rate in Menasha is 3.2%.