Random Lake, WI Map & Demographics
Random Lake Map
Random Lake Overview
$42,312
PER CAPITA INCOME
$96,875
AVG FAMILY INCOME
$82,010
AVG HOUSEHOLD INCOME
23.1%
WAGE / INCOME GAP [ % ]
76.9¢/ $1
WAGE / INCOME GAP [ $ ]
0.38
INEQUALITY / GINI INDEX
1,580
TOTAL POPULATION
849
MALE POPULATION
731
FEMALE POPULATION
116.14
MALES / 100 FEMALES
86.10
FEMALES / 100 MALES
44.9
MEDIAN AGE
2.8
AVG FAMILY SIZE
2.3
AVG HOUSEHOLD SIZE
839
LABOR FORCE [ PEOPLE ]
62.4%
PERCENT IN LABOR FORCE
6.2%
UNEMPLOYMENT RATE
Random Lake Zip Codes
Random Lake Area Codes
Income in Random Lake
Income Overview in Random Lake
Per Capita Income in Random Lake is $42,312, while median incomes of families and households are $96,875 and $82,010 respectively.
| Characteristic | Number | Measure |
| Per Capita Income | 1,580 | $42,312 |
| Median Family Income | 476 | $96,875 |
| Mean Family Income | 476 | $116,592 |
| Median Household Income | 680 | $82,010 |
| Mean Household Income | 680 | $100,188 |
| Income Deficit | 476 | $0 |
| Wage / Income Gap (%) | 1,580 | 23.10% |
| Wage / Income Gap ($) | 1,580 | 76.90¢ per $1 |
| Gini / Inequality Index | 1,580 | 0.38 |
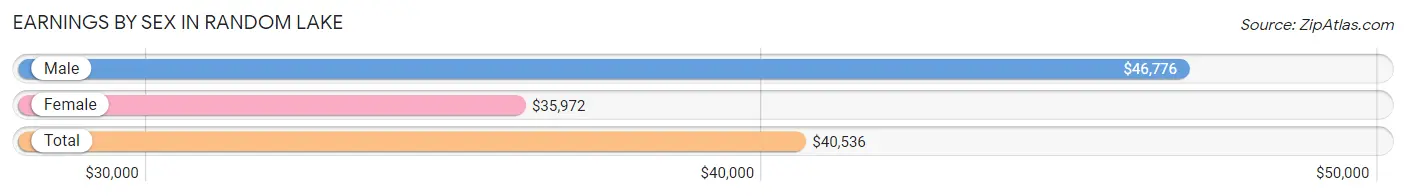
Earnings by Sex in Random Lake
Average Earnings in Random Lake are $40,536, $46,776 for men and $35,972 for women, a difference of 23.1%.
| Sex | Number | Average Earnings |
| Male | 495 (53.8%) | $46,776 |
| Female | 425 (46.2%) | $35,972 |
| Total | 920 (100.0%) | $40,536 |
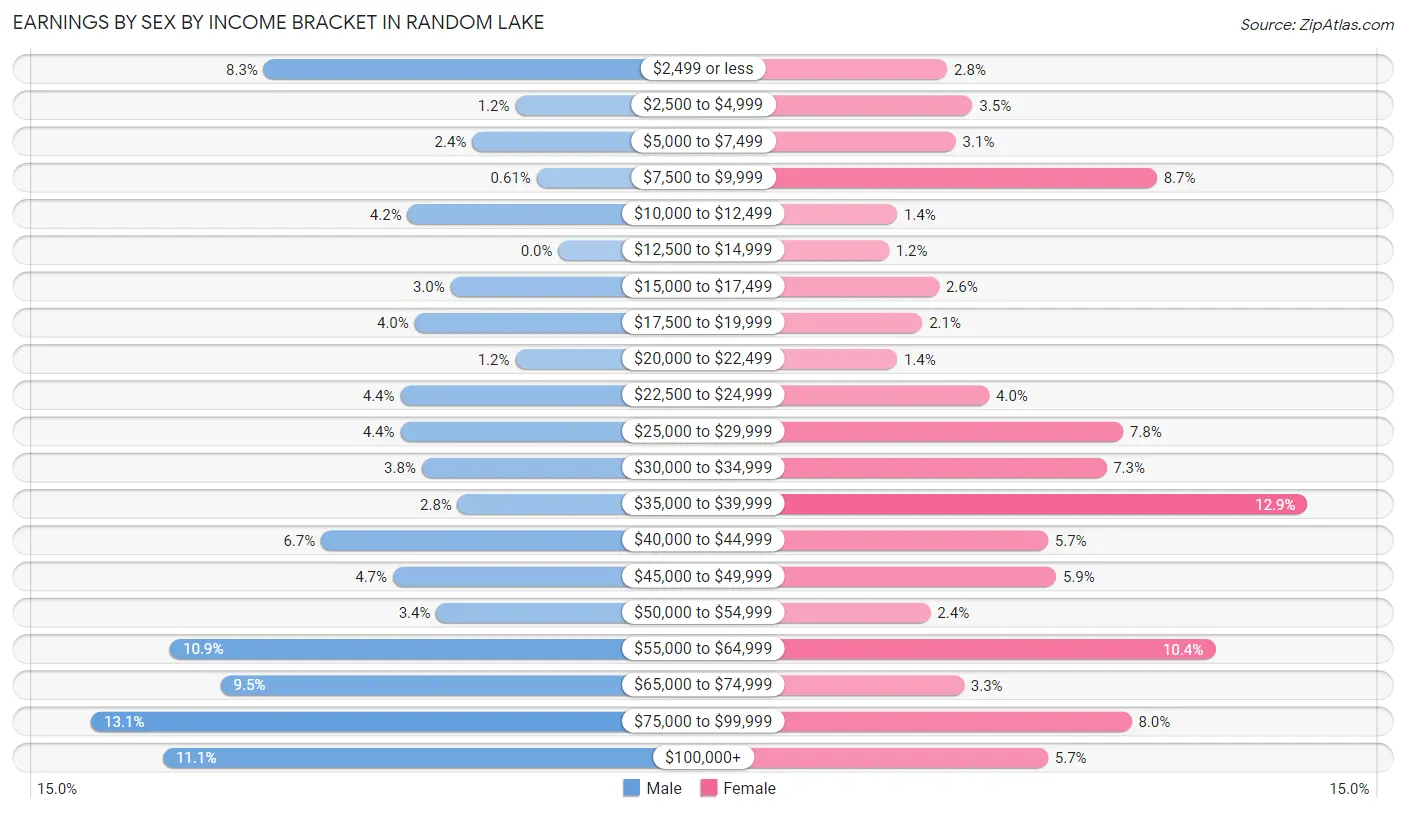
Earnings by Sex by Income Bracket in Random Lake
The most common earnings brackets in Random Lake are $75,000 to $99,999 for men (65 | 13.1%) and $35,000 to $39,999 for women (55 | 12.9%).
| Income | Male | Female |
| $2,499 or less | 41 (8.3%) | 12 (2.8%) |
| $2,500 to $4,999 | 6 (1.2%) | 15 (3.5%) |
| $5,000 to $7,499 | 12 (2.4%) | 13 (3.1%) |
| $7,500 to $9,999 | 3 (0.6%) | 37 (8.7%) |
| $10,000 to $12,499 | 21 (4.2%) | 6 (1.4%) |
| $12,500 to $14,999 | 0 (0.0%) | 5 (1.2%) |
| $15,000 to $17,499 | 15 (3.0%) | 11 (2.6%) |
| $17,500 to $19,999 | 20 (4.0%) | 9 (2.1%) |
| $20,000 to $22,499 | 6 (1.2%) | 6 (1.4%) |
| $22,500 to $24,999 | 22 (4.4%) | 17 (4.0%) |
| $25,000 to $29,999 | 22 (4.4%) | 33 (7.8%) |
| $30,000 to $34,999 | 19 (3.8%) | 31 (7.3%) |
| $35,000 to $39,999 | 14 (2.8%) | 55 (12.9%) |
| $40,000 to $44,999 | 33 (6.7%) | 24 (5.7%) |
| $45,000 to $49,999 | 23 (4.6%) | 25 (5.9%) |
| $50,000 to $54,999 | 17 (3.4%) | 10 (2.4%) |
| $55,000 to $64,999 | 54 (10.9%) | 44 (10.3%) |
| $65,000 to $74,999 | 47 (9.5%) | 14 (3.3%) |
| $75,000 to $99,999 | 65 (13.1%) | 34 (8.0%) |
| $100,000+ | 55 (11.1%) | 24 (5.7%) |
| Total | 495 (100.0%) | 425 (100.0%) |
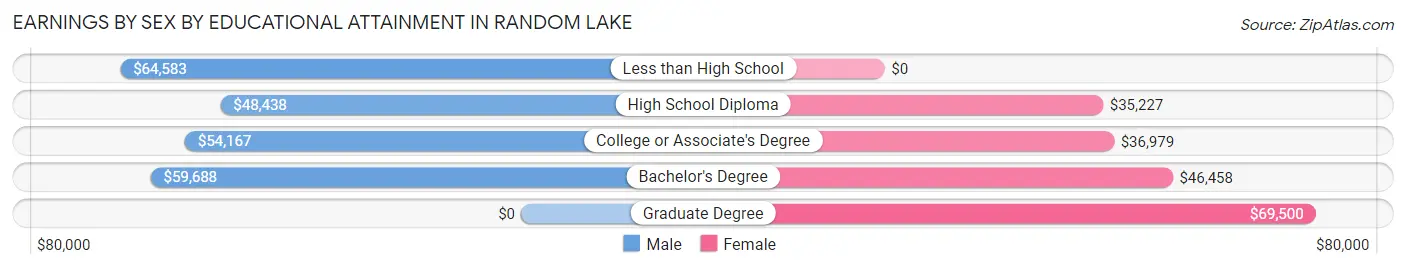
Earnings by Sex by Educational Attainment in Random Lake
Average earnings in Random Lake are $52,321 for men and $37,083 for women, a difference of 29.1%. Men with an educational attainment of less than high school enjoy the highest average annual earnings of $64,583, while those with high school diploma education earn the least with $48,438. Women with an educational attainment of graduate degree earn the most with the average annual earnings of $69,500, while those with high school diploma education have the smallest earnings of $35,227.
| Educational Attainment | Male Income | Female Income |
| Less than High School | $64,583 | $0 |
| High School Diploma | $48,438 | $35,227 |
| College or Associate's Degree | $54,167 | $36,979 |
| Bachelor's Degree | $59,688 | $46,458 |
| Graduate Degree | - | - |
| Total | $52,321 | $37,083 |
Family Income in Random Lake
Family Income Brackets in Random Lake
According to the Random Lake family income data, there are 152 families falling into the $100,000 to $149,999 income range, which is the most common income bracket and makes up 31.9% of all families.
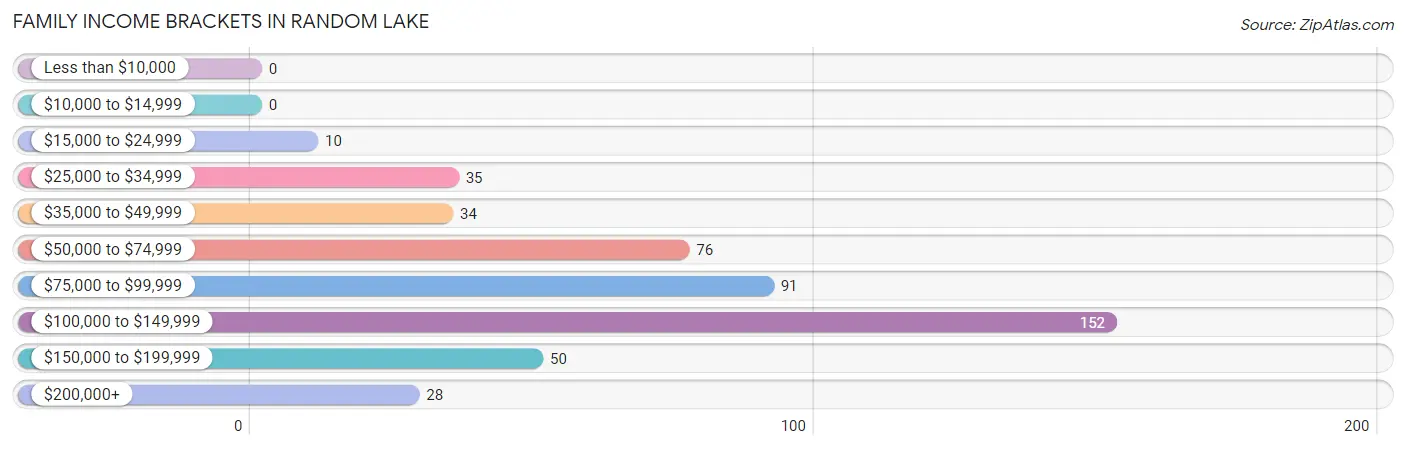
| Income Bracket | # Families | % Families |
| Less than $10,000 | 0 | 0.0% |
| $10,000 to $14,999 | 0 | 0.0% |
| $15,000 to $24,999 | 10 | 2.1% |
| $25,000 to $34,999 | 35 | 7.4% |
| $35,000 to $49,999 | 34 | 7.1% |
| $50,000 to $74,999 | 76 | 16.0% |
| $75,000 to $99,999 | 91 | 19.1% |
| $100,000 to $149,999 | 152 | 31.9% |
| $150,000 to $199,999 | 50 | 10.5% |
| $200,000+ | 28 | 5.9% |
Family Income by Famaliy Size in Random Lake
4-person families (66 | 13.9%) account for the highest median family income in Random Lake with $123,542 per family, while 2-person families (244 | 51.3%) have the highest median income of $41,184 per family member.
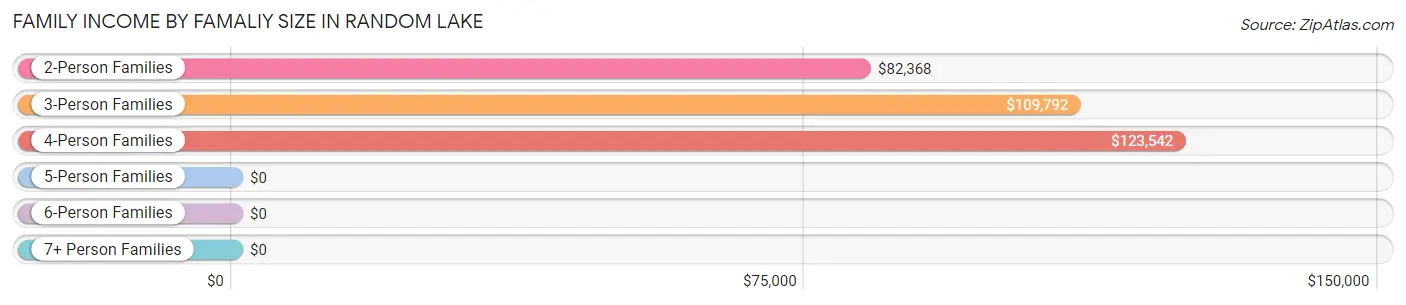
| Income Bracket | # Families | Median Income |
| 2-Person Families | 244 (51.3%) | $82,368 |
| 3-Person Families | 131 (27.5%) | $109,792 |
| 4-Person Families | 66 (13.9%) | $123,542 |
| 5-Person Families | 23 (4.8%) | $0 |
| 6-Person Families | 12 (2.5%) | $0 |
| 7+ Person Families | 0 (0.0%) | $0 |
| Total | 476 (100.0%) | $96,875 |
Family Income by Number of Earners in Random Lake
The median family income in Random Lake is $96,875, with families comprising 3+ earners (80) having the highest median family income of $137,143, while families with no earners (69) have the lowest median family income of $45,625, accounting for 16.8% and 14.5% of families, respectively.
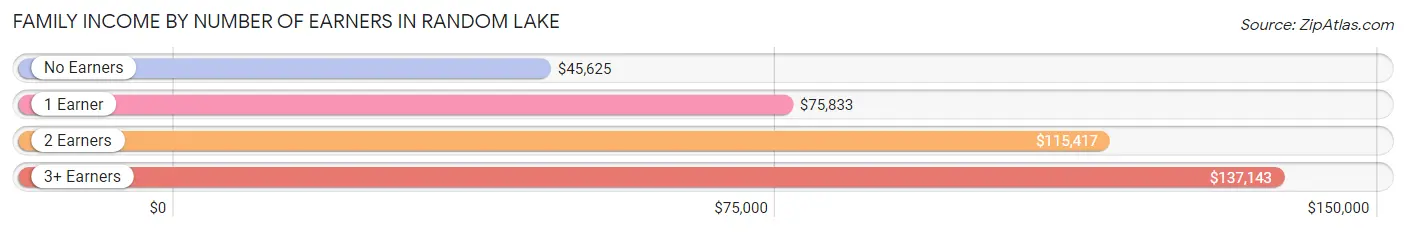
| Number of Earners | # Families | Median Income |
| No Earners | 69 (14.5%) | $45,625 |
| 1 Earner | 124 (26.1%) | $75,833 |
| 2 Earners | 203 (42.6%) | $115,417 |
| 3+ Earners | 80 (16.8%) | $137,143 |
| Total | 476 (100.0%) | $96,875 |
Household Income in Random Lake
Household Income Brackets in Random Lake
With 169 households falling in the category, the $100,000 to $149,999 income range is the most frequent in Random Lake, accounting for 24.8% of all households. In contrast, only 6 households (0.9%) fall into the $10,000 to $14,999 income bracket, making it the least populous group.
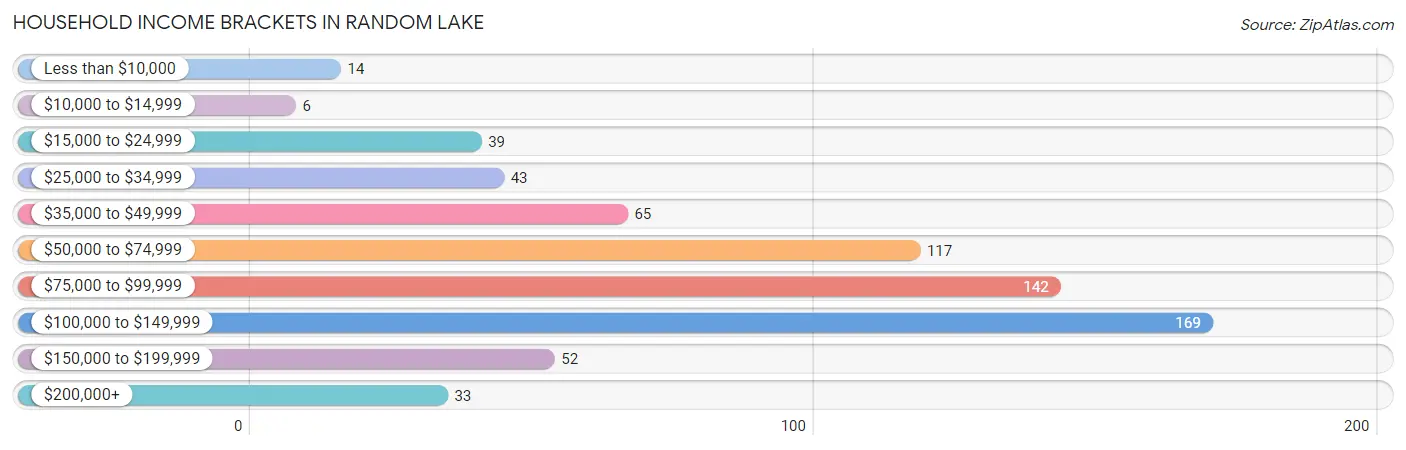
| Income Bracket | # Households | % Households |
| Less than $10,000 | 14 | 2.1% |
| $10,000 to $14,999 | 6 | 0.9% |
| $15,000 to $24,999 | 39 | 5.7% |
| $25,000 to $34,999 | 43 | 6.3% |
| $35,000 to $49,999 | 65 | 9.6% |
| $50,000 to $74,999 | 117 | 17.2% |
| $75,000 to $99,999 | 142 | 20.9% |
| $100,000 to $149,999 | 169 | 24.9% |
| $150,000 to $199,999 | 52 | 7.6% |
| $200,000+ | 33 | 4.9% |
Household Income by Householder Age in Random Lake
The median household income in Random Lake is $82,010, with the highest median household income of $104,583 found in the 25 to 44 years age bracket for the primary householder. A total of 133 households (19.6%) fall into this category. Meanwhile, the 15 to 24 years age bracket for the primary householder has the lowest median household income of $0, with 9 households (1.3%) in this group.
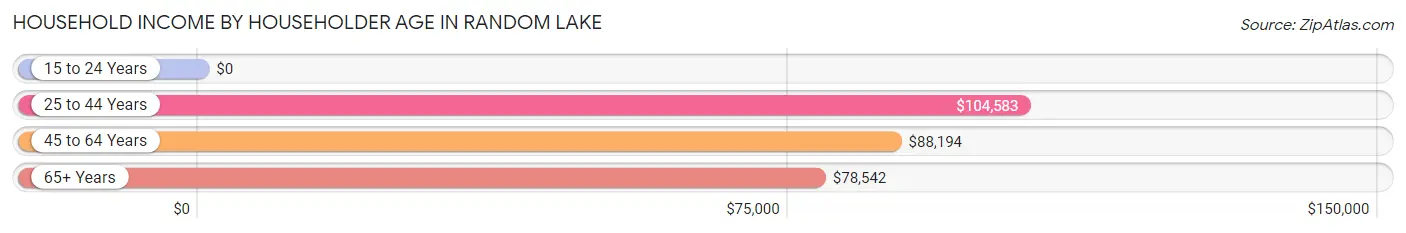
| Income Bracket | # Households | Median Income |
| 15 to 24 Years | 9 (1.3%) | $0 |
| 25 to 44 Years | 133 (19.6%) | $104,583 |
| 45 to 64 Years | 307 (45.2%) | $88,194 |
| 65+ Years | 231 (34.0%) | $78,542 |
| Total | 680 (100.0%) | $82,010 |
Poverty in Random Lake
Income Below Poverty by Sex and Age in Random Lake
With 5.1% poverty level for males and 1.6% for females among the residents of Random Lake, 35 to 44 year old males and 65 to 74 year old females are the most vulnerable to poverty, with 23 males (23.5%) and 12 females (10.6%) in their respective age groups living below the poverty level.
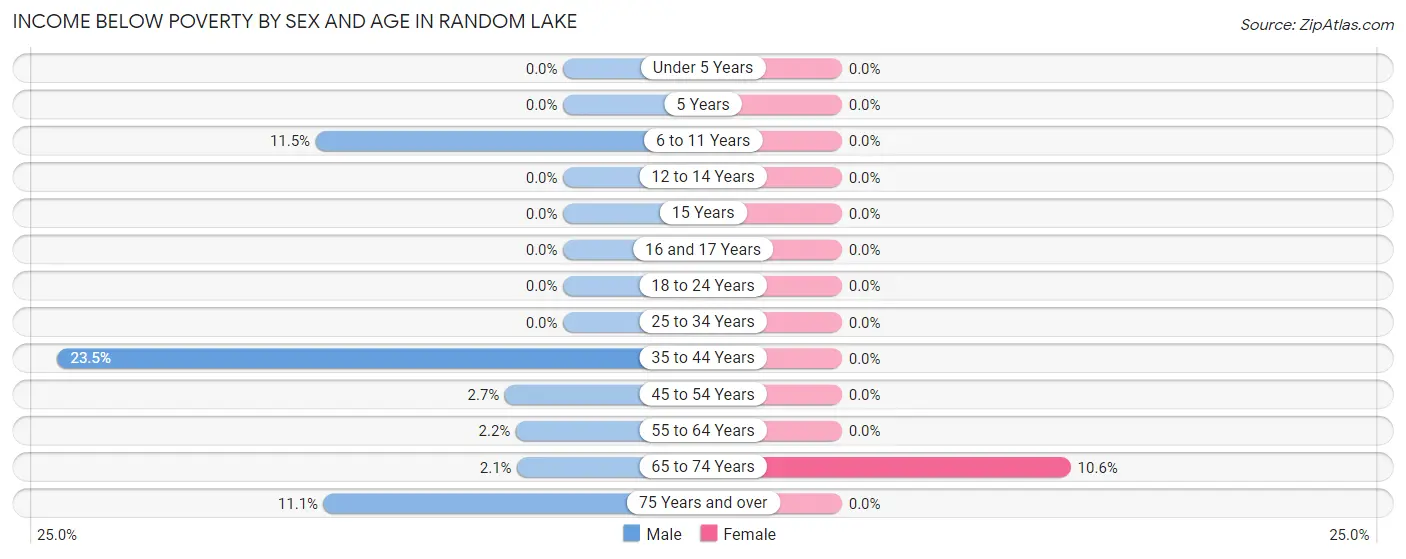
| Age Bracket | Male | Female |
| Under 5 Years | 0 (0.0%) | 0 (0.0%) |
| 5 Years | 0 (0.0%) | 0 (0.0%) |
| 6 to 11 Years | 7 (11.5%) | 0 (0.0%) |
| 12 to 14 Years | 0 (0.0%) | 0 (0.0%) |
| 15 Years | 0 (0.0%) | 0 (0.0%) |
| 16 and 17 Years | 0 (0.0%) | 0 (0.0%) |
| 18 to 24 Years | 0 (0.0%) | 0 (0.0%) |
| 25 to 34 Years | 0 (0.0%) | 0 (0.0%) |
| 35 to 44 Years | 23 (23.5%) | 0 (0.0%) |
| 45 to 54 Years | 3 (2.7%) | 0 (0.0%) |
| 55 to 64 Years | 3 (2.2%) | 0 (0.0%) |
| 65 to 74 Years | 2 (2.1%) | 12 (10.6%) |
| 75 Years and over | 5 (11.1%) | 0 (0.0%) |
| Total | 43 (5.1%) | 12 (1.6%) |
Income Above Poverty by Sex and Age in Random Lake
According to the poverty statistics in Random Lake, males aged under 5 years and females aged under 5 years are the age groups that are most secure financially, with 100.0% of males and 100.0% of females in these age groups living above the poverty line.
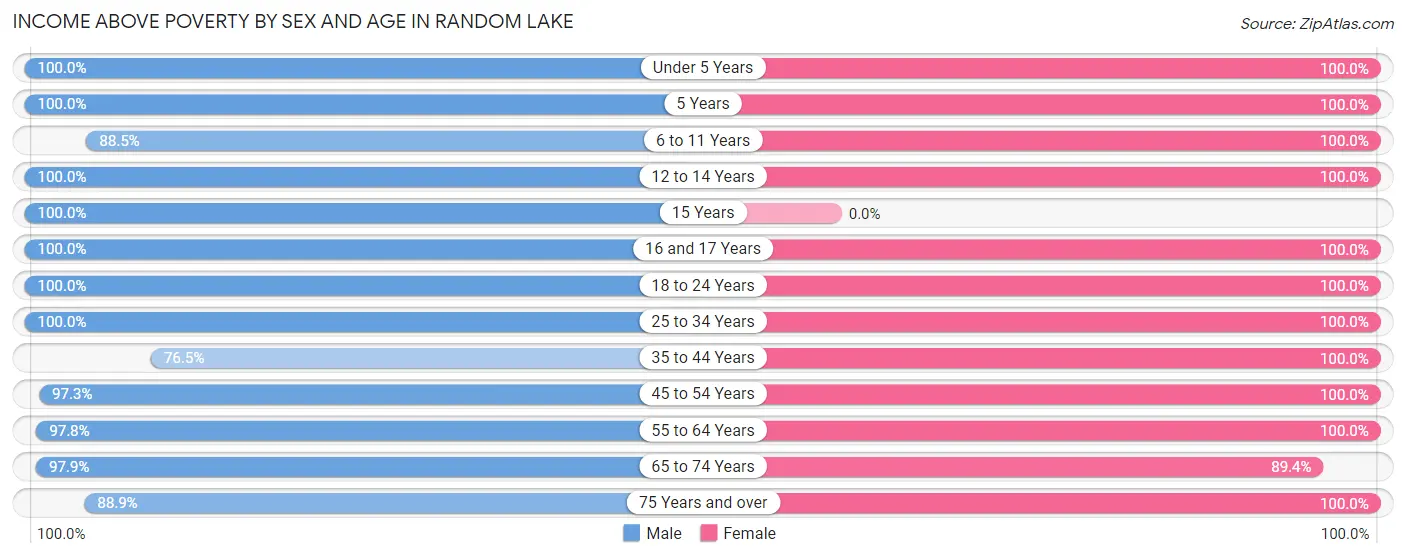
| Age Bracket | Male | Female |
| Under 5 Years | 25 (100.0%) | 25 (100.0%) |
| 5 Years | 5 (100.0%) | 6 (100.0%) |
| 6 to 11 Years | 54 (88.5%) | 29 (100.0%) |
| 12 to 14 Years | 24 (100.0%) | 35 (100.0%) |
| 15 Years | 25 (100.0%) | 0 (0.0%) |
| 16 and 17 Years | 20 (100.0%) | 31 (100.0%) |
| 18 to 24 Years | 97 (100.0%) | 34 (100.0%) |
| 25 to 34 Years | 107 (100.0%) | 101 (100.0%) |
| 35 to 44 Years | 75 (76.5%) | 69 (100.0%) |
| 45 to 54 Years | 108 (97.3%) | 108 (100.0%) |
| 55 to 64 Years | 134 (97.8%) | 103 (100.0%) |
| 65 to 74 Years | 92 (97.9%) | 101 (89.4%) |
| 75 Years and over | 40 (88.9%) | 77 (100.0%) |
| Total | 806 (94.9%) | 719 (98.4%) |
Income Below Poverty Among Married-Couple Families in Random Lake
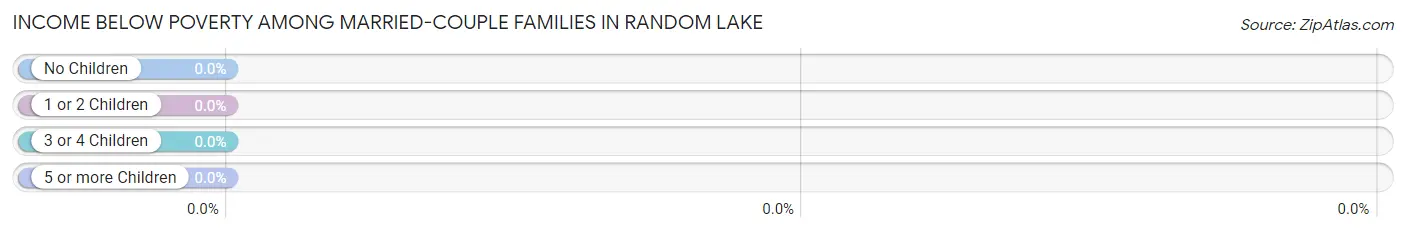
| Children | Above Poverty | Below Poverty |
| No Children | 239 (100.0%) | 0 (0.0%) |
| 1 or 2 Children | 82 (100.0%) | 0 (0.0%) |
| 3 or 4 Children | 25 (100.0%) | 0 (0.0%) |
| 5 or more Children | 0 (0.0%) | 0 (0.0%) |
| Total | 346 (100.0%) | 0 (0.0%) |
Income Below Poverty Among Single-Parent Households in Random Lake
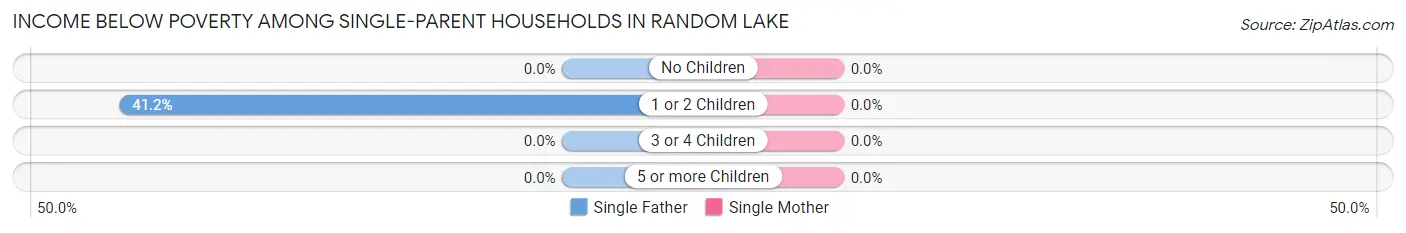
| Children | Single Father | Single Mother |
| No Children | 0 (0.0%) | 0 (0.0%) |
| 1 or 2 Children | 7 (41.2%) | 0 (0.0%) |
| 3 or 4 Children | 0 (0.0%) | 0 (0.0%) |
| 5 or more Children | 0 (0.0%) | 0 (0.0%) |
| Total | 7 (10.1%) | 0 (0.0%) |
Income Below Poverty Among Married-Couple vs Single-Parent Households in Random Lake
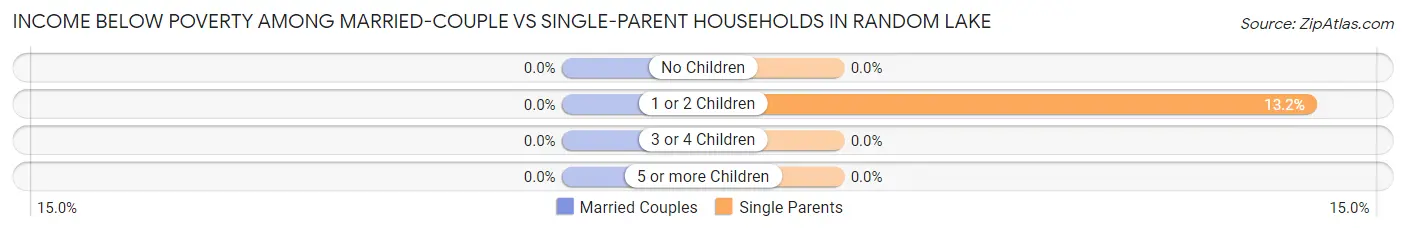
| Children | Married-Couple Families | Single-Parent Households |
| No Children | 0 (0.0%) | 0 (0.0%) |
| 1 or 2 Children | 0 (0.0%) | 7 (13.2%) |
| 3 or 4 Children | 0 (0.0%) | 0 (0.0%) |
| 5 or more Children | 0 (0.0%) | 0 (0.0%) |
| Total | 0 (0.0%) | 7 (5.4%) |
Race in Random Lake
The most populous races in Random Lake are White / Caucasian (1,506 | 95.3%), Two or more Races (71 | 4.5%), and Hispanic or Latino (54 | 3.4%).
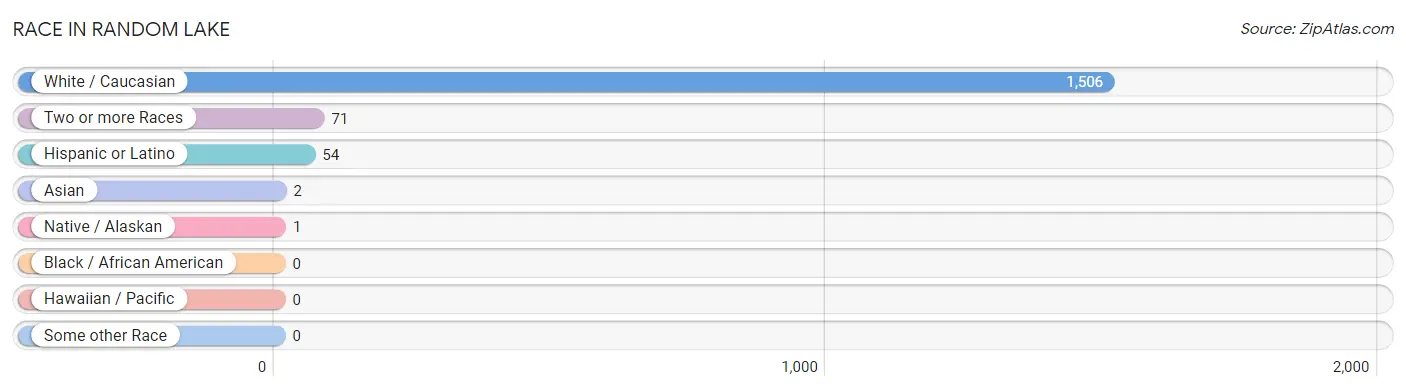
| Race | # Population | % Population |
| Asian | 2 | 0.1% |
| Black / African American | 0 | 0.0% |
| Hawaiian / Pacific | 0 | 0.0% |
| Hispanic or Latino | 54 | 3.4% |
| Native / Alaskan | 1 | 0.1% |
| White / Caucasian | 1,506 | 95.3% |
| Two or more Races | 71 | 4.5% |
| Some other Race | 0 | 0.0% |
| Total | 1,580 | 100.0% |
Ancestry in Random Lake
The most populous ancestries reported in Random Lake are German (837 | 53.0%), Irish (281 | 17.8%), Polish (88 | 5.6%), French (83 | 5.2%), and Norwegian (76 | 4.8%), together accounting for 86.4% of all Random Lake residents.
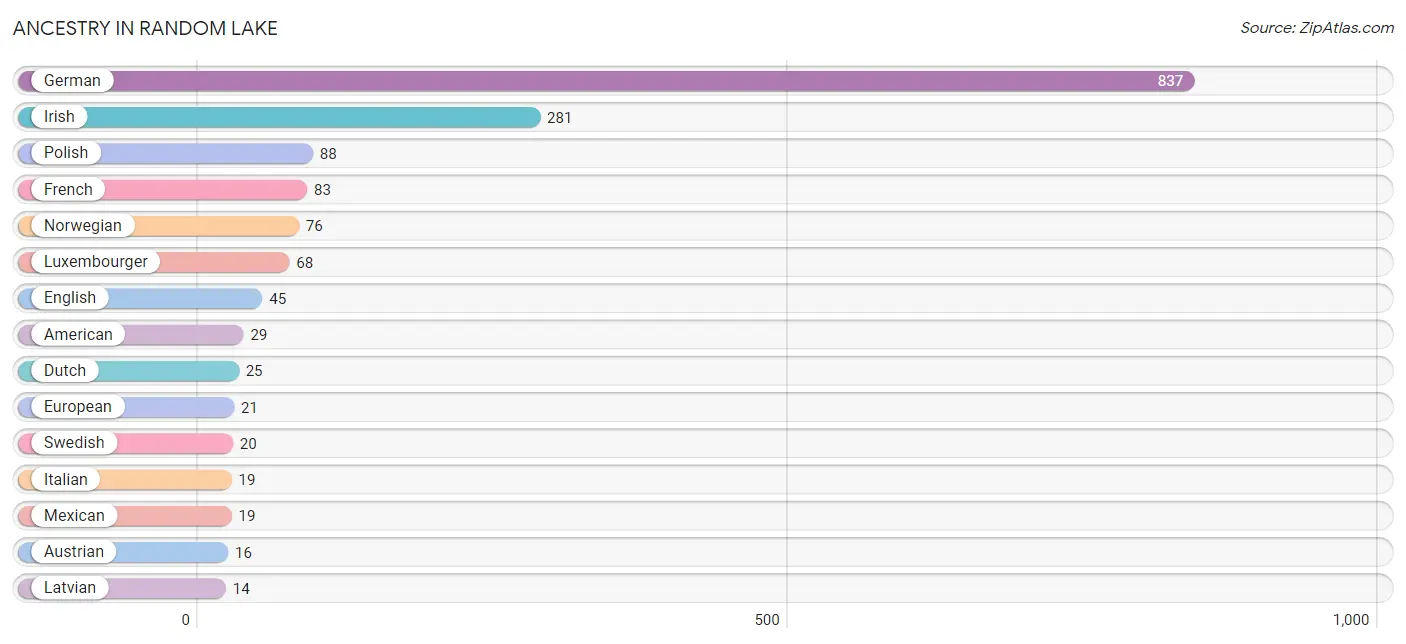
| Ancestry | # Population | % Population |
| American | 29 | 1.8% |
| Armenian | 7 | 0.4% |
| Austrian | 16 | 1.0% |
| Belgian | 6 | 0.4% |
| Bhutanese | 8 | 0.5% |
| Chippewa | 8 | 0.5% |
| Czech | 8 | 0.5% |
| Czechoslovakian | 8 | 0.5% |
| Danish | 5 | 0.3% |
| Dutch | 25 | 1.6% |
| Eastern European | 3 | 0.2% |
| English | 45 | 2.9% |
| European | 21 | 1.3% |
| French | 83 | 5.2% |
| French Canadian | 3 | 0.2% |
| German | 837 | 53.0% |
| Greek | 3 | 0.2% |
| Hungarian | 13 | 0.8% |
| Indian (Asian) | 2 | 0.1% |
| Irish | 281 | 17.8% |
| Italian | 19 | 1.2% |
| Latvian | 14 | 0.9% |
| Luxembourger | 68 | 4.3% |
| Mexican | 19 | 1.2% |
| Norwegian | 76 | 4.8% |
| Polish | 88 | 5.6% |
| Puerto Rican | 4 | 0.3% |
| Russian | 7 | 0.4% |
| Scandinavian | 8 | 0.5% |
| Scotch-Irish | 10 | 0.6% |
| Scottish | 6 | 0.4% |
| Slovene | 7 | 0.4% |
| South American | 6 | 0.4% |
| Swedish | 20 | 1.3% |
| Swiss | 10 | 0.6% |
| Thai | 4 | 0.3% |
| Uruguayan | 6 | 0.4% |
| Welsh | 6 | 0.4% | View All 38 Rows |
Immigrants in Random Lake
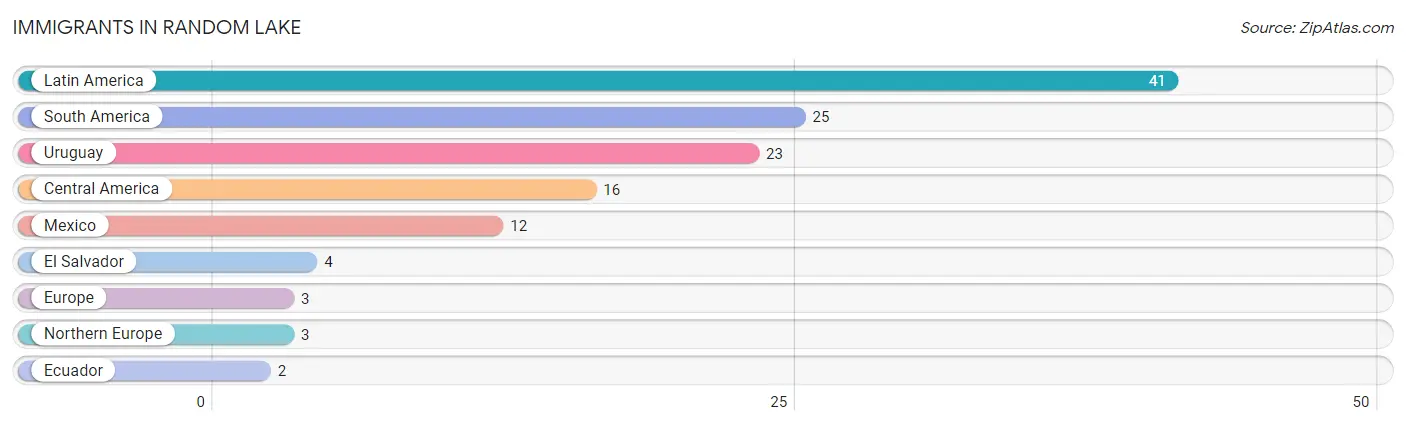
The most numerous immigrant groups reported in Random Lake came from Latin America (41 | 2.6%), South America (25 | 1.6%), Uruguay (23 | 1.5%), Central America (16 | 1.0%), and Mexico (12 | 0.8%), together accounting for 7.4% of all Random Lake residents.
| Immigration Origin | # Population | % Population |
| Central America | 16 | 1.0% |
| Ecuador | 2 | 0.1% |
| El Salvador | 4 | 0.3% |
| Europe | 3 | 0.2% |
| Latin America | 41 | 2.6% |
| Mexico | 12 | 0.8% |
| Northern Europe | 3 | 0.2% |
| South America | 25 | 1.6% |
| Uruguay | 23 | 1.5% | View All 9 Rows |
Sex and Age in Random Lake
Sex and Age in Random Lake
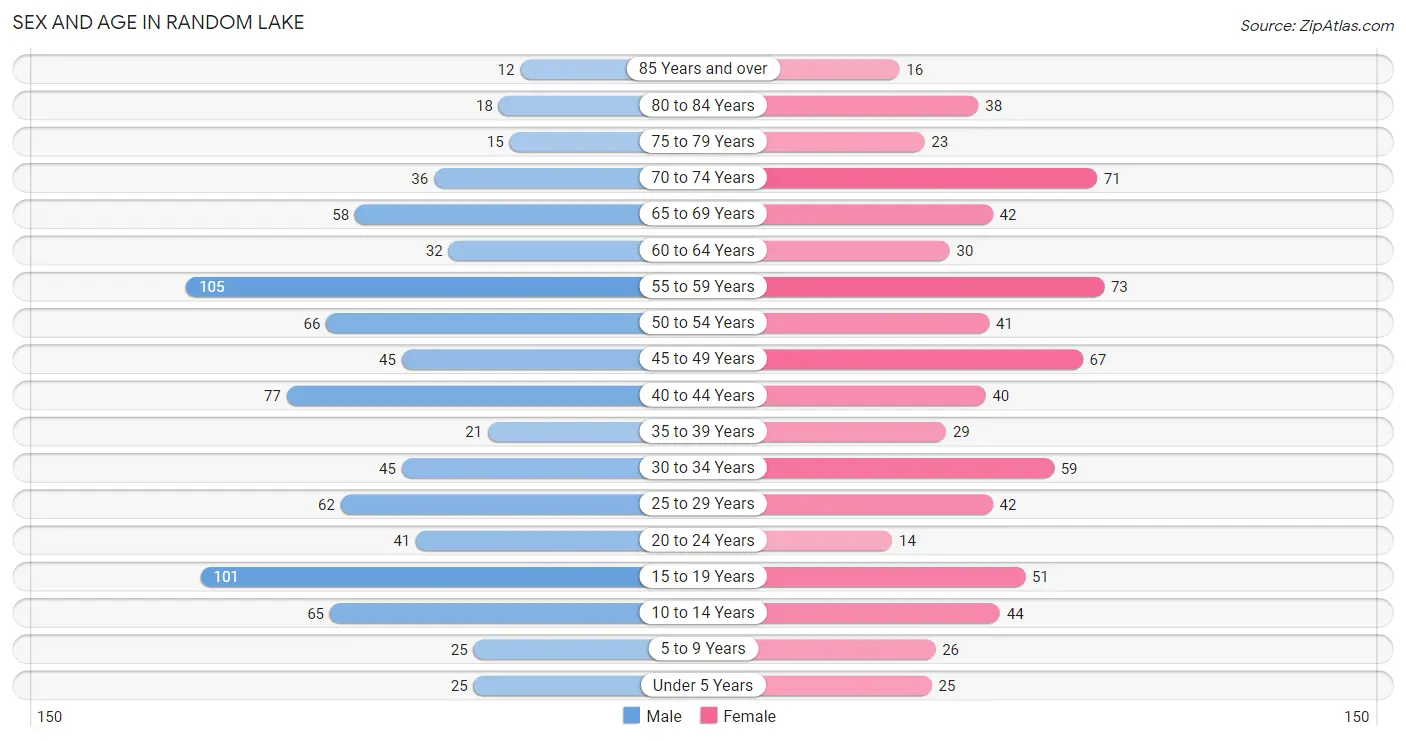
The most populous age groups in Random Lake are 55 to 59 Years (105 | 12.4%) for men and 55 to 59 Years (73 | 10.0%) for women.
| Age Bracket | Male | Female |
| Under 5 Years | 25 (2.9%) | 25 (3.4%) |
| 5 to 9 Years | 25 (2.9%) | 26 (3.6%) |
| 10 to 14 Years | 65 (7.7%) | 44 (6.0%) |
| 15 to 19 Years | 101 (11.9%) | 51 (7.0%) |
| 20 to 24 Years | 41 (4.8%) | 14 (1.9%) |
| 25 to 29 Years | 62 (7.3%) | 42 (5.8%) |
| 30 to 34 Years | 45 (5.3%) | 59 (8.1%) |
| 35 to 39 Years | 21 (2.5%) | 29 (4.0%) |
| 40 to 44 Years | 77 (9.1%) | 40 (5.5%) |
| 45 to 49 Years | 45 (5.3%) | 67 (9.2%) |
| 50 to 54 Years | 66 (7.8%) | 41 (5.6%) |
| 55 to 59 Years | 105 (12.4%) | 73 (10.0%) |
| 60 to 64 Years | 32 (3.8%) | 30 (4.1%) |
| 65 to 69 Years | 58 (6.8%) | 42 (5.8%) |
| 70 to 74 Years | 36 (4.2%) | 71 (9.7%) |
| 75 to 79 Years | 15 (1.8%) | 23 (3.2%) |
| 80 to 84 Years | 18 (2.1%) | 38 (5.2%) |
| 85 Years and over | 12 (1.4%) | 16 (2.2%) |
| Total | 849 (100.0%) | 731 (100.0%) |
Families and Households in Random Lake
Median Family Size in Random Lake
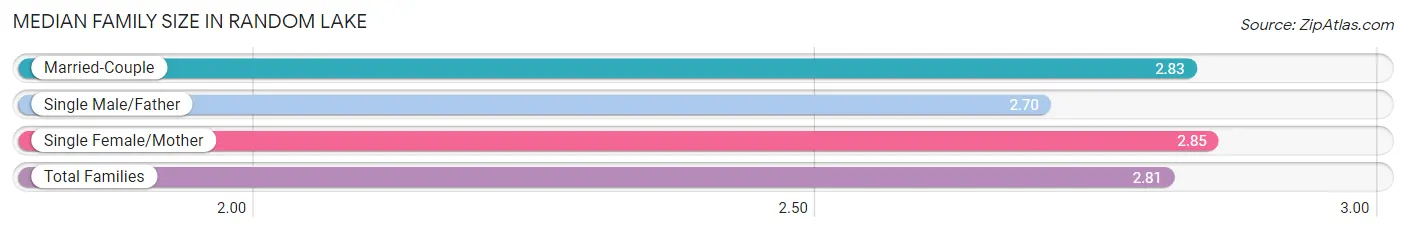
The median family size in Random Lake is 2.81 persons per family, with single female/mother families (61 | 12.8%) accounting for the largest median family size of 2.85 persons per family. On the other hand, single male/father families (69 | 14.5%) represent the smallest median family size with 2.70 persons per family.
| Family Type | # Families | Family Size |
| Married-Couple | 346 (72.7%) | 2.83 |
| Single Male/Father | 69 (14.5%) | 2.70 |
| Single Female/Mother | 61 (12.8%) | 2.85 |
| Total Families | 476 (100.0%) | 2.81 |
Median Household Size in Random Lake
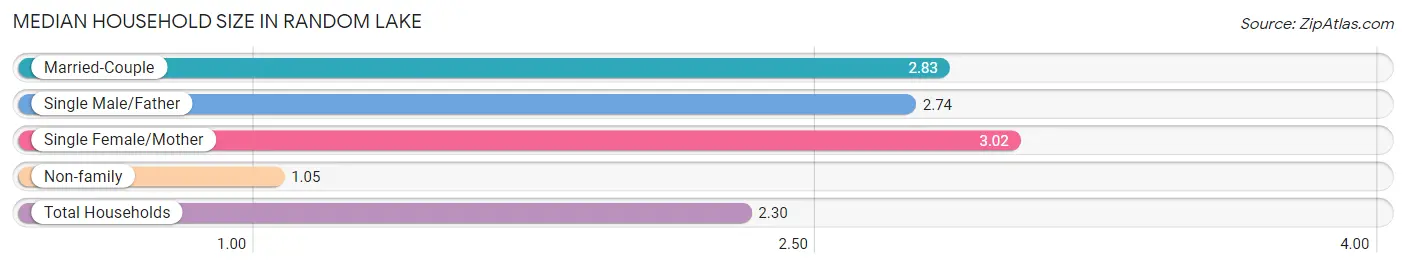
The median household size in Random Lake is 2.30 persons per household, with single female/mother households (61 | 9.0%) accounting for the largest median household size of 3.02 persons per household. non-family households (204 | 30.0%) represent the smallest median household size with 1.05 persons per household.
| Household Type | # Households | Household Size |
| Married-Couple | 346 (50.9%) | 2.83 |
| Single Male/Father | 69 (10.2%) | 2.74 |
| Single Female/Mother | 61 (9.0%) | 3.02 |
| Non-family | 204 (30.0%) | 1.05 |
| Total Households | 680 (100.0%) | 2.30 |
Household Size by Marriage Status in Random Lake
Out of a total of 680 households in Random Lake, 476 (70.0%) are family households, while 204 (30.0%) are nonfamily households. The most numerous type of family households are 2-person households, comprising 238, and the most common type of nonfamily households are 1-person households, comprising 191.
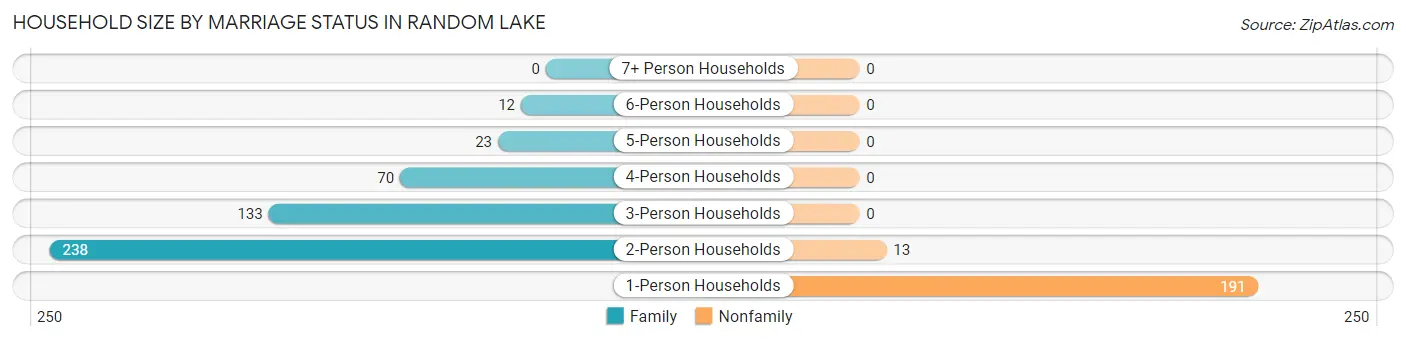
| Household Size | Family Households | Nonfamily Households |
| 1-Person Households | - | 191 (28.1%) |
| 2-Person Households | 238 (35.0%) | 13 (1.9%) |
| 3-Person Households | 133 (19.6%) | 0 (0.0%) |
| 4-Person Households | 70 (10.3%) | 0 (0.0%) |
| 5-Person Households | 23 (3.4%) | 0 (0.0%) |
| 6-Person Households | 12 (1.8%) | 0 (0.0%) |
| 7+ Person Households | 0 (0.0%) | 0 (0.0%) |
| Total | 476 (70.0%) | 204 (30.0%) |
Female Fertility in Random Lake
Fertility by Age in Random Lake
Average fertility rate in Random Lake is 84.0 births per 1,000 women. Women in the age bracket of 20 to 34 years have the highest fertility rate with 165.0 births per 1,000 women. Women in the age bracket of 20 to 34 years acount for 73.1% of all women with births.
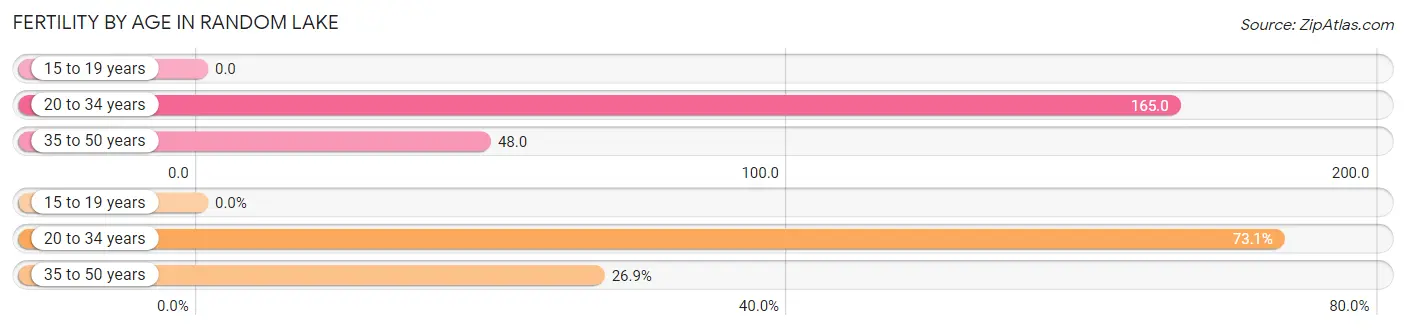
| Age Bracket | Women with Births | Births / 1,000 Women |
| 15 to 19 years | 0 (0.0%) | 0.0 |
| 20 to 34 years | 19 (73.1%) | 165.0 |
| 35 to 50 years | 7 (26.9%) | 48.0 |
| Total | 26 (100.0%) | 84.0 |
Fertility by Age by Marriage Status in Random Lake
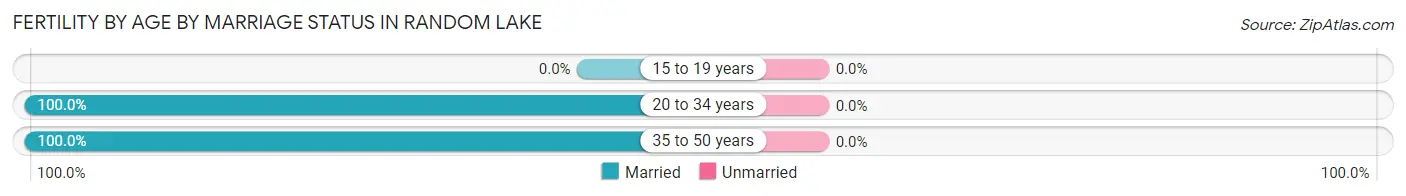
| Age Bracket | Married | Unmarried |
| 15 to 19 years | 0 (0.0%) | 0 (0.0%) |
| 20 to 34 years | 19 (100.0%) | 0 (0.0%) |
| 35 to 50 years | 7 (100.0%) | 0 (0.0%) |
| Total | 26 (100.0%) | 0 (0.0%) |
Fertility by Education in Random Lake
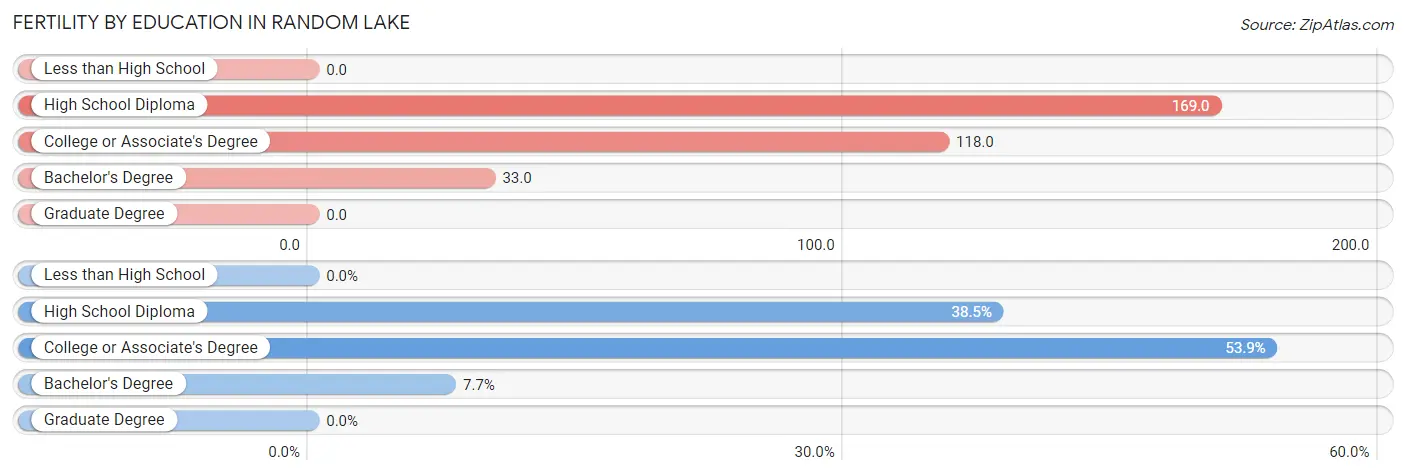
| Educational Attainment | Women with Births | Births / 1,000 Women |
| Less than High School | 0 (0.0%) | 0.0 |
| High School Diploma | 10 (38.5%) | 169.0 |
| College or Associate's Degree | 14 (53.8%) | 118.0 |
| Bachelor's Degree | 2 (7.7%) | 33.0 |
| Graduate Degree | 0 (0.0%) | 0.0 |
| Total | 26 (100.0%) | 84.0 |
Fertility by Education by Marriage Status in Random Lake
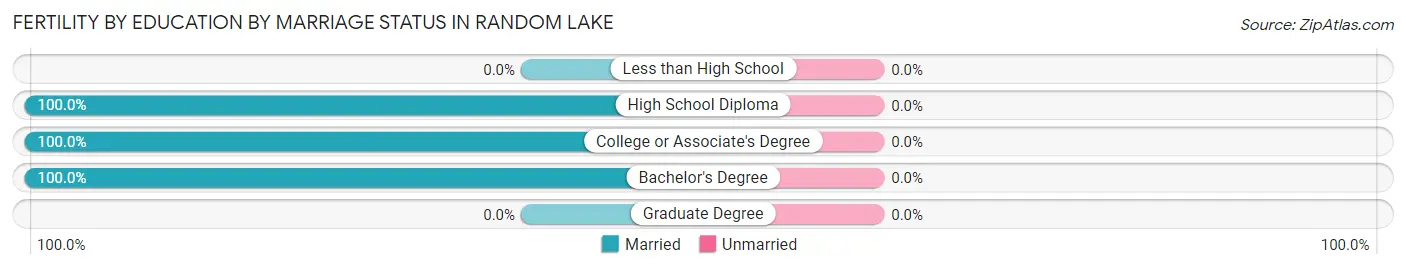
| Educational Attainment | Married | Unmarried |
| Less than High School | 0 (0.0%) | 0 (0.0%) |
| High School Diploma | 10 (100.0%) | 0 (0.0%) |
| College or Associate's Degree | 14 (100.0%) | 0 (0.0%) |
| Bachelor's Degree | 2 (100.0%) | 0 (0.0%) |
| Graduate Degree | 0 (0.0%) | 0 (0.0%) |
| Total | 26 (100.0%) | 0 (0.0%) |
Employment Characteristics in Random Lake
Employment by Class of Employer in Random Lake
Among the 776 employed individuals in Random Lake, private company employees (608 | 78.3%), not-for-profit organizations (60 | 7.7%), and self-employed (not incorporated) (37 | 4.8%) make up the most common classes of employment.
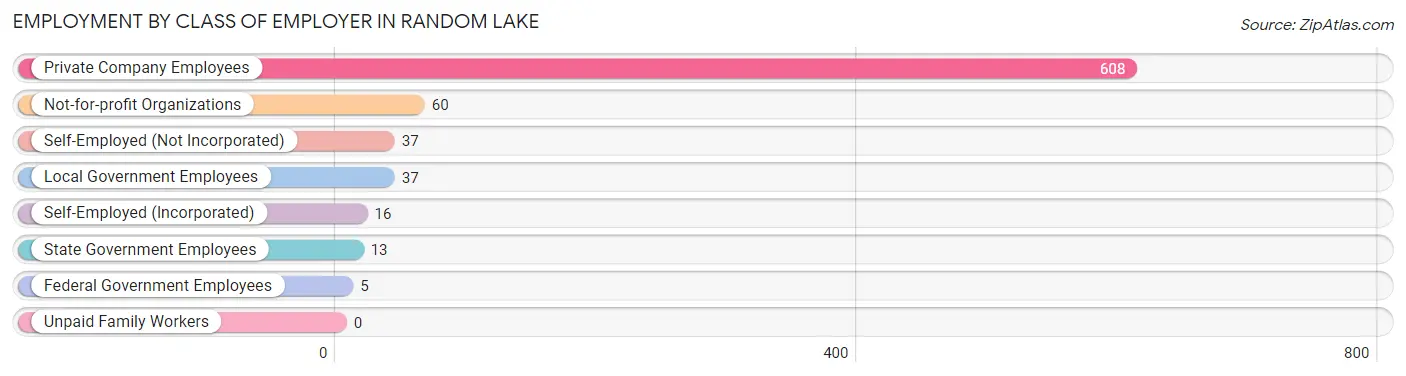
| Employer Class | # Employees | % Employees |
| Private Company Employees | 608 | 78.3% |
| Self-Employed (Incorporated) | 16 | 2.1% |
| Self-Employed (Not Incorporated) | 37 | 4.8% |
| Not-for-profit Organizations | 60 | 7.7% |
| Local Government Employees | 37 | 4.8% |
| State Government Employees | 13 | 1.7% |
| Federal Government Employees | 5 | 0.6% |
| Unpaid Family Workers | 0 | 0.0% |
| Total | 776 | 100.0% |
Employment Status by Age in Random Lake
According to the labor force statistics for Random Lake, out of the total population over 16 years of age (1,345), 62.4% or 839 individuals are in the labor force, with 6.2% or 52 of them unemployed. The age group with the highest labor force participation rate is 20 to 24 years, with 100.0% or 55 individuals in the labor force. Within the labor force, the 16 to 19 years age range has the highest percentage of unemployed individuals, with 43.6% or 17 of them being unemployed.
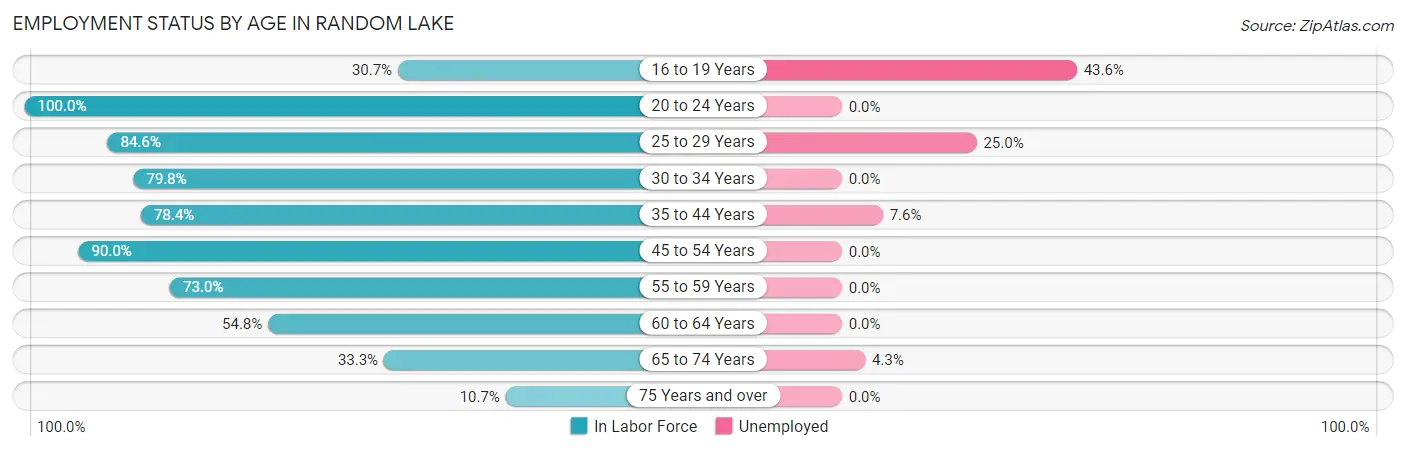
| Age Bracket | In Labor Force | Unemployed |
| 16 to 19 Years | 39 (30.7%) | 17 (43.6%) |
| 20 to 24 Years | 55 (100.0%) | 0 (0.0%) |
| 25 to 29 Years | 88 (84.6%) | 22 (25.0%) |
| 30 to 34 Years | 83 (79.8%) | 0 (0.0%) |
| 35 to 44 Years | 131 (78.4%) | 10 (7.6%) |
| 45 to 54 Years | 197 (90.0%) | 0 (0.0%) |
| 55 to 59 Years | 130 (73.0%) | 0 (0.0%) |
| 60 to 64 Years | 34 (54.8%) | 0 (0.0%) |
| 65 to 74 Years | 69 (33.3%) | 3 (4.3%) |
| 75 Years and over | 13 (10.7%) | 0 (0.0%) |
| Total | 839 (62.4%) | 52 (6.2%) |
Employment Status by Educational Attainment in Random Lake
According to labor force statistics for Random Lake, 79.5% of individuals (663) out of the total population between 25 and 64 years of age (834) are in the labor force, with 4.8% or 32 of them being unemployed. The group with the highest labor force participation rate are those with the educational attainment of bachelor's degree or higher, with 91.5% or 172 individuals in the labor force. Within the labor force, individuals with high school diploma education have the highest percentage of unemployment, with 5.4% or 10 of them being unemployed.
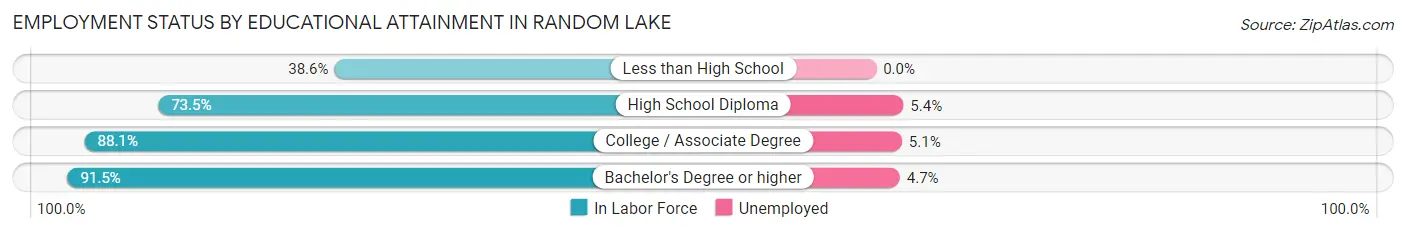
| Educational Attainment | In Labor Force | Unemployed |
| Less than High School | 32 (38.6%) | 0 (0.0%) |
| High School Diploma | 186 (73.5%) | 14 (5.4%) |
| College / Associate Degree | 273 (88.1%) | 16 (5.1%) |
| Bachelor's Degree or higher | 172 (91.5%) | 9 (4.7%) |
| Total | 663 (79.5%) | 40 (4.8%) |
Employment Occupations by Sex in Random Lake
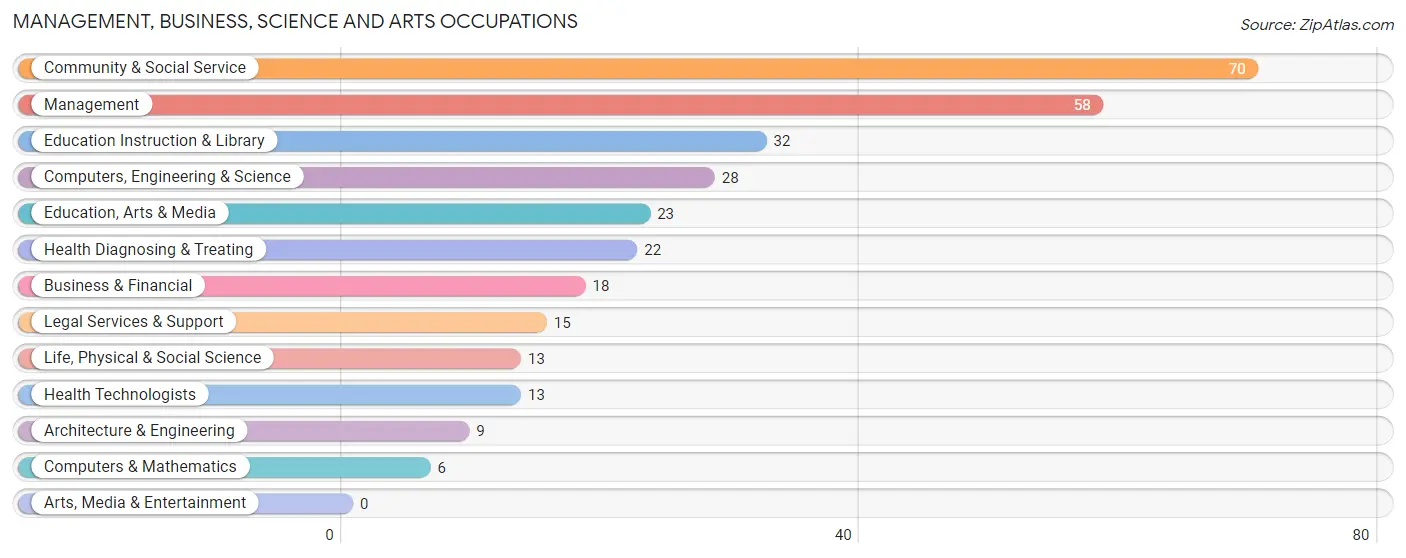
Management, Business, Science and Arts Occupations
The most common Management, Business, Science and Arts occupations in Random Lake are Community & Social Service (70 | 8.9%), Management (58 | 7.4%), Education Instruction & Library (32 | 4.1%), Computers, Engineering & Science (28 | 3.6%), and Education, Arts & Media (23 | 2.9%).
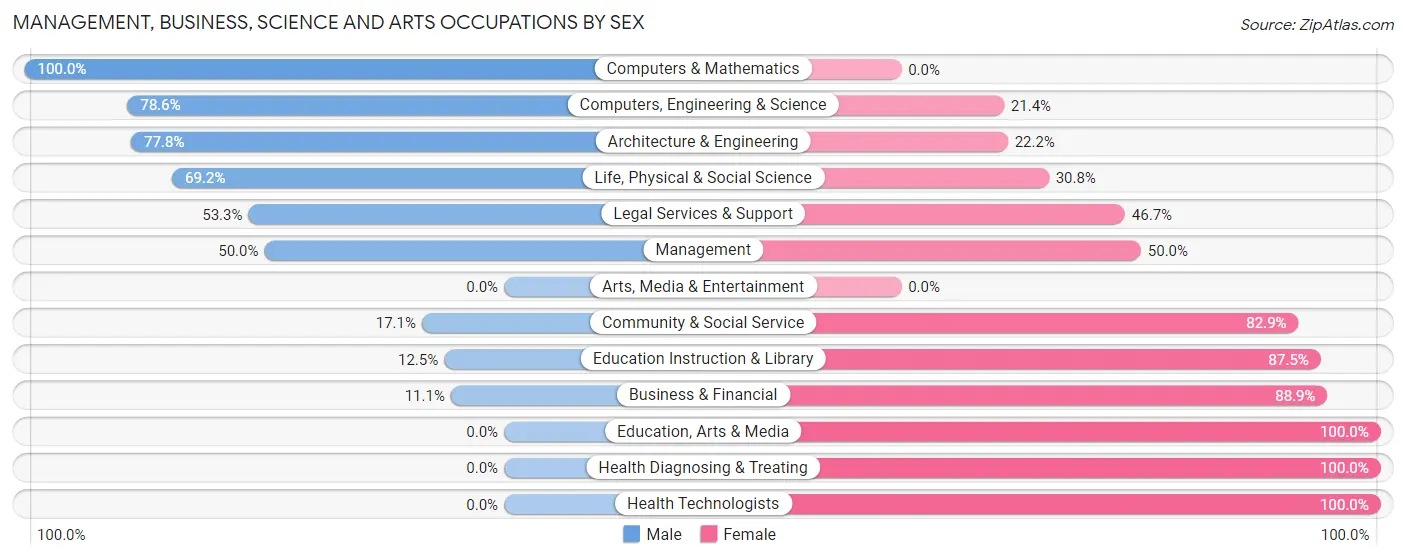
Management, Business, Science and Arts Occupations by Sex
Within the Management, Business, Science and Arts occupations in Random Lake, the most male-oriented occupations are Computers & Mathematics (100.0%), Computers, Engineering & Science (78.6%), and Architecture & Engineering (77.8%), while the most female-oriented occupations are Education, Arts & Media (100.0%), Health Diagnosing & Treating (100.0%), and Health Technologists (100.0%).
| Occupation | Male | Female |
| Management | 29 (50.0%) | 29 (50.0%) |
| Business & Financial | 2 (11.1%) | 16 (88.9%) |
| Computers, Engineering & Science | 22 (78.6%) | 6 (21.4%) |
| Computers & Mathematics | 6 (100.0%) | 0 (0.0%) |
| Architecture & Engineering | 7 (77.8%) | 2 (22.2%) |
| Life, Physical & Social Science | 9 (69.2%) | 4 (30.8%) |
| Community & Social Service | 12 (17.1%) | 58 (82.9%) |
| Education, Arts & Media | 0 (0.0%) | 23 (100.0%) |
| Legal Services & Support | 8 (53.3%) | 7 (46.7%) |
| Education Instruction & Library | 4 (12.5%) | 28 (87.5%) |
| Arts, Media & Entertainment | 0 (0.0%) | 0 (0.0%) |
| Health Diagnosing & Treating | 0 (0.0%) | 22 (100.0%) |
| Health Technologists | 0 (0.0%) | 13 (100.0%) |
| Total (Category) | 65 (33.2%) | 131 (66.8%) |
| Total (Overall) | 435 (55.3%) | 352 (44.7%) |
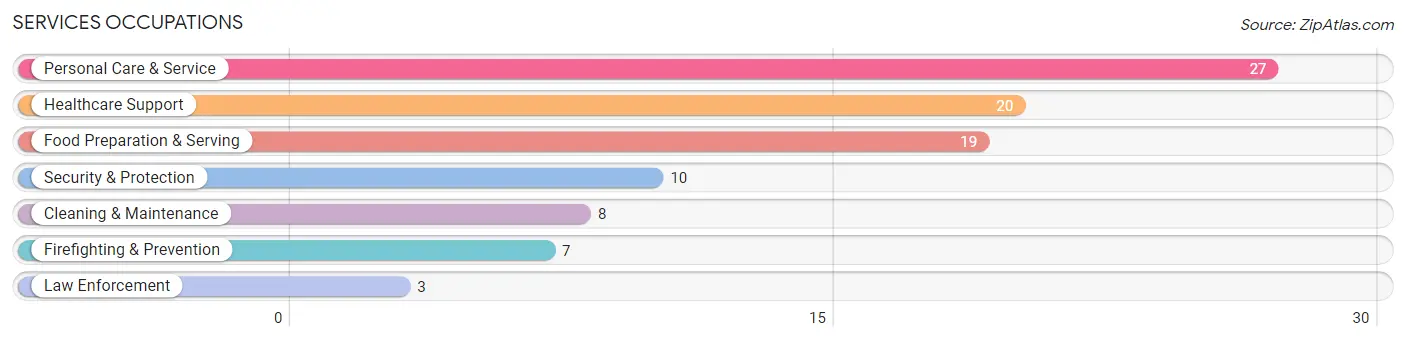
Services Occupations
The most common Services occupations in Random Lake are Personal Care & Service (27 | 3.4%), Healthcare Support (20 | 2.5%), Food Preparation & Serving (19 | 2.4%), Security & Protection (10 | 1.3%), and Cleaning & Maintenance (8 | 1.0%).
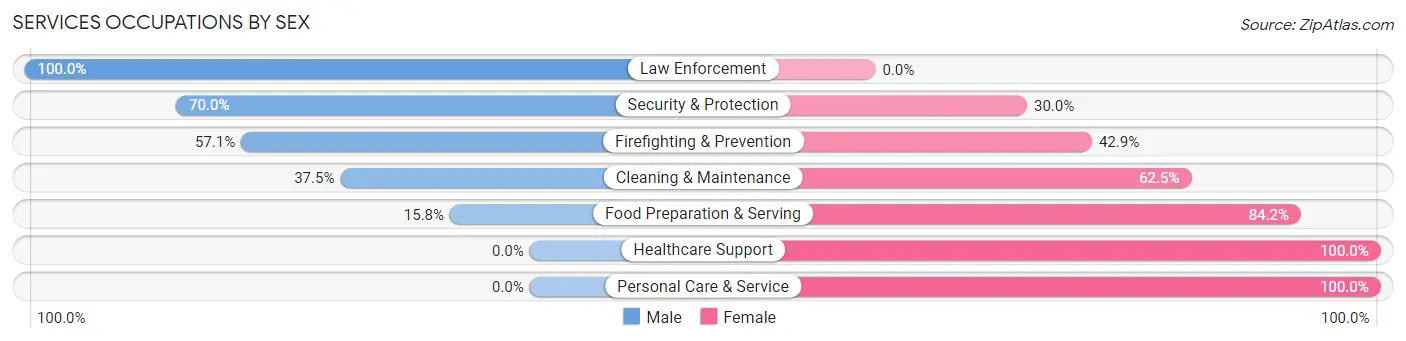
Services Occupations by Sex
Within the Services occupations in Random Lake, the most male-oriented occupations are Law Enforcement (100.0%), Security & Protection (70.0%), and Firefighting & Prevention (57.1%), while the most female-oriented occupations are Healthcare Support (100.0%), Personal Care & Service (100.0%), and Food Preparation & Serving (84.2%).
| Occupation | Male | Female |
| Healthcare Support | 0 (0.0%) | 20 (100.0%) |
| Security & Protection | 7 (70.0%) | 3 (30.0%) |
| Firefighting & Prevention | 4 (57.1%) | 3 (42.9%) |
| Law Enforcement | 3 (100.0%) | 0 (0.0%) |
| Food Preparation & Serving | 3 (15.8%) | 16 (84.2%) |
| Cleaning & Maintenance | 3 (37.5%) | 5 (62.5%) |
| Personal Care & Service | 0 (0.0%) | 27 (100.0%) |
| Total (Category) | 13 (15.5%) | 71 (84.5%) |
| Total (Overall) | 435 (55.3%) | 352 (44.7%) |
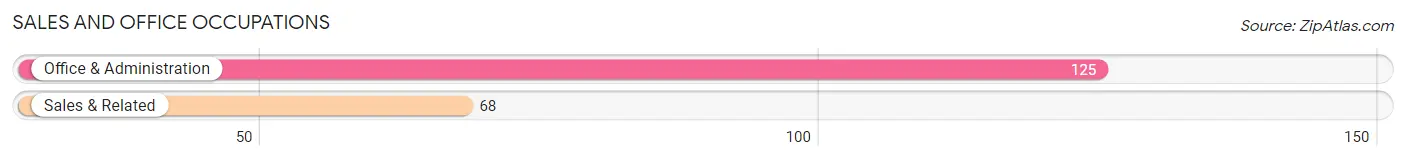
Sales and Office Occupations
The most common Sales and Office occupations in Random Lake are Office & Administration (125 | 15.9%), and Sales & Related (68 | 8.6%).
Sales and Office Occupations by Sex
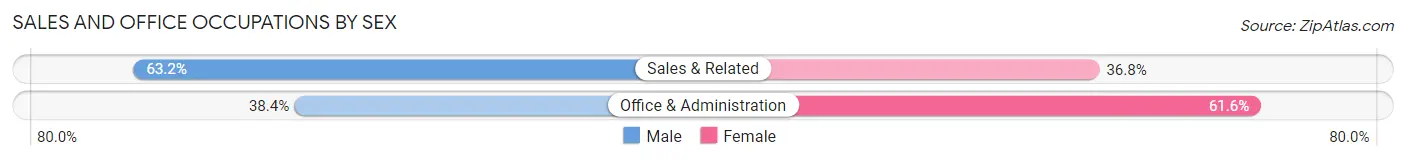
| Occupation | Male | Female |
| Sales & Related | 43 (63.2%) | 25 (36.8%) |
| Office & Administration | 48 (38.4%) | 77 (61.6%) |
| Total (Category) | 91 (47.1%) | 102 (52.8%) |
| Total (Overall) | 435 (55.3%) | 352 (44.7%) |
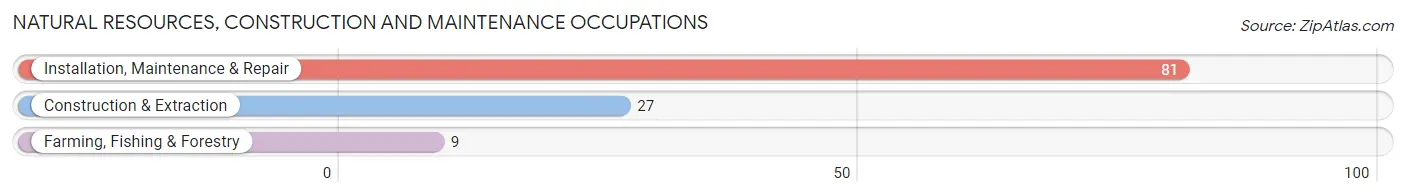
Natural Resources, Construction and Maintenance Occupations
The most common Natural Resources, Construction and Maintenance occupations in Random Lake are Installation, Maintenance & Repair (81 | 10.3%), Construction & Extraction (27 | 3.4%), and Farming, Fishing & Forestry (9 | 1.1%).
Natural Resources, Construction and Maintenance Occupations by Sex
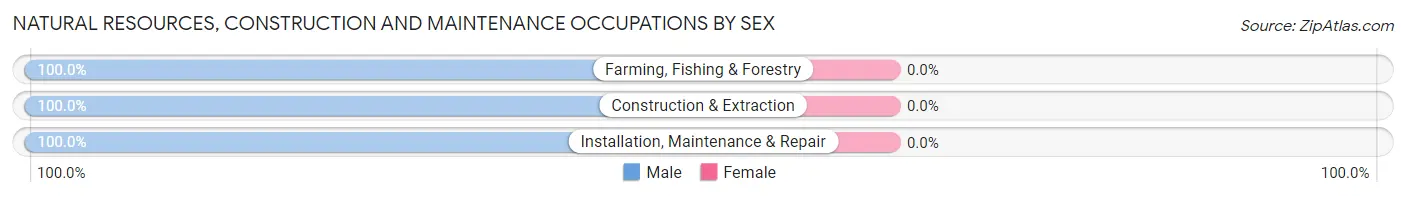
| Occupation | Male | Female |
| Farming, Fishing & Forestry | 9 (100.0%) | 0 (0.0%) |
| Construction & Extraction | 27 (100.0%) | 0 (0.0%) |
| Installation, Maintenance & Repair | 81 (100.0%) | 0 (0.0%) |
| Total (Category) | 117 (100.0%) | 0 (0.0%) |
| Total (Overall) | 435 (55.3%) | 352 (44.7%) |
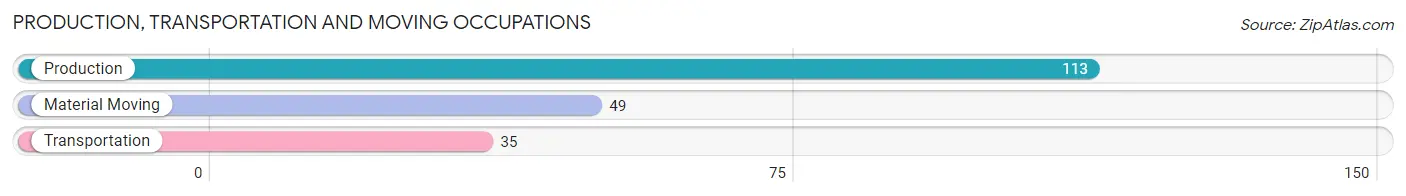
Production, Transportation and Moving Occupations
The most common Production, Transportation and Moving occupations in Random Lake are Production (113 | 14.4%), Material Moving (49 | 6.2%), and Transportation (35 | 4.4%).
Production, Transportation and Moving Occupations by Sex
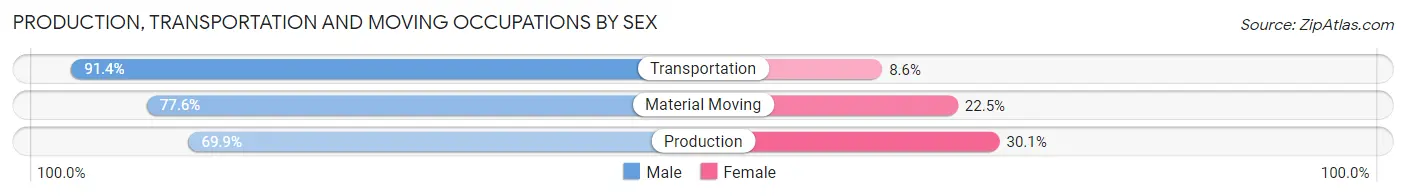
| Occupation | Male | Female |
| Production | 79 (69.9%) | 34 (30.1%) |
| Transportation | 32 (91.4%) | 3 (8.6%) |
| Material Moving | 38 (77.5%) | 11 (22.5%) |
| Total (Category) | 149 (75.6%) | 48 (24.4%) |
| Total (Overall) | 435 (55.3%) | 352 (44.7%) |
Employment Industries by Sex in Random Lake
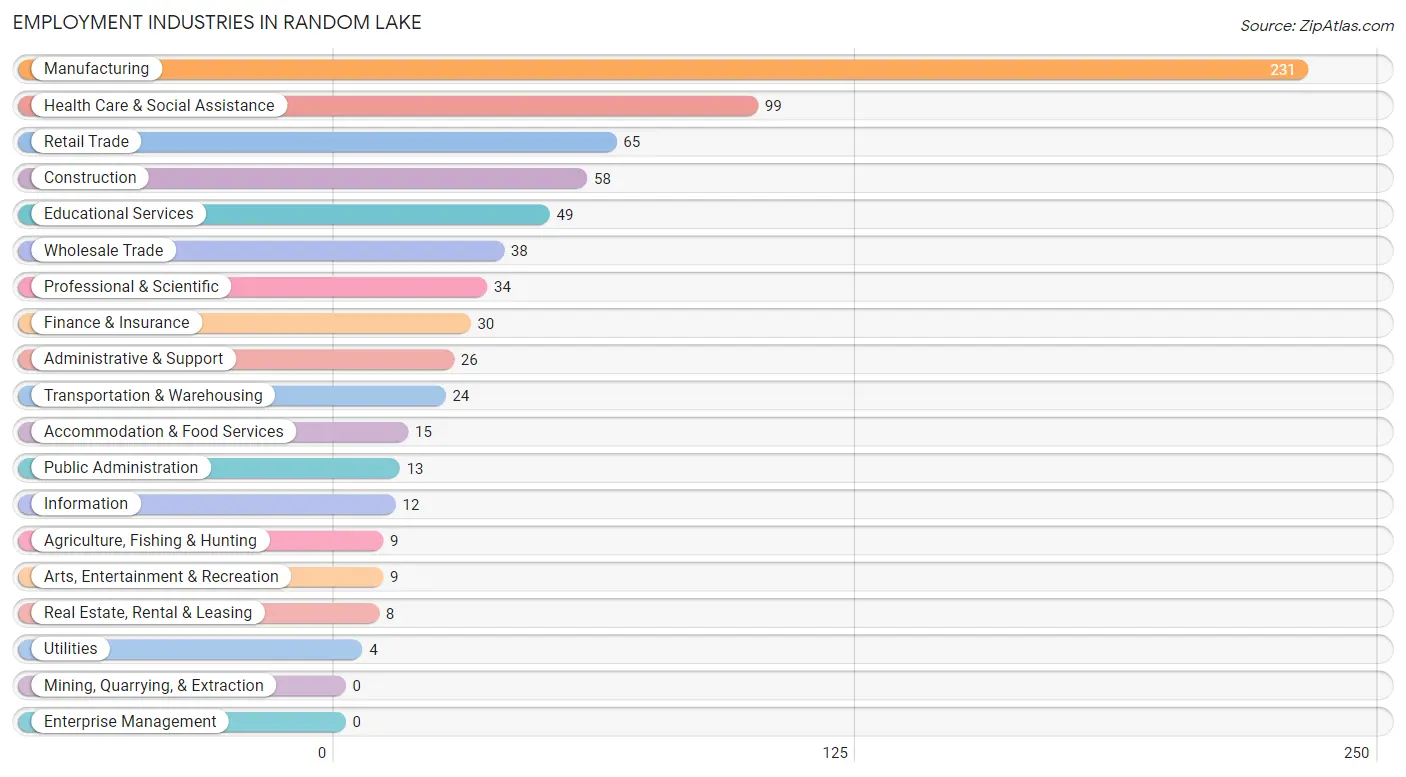
Employment Industries in Random Lake
The major employment industries in Random Lake include Manufacturing (231 | 29.3%), Health Care & Social Assistance (99 | 12.6%), Retail Trade (65 | 8.3%), Construction (58 | 7.4%), and Educational Services (49 | 6.2%).
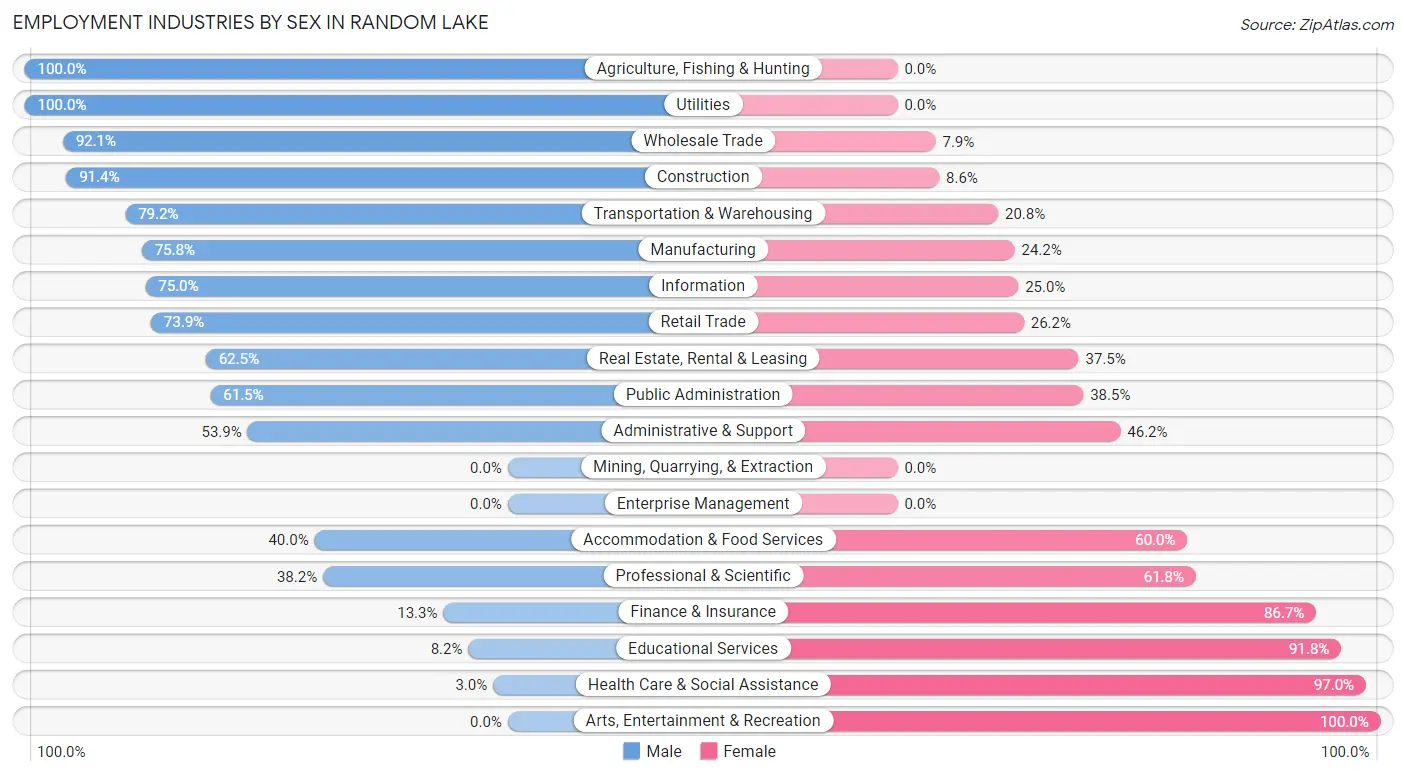
Employment Industries by Sex in Random Lake
The Random Lake industries that see more men than women are Agriculture, Fishing & Hunting (100.0%), Utilities (100.0%), and Wholesale Trade (92.1%), whereas the industries that tend to have a higher number of women are Arts, Entertainment & Recreation (100.0%), Health Care & Social Assistance (97.0%), and Educational Services (91.8%).
| Industry | Male | Female |
| Agriculture, Fishing & Hunting | 9 (100.0%) | 0 (0.0%) |
| Mining, Quarrying, & Extraction | 0 (0.0%) | 0 (0.0%) |
| Construction | 53 (91.4%) | 5 (8.6%) |
| Manufacturing | 175 (75.8%) | 56 (24.2%) |
| Wholesale Trade | 35 (92.1%) | 3 (7.9%) |
| Retail Trade | 48 (73.9%) | 17 (26.2%) |
| Transportation & Warehousing | 19 (79.2%) | 5 (20.8%) |
| Utilities | 4 (100.0%) | 0 (0.0%) |
| Information | 9 (75.0%) | 3 (25.0%) |
| Finance & Insurance | 4 (13.3%) | 26 (86.7%) |
| Real Estate, Rental & Leasing | 5 (62.5%) | 3 (37.5%) |
| Professional & Scientific | 13 (38.2%) | 21 (61.8%) |
| Enterprise Management | 0 (0.0%) | 0 (0.0%) |
| Administrative & Support | 14 (53.8%) | 12 (46.2%) |
| Educational Services | 4 (8.2%) | 45 (91.8%) |
| Health Care & Social Assistance | 3 (3.0%) | 96 (97.0%) |
| Arts, Entertainment & Recreation | 0 (0.0%) | 9 (100.0%) |
| Accommodation & Food Services | 6 (40.0%) | 9 (60.0%) |
| Public Administration | 8 (61.5%) | 5 (38.5%) |
| Total | 435 (55.3%) | 352 (44.7%) |
Education in Random Lake
School Enrollment in Random Lake
The most common levels of schooling among the 264 students in Random Lake are middle school (93 | 35.2%), high school (75 | 28.4%), and elementary school (39 | 14.8%).
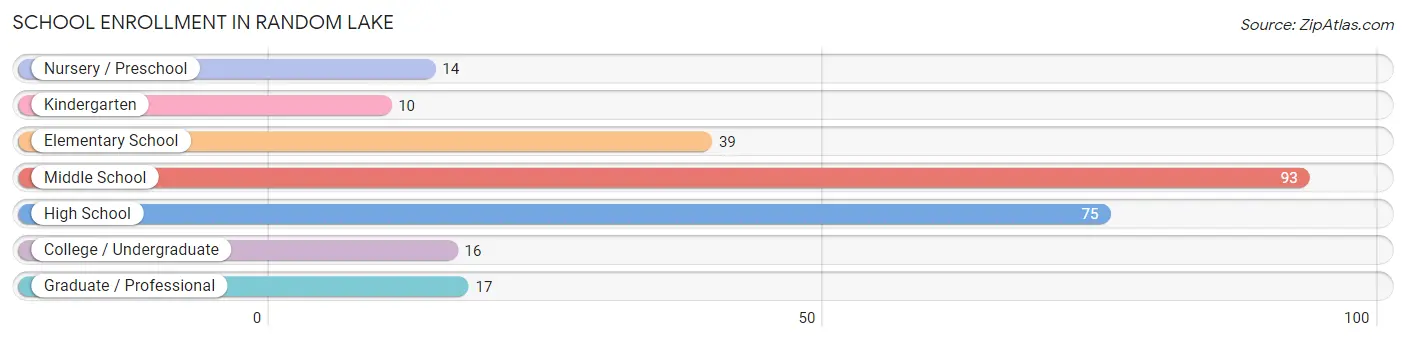
| School Level | # Students | % Students |
| Nursery / Preschool | 14 | 5.3% |
| Kindergarten | 10 | 3.8% |
| Elementary School | 39 | 14.8% |
| Middle School | 93 | 35.2% |
| High School | 75 | 28.4% |
| College / Undergraduate | 16 | 6.1% |
| Graduate / Professional | 17 | 6.4% |
| Total | 264 | 100.0% |
School Enrollment by Age by Funding Source in Random Lake
Out of a total of 264 students who are enrolled in schools in Random Lake, 35 (13.3%) attend a private institution, while the remaining 229 (86.7%) are enrolled in public schools. The age group of 25 to 34 year olds has the highest likelihood of being enrolled in private schools, with 6 (100.0% in the age bracket) enrolled. Conversely, the age group of 5 to 9 year old has the lowest likelihood of being enrolled in a private school, with 51 (100.0% in the age bracket) attending a public institution.
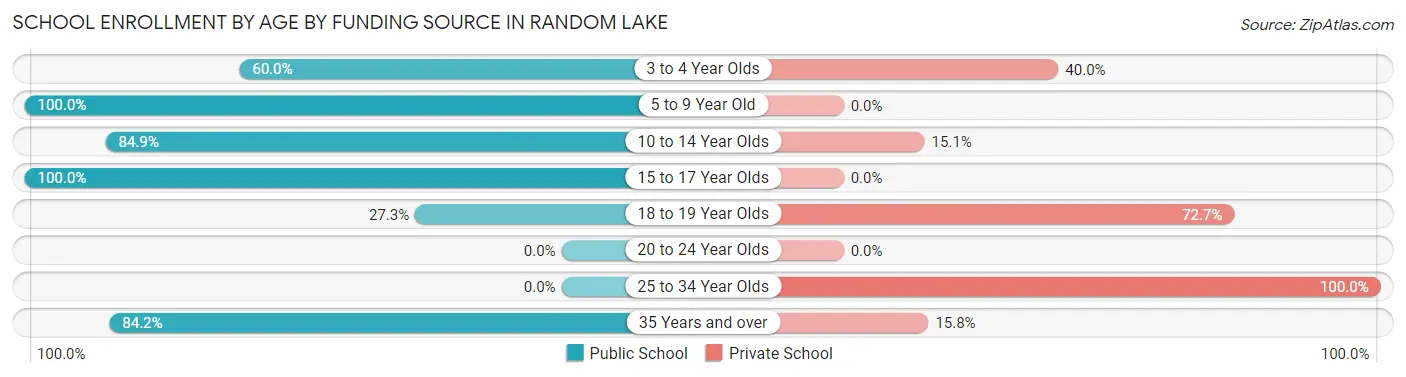
| Age Bracket | Public School | Private School |
| 3 to 4 Year Olds | 3 (60.0%) | 2 (40.0%) |
| 5 to 9 Year Old | 51 (100.0%) | 0 (0.0%) |
| 10 to 14 Year Olds | 90 (84.9%) | 16 (15.1%) |
| 15 to 17 Year Olds | 66 (100.0%) | 0 (0.0%) |
| 18 to 19 Year Olds | 3 (27.3%) | 8 (72.7%) |
| 20 to 24 Year Olds | 0 (0.0%) | 0 (0.0%) |
| 25 to 34 Year Olds | 0 (0.0%) | 6 (100.0%) |
| 35 Years and over | 16 (84.2%) | 3 (15.8%) |
| Total | 229 (86.7%) | 35 (13.3%) |
Educational Attainment by Field of Study in Random Lake
Business (64 | 19.1%), education (64 | 19.1%), liberal arts & history (48 | 14.3%), psychology (29 | 8.7%), and social sciences (27 | 8.1%) are the most common fields of study among 335 individuals in Random Lake who have obtained a bachelor's degree or higher.
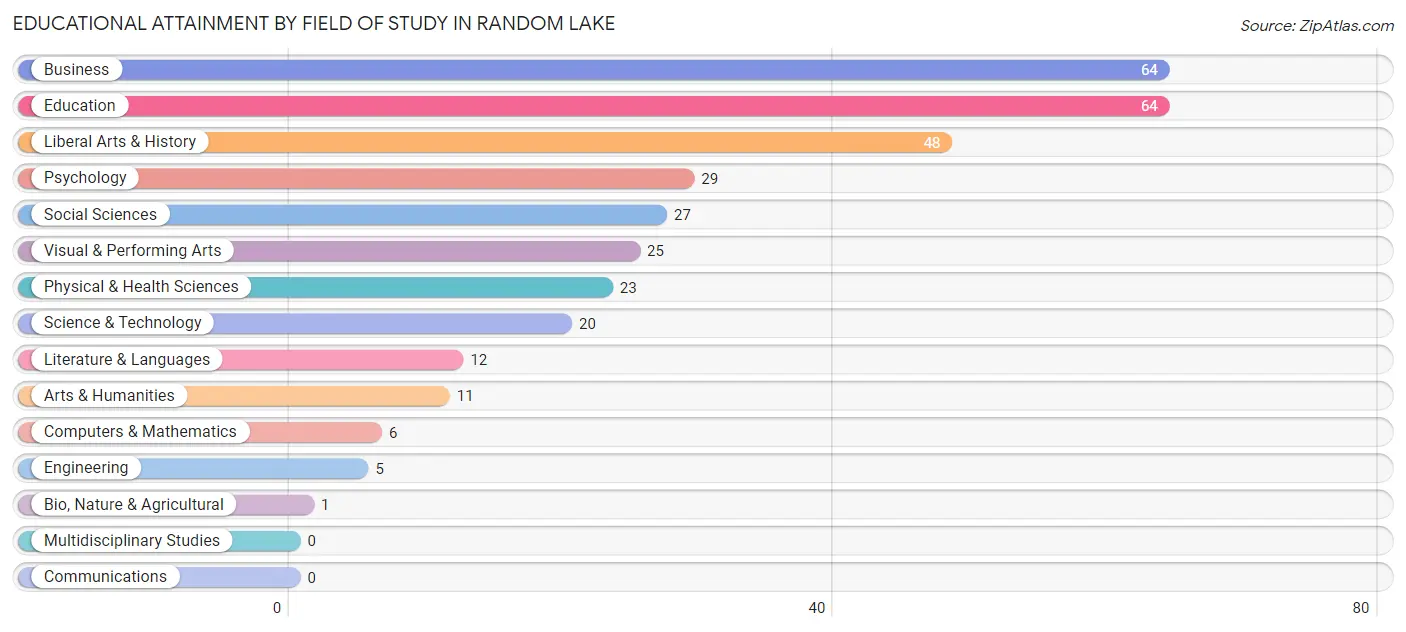
| Field of Study | # Graduates | % Graduates |
| Computers & Mathematics | 6 | 1.8% |
| Bio, Nature & Agricultural | 1 | 0.3% |
| Physical & Health Sciences | 23 | 6.9% |
| Psychology | 29 | 8.7% |
| Social Sciences | 27 | 8.1% |
| Engineering | 5 | 1.5% |
| Multidisciplinary Studies | 0 | 0.0% |
| Science & Technology | 20 | 6.0% |
| Business | 64 | 19.1% |
| Education | 64 | 19.1% |
| Literature & Languages | 12 | 3.6% |
| Liberal Arts & History | 48 | 14.3% |
| Visual & Performing Arts | 25 | 7.5% |
| Communications | 0 | 0.0% |
| Arts & Humanities | 11 | 3.3% |
| Total | 335 | 100.0% |
Transportation & Commute in Random Lake
Vehicle Availability by Sex in Random Lake
The most prevalent vehicle ownership categories in Random Lake are males with 2 vehicles (218, accounting for 50.5%) and females with 2 vehicles (155, making up 63.4%).
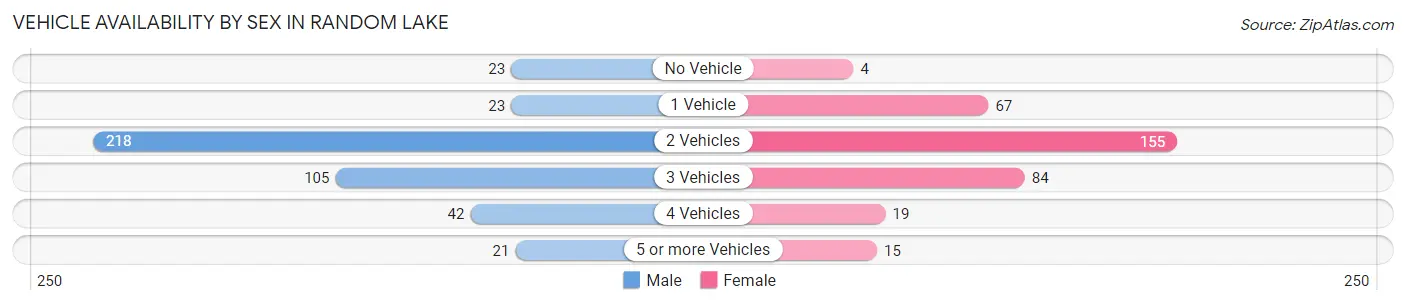
| Vehicles Available | Male | Female |
| No Vehicle | 23 (5.3%) | 4 (1.2%) |
| 1 Vehicle | 23 (5.3%) | 67 (19.5%) |
| 2 Vehicles | 218 (50.5%) | 155 (45.1%) |
| 3 Vehicles | 105 (24.3%) | 84 (24.4%) |
| 4 Vehicles | 42 (9.7%) | 19 (5.5%) |
| 5 or more Vehicles | 21 (4.9%) | 15 (4.4%) |
| Total | 432 (100.0%) | 344 (100.0%) |
Commute Time in Random Lake
The most frequently occuring commute durations in Random Lake are 20 to 24 minutes (113 commuters, 15.9%), 30 to 34 minutes (111 commuters, 15.6%), and 5 to 9 minutes (87 commuters, 12.2%).
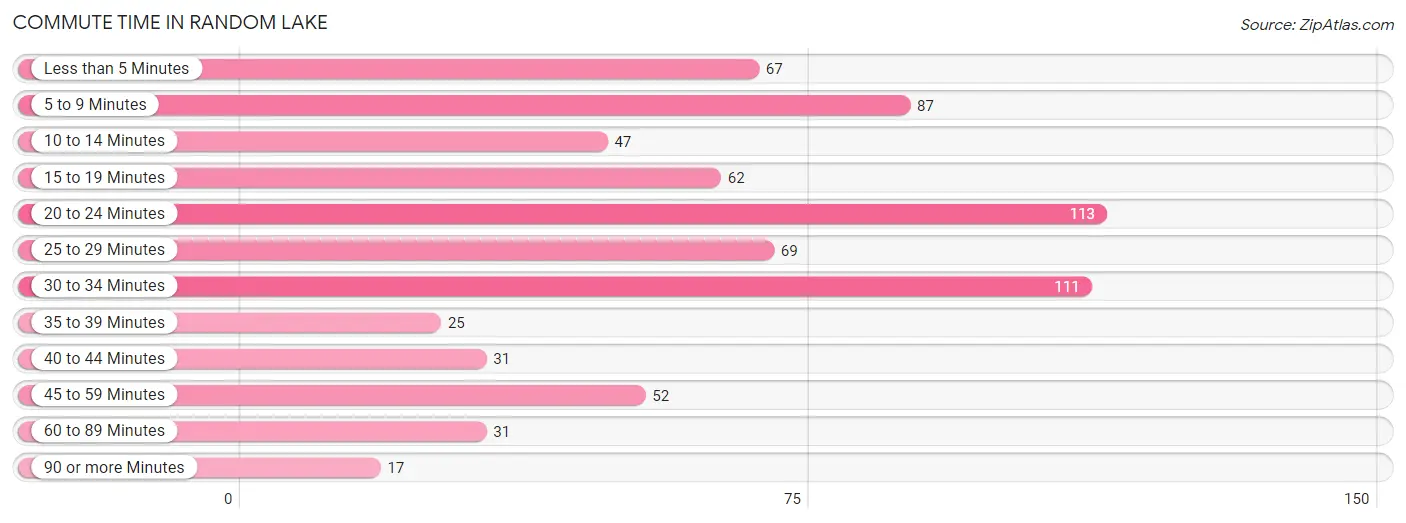
| Commute Time | # Commuters | % Commuters |
| Less than 5 Minutes | 67 | 9.4% |
| 5 to 9 Minutes | 87 | 12.2% |
| 10 to 14 Minutes | 47 | 6.6% |
| 15 to 19 Minutes | 62 | 8.7% |
| 20 to 24 Minutes | 113 | 15.9% |
| 25 to 29 Minutes | 69 | 9.7% |
| 30 to 34 Minutes | 111 | 15.6% |
| 35 to 39 Minutes | 25 | 3.5% |
| 40 to 44 Minutes | 31 | 4.3% |
| 45 to 59 Minutes | 52 | 7.3% |
| 60 to 89 Minutes | 31 | 4.3% |
| 90 or more Minutes | 17 | 2.4% |
Commute Time by Sex in Random Lake
The most common commute times in Random Lake are 20 to 24 minutes (71 commuters, 17.5%) for males and 30 to 34 minutes (66 commuters, 21.6%) for females.
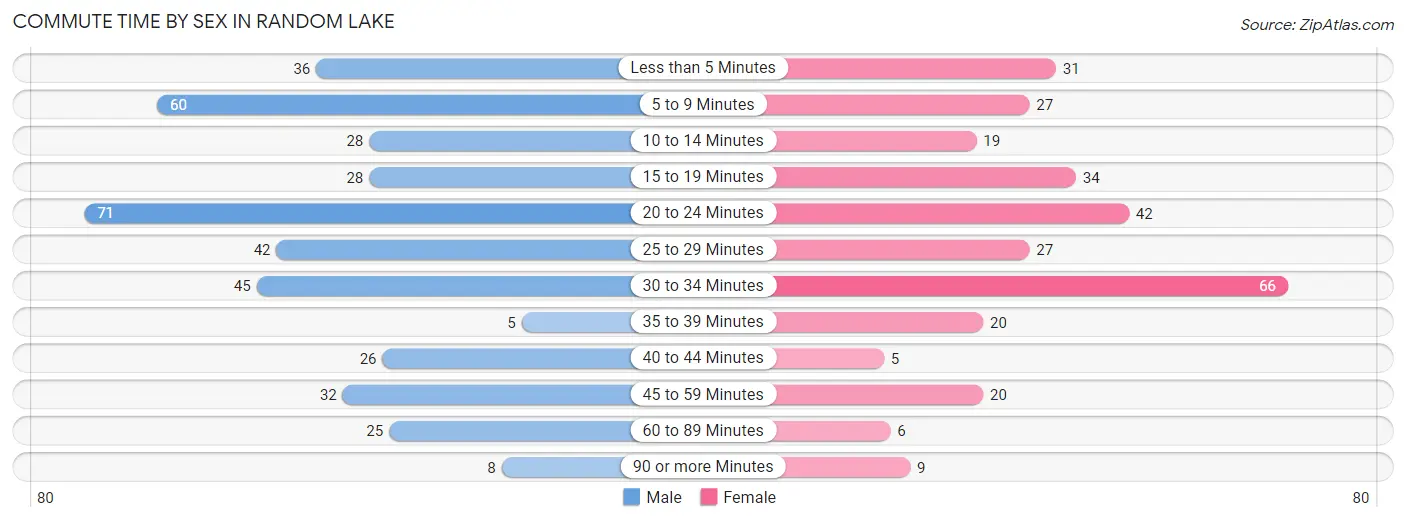
| Commute Time | Male | Female |
| Less than 5 Minutes | 36 (8.9%) | 31 (10.1%) |
| 5 to 9 Minutes | 60 (14.8%) | 27 (8.8%) |
| 10 to 14 Minutes | 28 (6.9%) | 19 (6.2%) |
| 15 to 19 Minutes | 28 (6.9%) | 34 (11.1%) |
| 20 to 24 Minutes | 71 (17.5%) | 42 (13.7%) |
| 25 to 29 Minutes | 42 (10.3%) | 27 (8.8%) |
| 30 to 34 Minutes | 45 (11.1%) | 66 (21.6%) |
| 35 to 39 Minutes | 5 (1.2%) | 20 (6.5%) |
| 40 to 44 Minutes | 26 (6.4%) | 5 (1.6%) |
| 45 to 59 Minutes | 32 (7.9%) | 20 (6.5%) |
| 60 to 89 Minutes | 25 (6.2%) | 6 (2.0%) |
| 90 or more Minutes | 8 (2.0%) | 9 (2.9%) |
Time of Departure to Work by Sex in Random Lake
The most frequent times of departure to work in Random Lake are 12:00 AM to 4:59 AM (82, 20.2%) for males and 7:30 AM to 7:59 AM (60, 19.6%) for females.
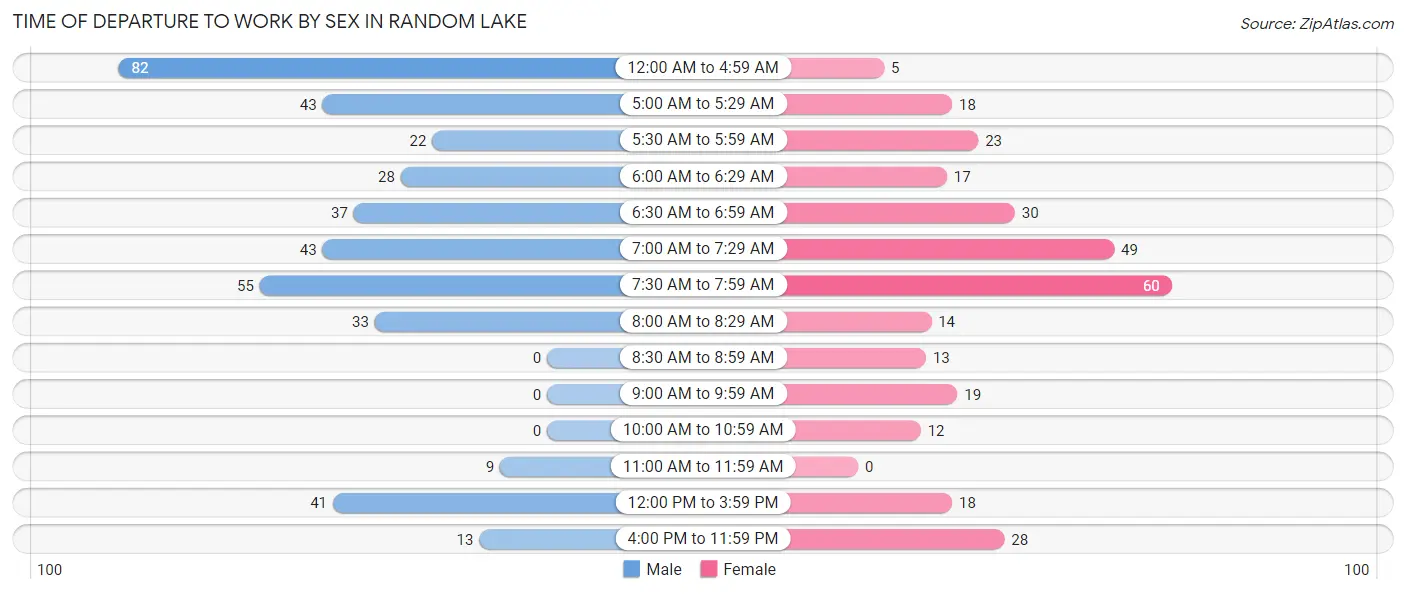
| Time of Departure | Male | Female |
| 12:00 AM to 4:59 AM | 82 (20.2%) | 5 (1.6%) |
| 5:00 AM to 5:29 AM | 43 (10.6%) | 18 (5.9%) |
| 5:30 AM to 5:59 AM | 22 (5.4%) | 23 (7.5%) |
| 6:00 AM to 6:29 AM | 28 (6.9%) | 17 (5.6%) |
| 6:30 AM to 6:59 AM | 37 (9.1%) | 30 (9.8%) |
| 7:00 AM to 7:29 AM | 43 (10.6%) | 49 (16.0%) |
| 7:30 AM to 7:59 AM | 55 (13.6%) | 60 (19.6%) |
| 8:00 AM to 8:29 AM | 33 (8.1%) | 14 (4.6%) |
| 8:30 AM to 8:59 AM | 0 (0.0%) | 13 (4.3%) |
| 9:00 AM to 9:59 AM | 0 (0.0%) | 19 (6.2%) |
| 10:00 AM to 10:59 AM | 0 (0.0%) | 12 (3.9%) |
| 11:00 AM to 11:59 AM | 9 (2.2%) | 0 (0.0%) |
| 12:00 PM to 3:59 PM | 41 (10.1%) | 18 (5.9%) |
| 4:00 PM to 11:59 PM | 13 (3.2%) | 28 (9.1%) |
| Total | 406 (100.0%) | 306 (100.0%) |
Housing Occupancy in Random Lake
Occupancy by Ownership in Random Lake
Of the total 680 dwellings in Random Lake, owner-occupied units account for 507 (74.6%), while renter-occupied units make up 173 (25.4%).
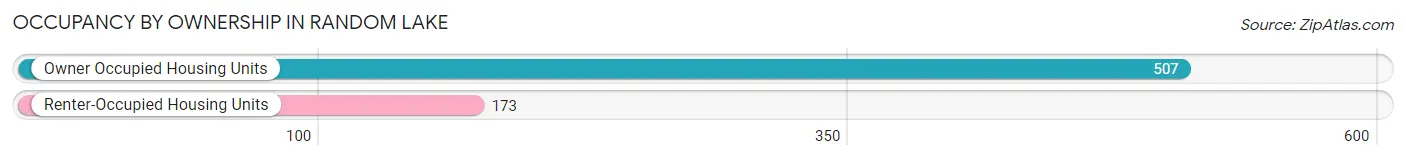
| Occupancy | # Housing Units | % Housing Units |
| Owner Occupied Housing Units | 507 | 74.6% |
| Renter-Occupied Housing Units | 173 | 25.4% |
| Total Occupied Housing Units | 680 | 100.0% |
Occupancy by Household Size in Random Lake
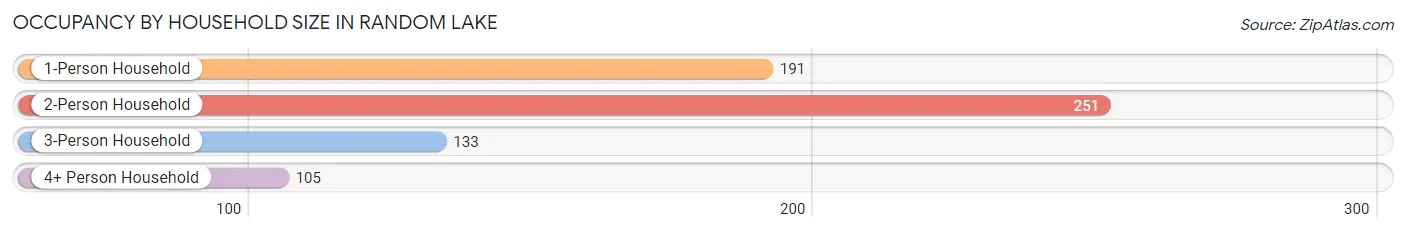
| Household Size | # Housing Units | % Housing Units |
| 1-Person Household | 191 | 28.1% |
| 2-Person Household | 251 | 36.9% |
| 3-Person Household | 133 | 19.6% |
| 4+ Person Household | 105 | 15.4% |
| Total Housing Units | 680 | 100.0% |
Occupancy by Ownership by Household Size in Random Lake
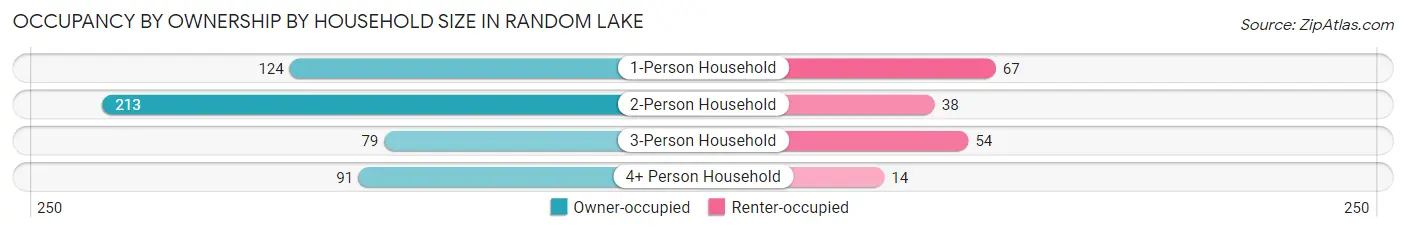
| Household Size | Owner-occupied | Renter-occupied |
| 1-Person Household | 124 (64.9%) | 67 (35.1%) |
| 2-Person Household | 213 (84.9%) | 38 (15.1%) |
| 3-Person Household | 79 (59.4%) | 54 (40.6%) |
| 4+ Person Household | 91 (86.7%) | 14 (13.3%) |
| Total Housing Units | 507 (74.6%) | 173 (25.4%) |
Occupancy by Educational Attainment in Random Lake
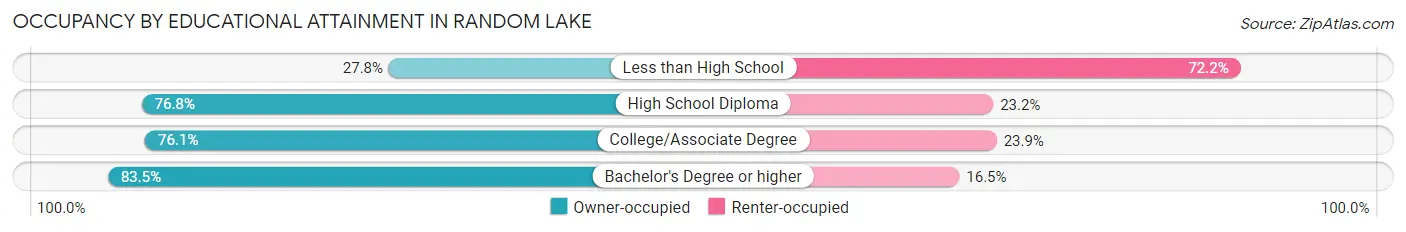
| Household Size | Owner-occupied | Renter-occupied |
| Less than High School | 15 (27.8%) | 39 (72.2%) |
| High School Diploma | 139 (76.8%) | 42 (23.2%) |
| College/Associate Degree | 191 (76.1%) | 60 (23.9%) |
| Bachelor's Degree or higher | 162 (83.5%) | 32 (16.5%) |
Occupancy by Age of Householder in Random Lake
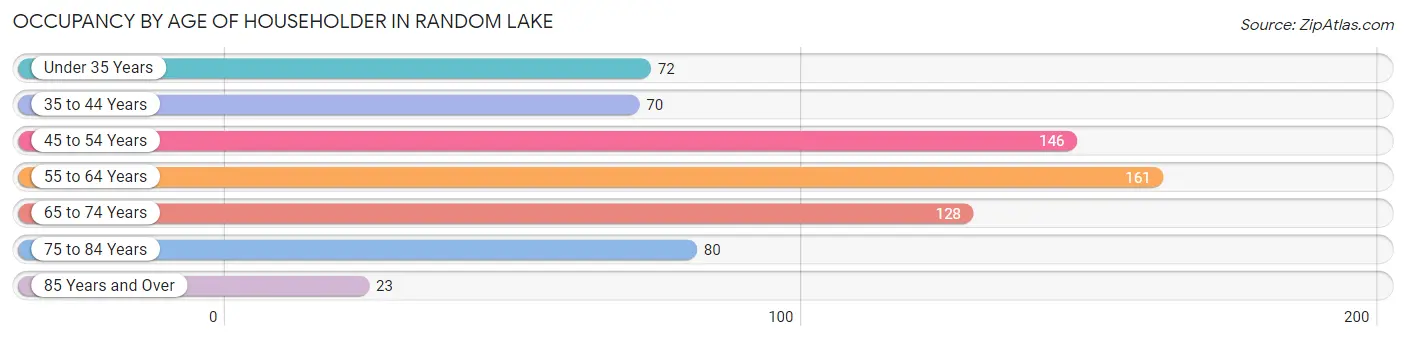
| Age Bracket | # Households | % Households |
| Under 35 Years | 72 | 10.6% |
| 35 to 44 Years | 70 | 10.3% |
| 45 to 54 Years | 146 | 21.5% |
| 55 to 64 Years | 161 | 23.7% |
| 65 to 74 Years | 128 | 18.8% |
| 75 to 84 Years | 80 | 11.8% |
| 85 Years and Over | 23 | 3.4% |
| Total | 680 | 100.0% |
Housing Finances in Random Lake
Median Income by Occupancy in Random Lake
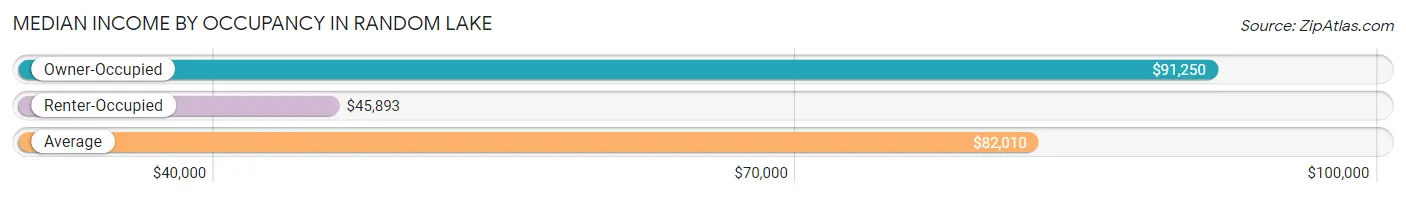
| Occupancy Type | # Households | Median Income |
| Owner-Occupied | 507 (74.6%) | $91,250 |
| Renter-Occupied | 173 (25.4%) | $45,893 |
| Average | 680 (100.0%) | $82,010 |
Occupancy by Householder Income Bracket in Random Lake
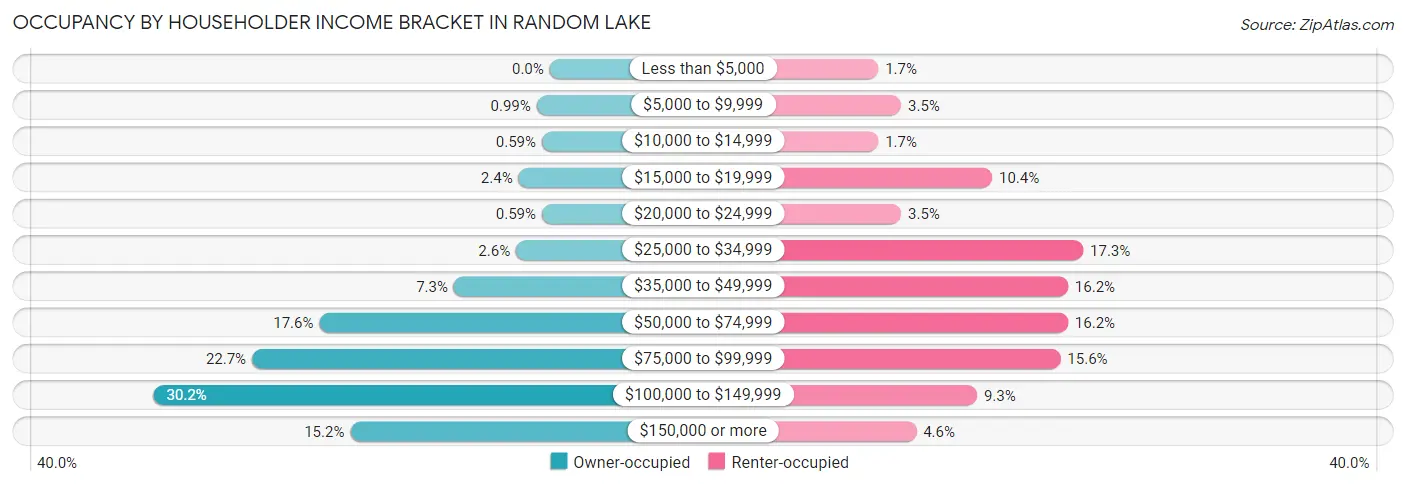
| Income Bracket | Owner-occupied | Renter-occupied |
| Less than $5,000 | 0 (0.0%) | 3 (1.7%) |
| $5,000 to $9,999 | 5 (1.0%) | 6 (3.5%) |
| $10,000 to $14,999 | 3 (0.6%) | 3 (1.7%) |
| $15,000 to $19,999 | 12 (2.4%) | 18 (10.4%) |
| $20,000 to $24,999 | 3 (0.6%) | 6 (3.5%) |
| $25,000 to $34,999 | 13 (2.6%) | 30 (17.3%) |
| $35,000 to $49,999 | 37 (7.3%) | 28 (16.2%) |
| $50,000 to $74,999 | 89 (17.5%) | 28 (16.2%) |
| $75,000 to $99,999 | 115 (22.7%) | 27 (15.6%) |
| $100,000 to $149,999 | 153 (30.2%) | 16 (9.2%) |
| $150,000 or more | 77 (15.2%) | 8 (4.6%) |
| Total | 507 (100.0%) | 173 (100.0%) |
Monthly Housing Cost Tiers in Random Lake
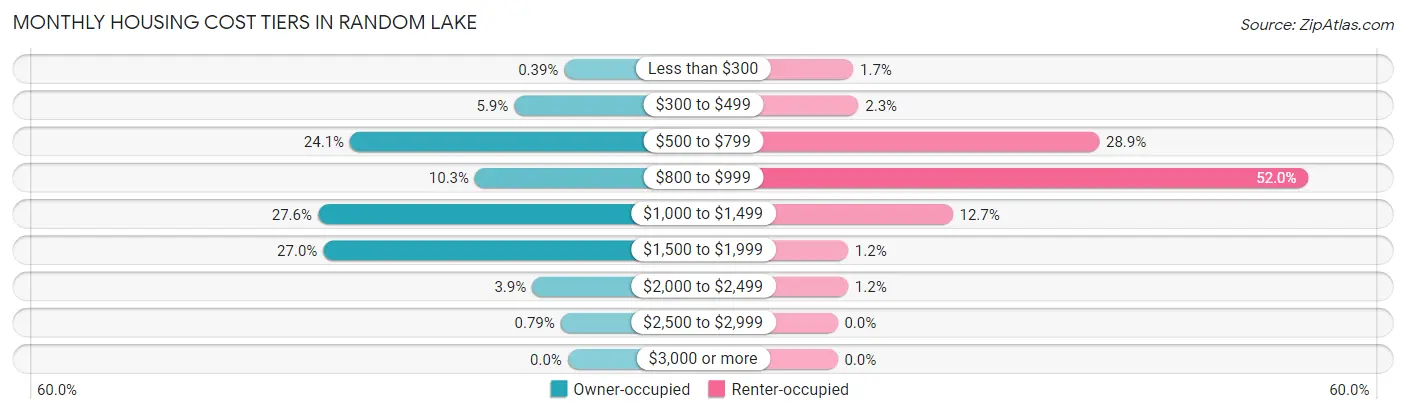
| Monthly Cost | Owner-occupied | Renter-occupied |
| Less than $300 | 2 (0.4%) | 3 (1.7%) |
| $300 to $499 | 30 (5.9%) | 4 (2.3%) |
| $500 to $799 | 122 (24.1%) | 50 (28.9%) |
| $800 to $999 | 52 (10.3%) | 90 (52.0%) |
| $1,000 to $1,499 | 140 (27.6%) | 22 (12.7%) |
| $1,500 to $1,999 | 137 (27.0%) | 2 (1.2%) |
| $2,000 to $2,499 | 20 (3.9%) | 2 (1.2%) |
| $2,500 to $2,999 | 4 (0.8%) | 0 (0.0%) |
| $3,000 or more | 0 (0.0%) | 0 (0.0%) |
| Total | 507 (100.0%) | 173 (100.0%) |
Physical Housing Characteristics in Random Lake
Housing Structures in Random Lake
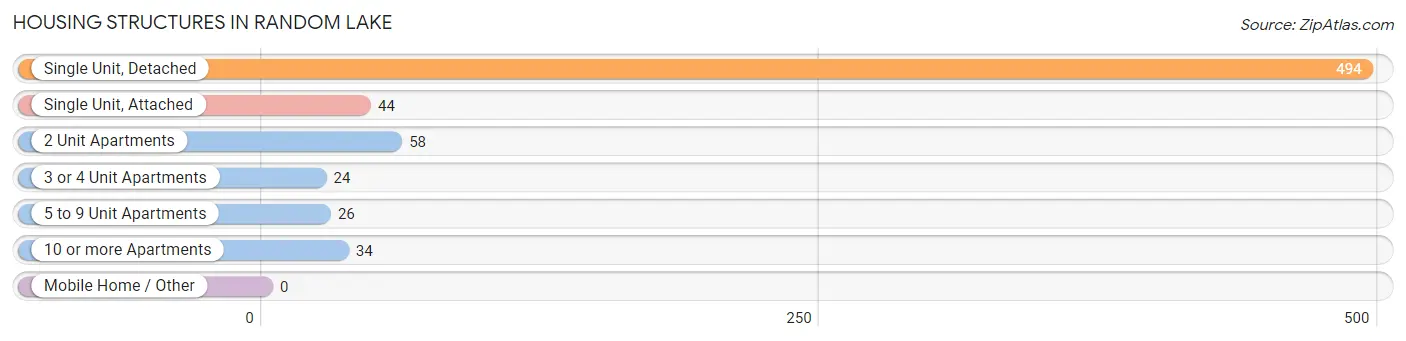
| Structure Type | # Housing Units | % Housing Units |
| Single Unit, Detached | 494 | 72.7% |
| Single Unit, Attached | 44 | 6.5% |
| 2 Unit Apartments | 58 | 8.5% |
| 3 or 4 Unit Apartments | 24 | 3.5% |
| 5 to 9 Unit Apartments | 26 | 3.8% |
| 10 or more Apartments | 34 | 5.0% |
| Mobile Home / Other | 0 | 0.0% |
| Total | 680 | 100.0% |
Housing Structures by Occupancy in Random Lake
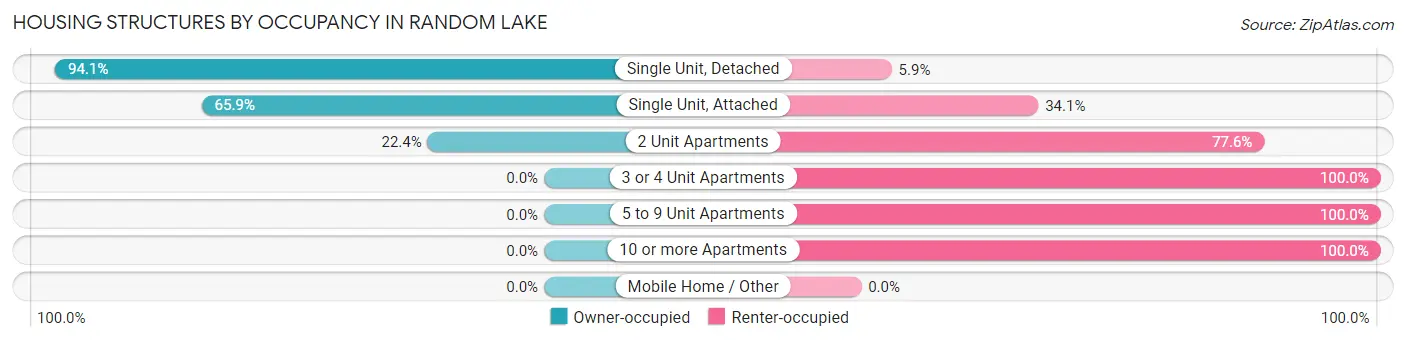
| Structure Type | Owner-occupied | Renter-occupied |
| Single Unit, Detached | 465 (94.1%) | 29 (5.9%) |
| Single Unit, Attached | 29 (65.9%) | 15 (34.1%) |
| 2 Unit Apartments | 13 (22.4%) | 45 (77.6%) |
| 3 or 4 Unit Apartments | 0 (0.0%) | 24 (100.0%) |
| 5 to 9 Unit Apartments | 0 (0.0%) | 26 (100.0%) |
| 10 or more Apartments | 0 (0.0%) | 34 (100.0%) |
| Mobile Home / Other | 0 (0.0%) | 0 (0.0%) |
| Total | 507 (74.6%) | 173 (25.4%) |
Housing Structures by Number of Rooms in Random Lake
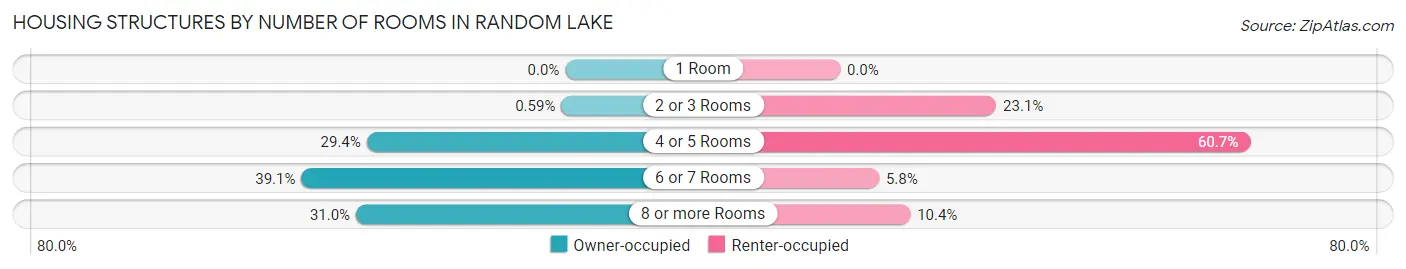
| Number of Rooms | Owner-occupied | Renter-occupied |
| 1 Room | 0 (0.0%) | 0 (0.0%) |
| 2 or 3 Rooms | 3 (0.6%) | 40 (23.1%) |
| 4 or 5 Rooms | 149 (29.4%) | 105 (60.7%) |
| 6 or 7 Rooms | 198 (39.1%) | 10 (5.8%) |
| 8 or more Rooms | 157 (31.0%) | 18 (10.4%) |
| Total | 507 (100.0%) | 173 (100.0%) |
Housing Structure by Heating Type in Random Lake
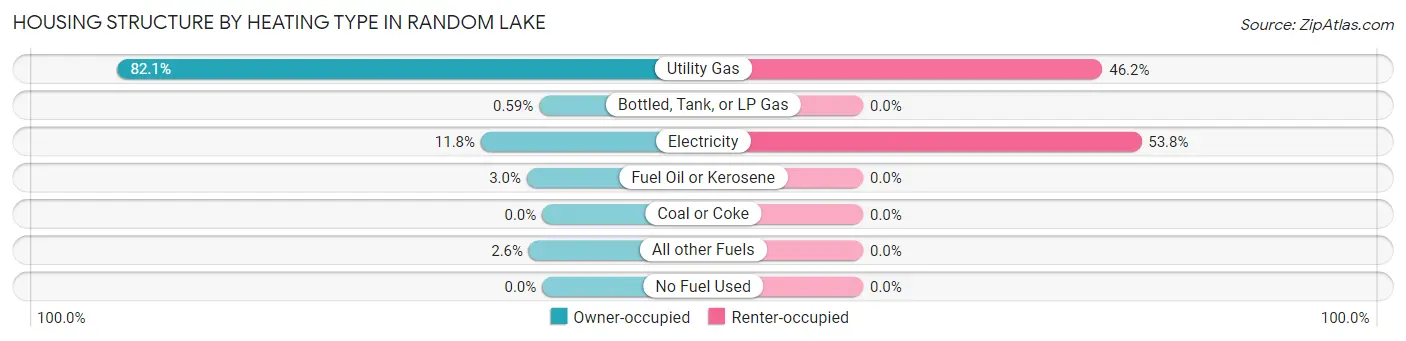
| Heating Type | Owner-occupied | Renter-occupied |
| Utility Gas | 416 (82.1%) | 80 (46.2%) |
| Bottled, Tank, or LP Gas | 3 (0.6%) | 0 (0.0%) |
| Electricity | 60 (11.8%) | 93 (53.8%) |
| Fuel Oil or Kerosene | 15 (3.0%) | 0 (0.0%) |
| Coal or Coke | 0 (0.0%) | 0 (0.0%) |
| All other Fuels | 13 (2.6%) | 0 (0.0%) |
| No Fuel Used | 0 (0.0%) | 0 (0.0%) |
| Total | 507 (100.0%) | 173 (100.0%) |
Household Vehicle Usage in Random Lake
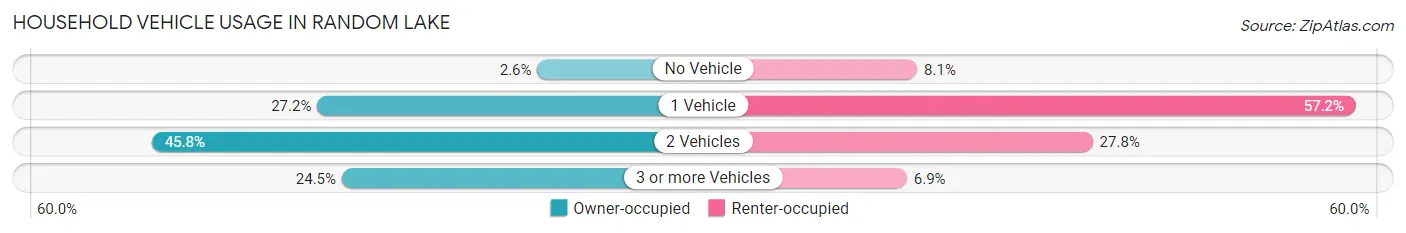
| Vehicles per Household | Owner-occupied | Renter-occupied |
| No Vehicle | 13 (2.6%) | 14 (8.1%) |
| 1 Vehicle | 138 (27.2%) | 99 (57.2%) |
| 2 Vehicles | 232 (45.8%) | 48 (27.8%) |
| 3 or more Vehicles | 124 (24.5%) | 12 (6.9%) |
| Total | 507 (100.0%) | 173 (100.0%) |
Real Estate & Mortgages in Random Lake
Real Estate and Mortgage Overview in Random Lake
| Characteristic | Without Mortgage | With Mortgage |
| Housing Units | 194 | 313 |
| Median Property Value | $303,900 | $201,200 |
| Median Household Income | $81,643 | $39 |
| Monthly Housing Costs | $625 | $0 |
| Real Estate Taxes | $4,542 | $0 |
Property Value by Mortgage Status in Random Lake
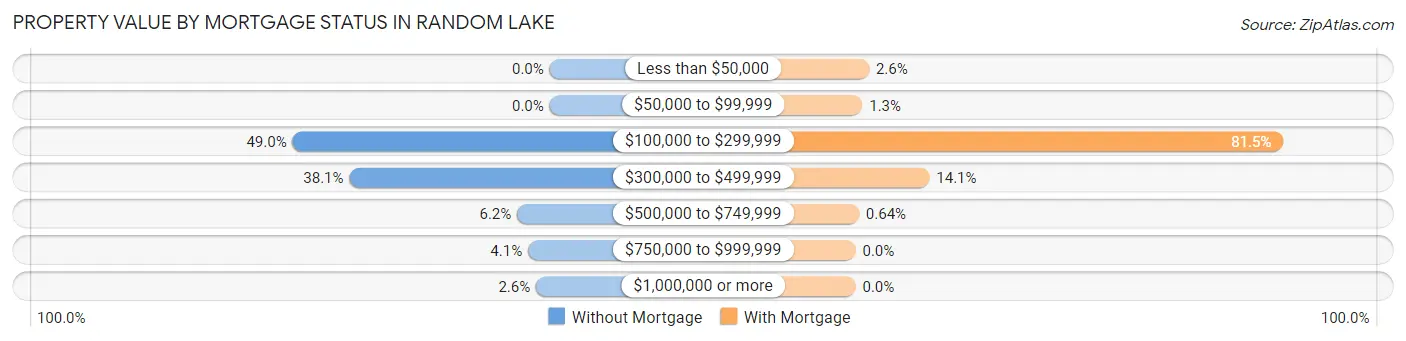
| Property Value | Without Mortgage | With Mortgage |
| Less than $50,000 | 0 (0.0%) | 8 (2.6%) |
| $50,000 to $99,999 | 0 (0.0%) | 4 (1.3%) |
| $100,000 to $299,999 | 95 (49.0%) | 255 (81.5%) |
| $300,000 to $499,999 | 74 (38.1%) | 44 (14.1%) |
| $500,000 to $749,999 | 12 (6.2%) | 2 (0.6%) |
| $750,000 to $999,999 | 8 (4.1%) | 0 (0.0%) |
| $1,000,000 or more | 5 (2.6%) | 0 (0.0%) |
| Total | 194 (100.0%) | 313 (100.0%) |
Household Income by Mortgage Status in Random Lake
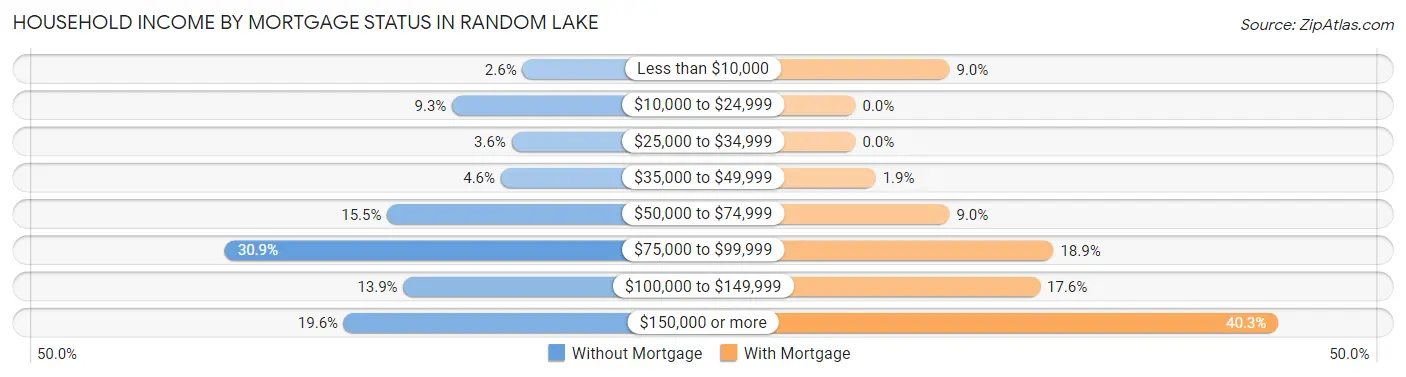
| Household Income | Without Mortgage | With Mortgage |
| Less than $10,000 | 5 (2.6%) | 28 (8.9%) |
| $10,000 to $24,999 | 18 (9.3%) | 0 (0.0%) |
| $25,000 to $34,999 | 7 (3.6%) | 0 (0.0%) |
| $35,000 to $49,999 | 9 (4.6%) | 6 (1.9%) |
| $50,000 to $74,999 | 30 (15.5%) | 28 (8.9%) |
| $75,000 to $99,999 | 60 (30.9%) | 59 (18.9%) |
| $100,000 to $149,999 | 27 (13.9%) | 55 (17.6%) |
| $150,000 or more | 38 (19.6%) | 126 (40.3%) |
| Total | 194 (100.0%) | 313 (100.0%) |
Property Value to Household Income Ratio in Random Lake
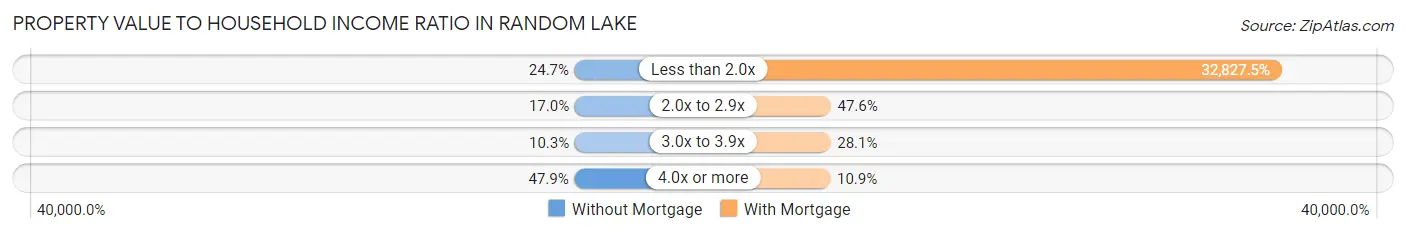
| Value-to-Income Ratio | Without Mortgage | With Mortgage |
| Less than 2.0x | 48 (24.7%) | 102,750 (32,827.5%) |
| 2.0x to 2.9x | 33 (17.0%) | 149 (47.6%) |
| 3.0x to 3.9x | 20 (10.3%) | 88 (28.1%) |
| 4.0x or more | 93 (47.9%) | 34 (10.9%) |
| Total | 194 (100.0%) | 313 (100.0%) |
Real Estate Taxes by Mortgage Status in Random Lake
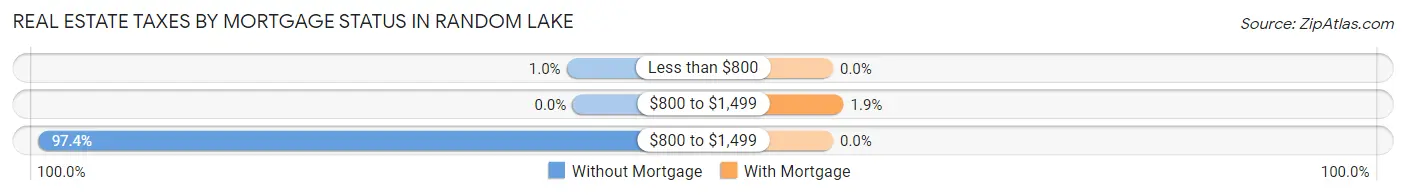
| Property Taxes | Without Mortgage | With Mortgage |
| Less than $800 | 2 (1.0%) | 0 (0.0%) |
| $800 to $1,499 | 0 (0.0%) | 6 (1.9%) |
| $800 to $1,499 | 189 (97.4%) | 0 (0.0%) |
| Total | 194 (100.0%) | 313 (100.0%) |
Health & Disability in Random Lake
Health Insurance Coverage by Age in Random Lake
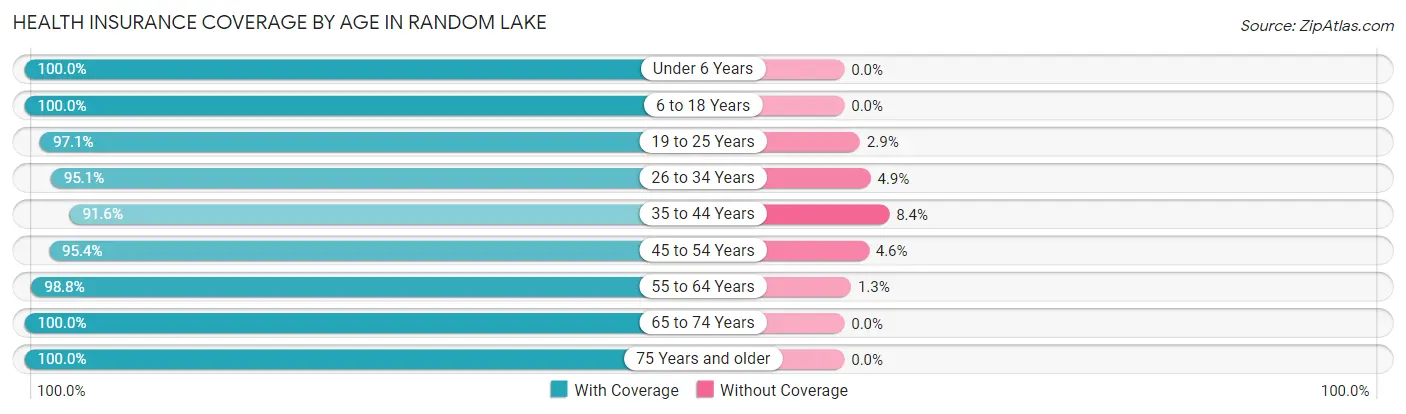
| Age Bracket | With Coverage | Without Coverage |
| Under 6 Years | 61 (100.0%) | 0 (0.0%) |
| 6 to 18 Years | 277 (100.0%) | 0 (0.0%) |
| 19 to 25 Years | 100 (97.1%) | 3 (2.9%) |
| 26 to 34 Years | 175 (95.1%) | 9 (4.9%) |
| 35 to 44 Years | 153 (91.6%) | 14 (8.4%) |
| 45 to 54 Years | 209 (95.4%) | 10 (4.6%) |
| 55 to 64 Years | 237 (98.8%) | 3 (1.3%) |
| 65 to 74 Years | 207 (100.0%) | 0 (0.0%) |
| 75 Years and older | 122 (100.0%) | 0 (0.0%) |
| Total | 1,541 (97.5%) | 39 (2.5%) |
Health Insurance Coverage by Citizenship Status in Random Lake
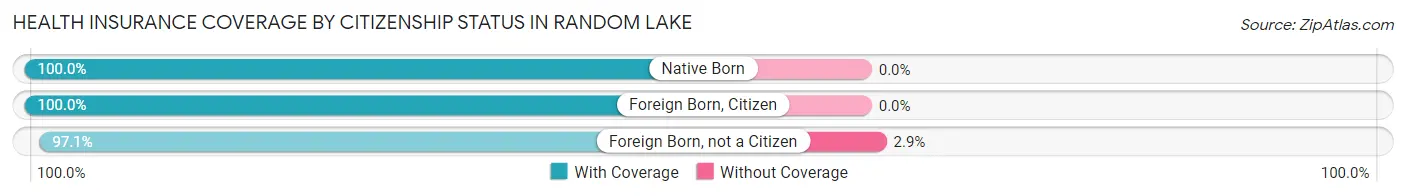
| Citizenship Status | With Coverage | Without Coverage |
| Native Born | 61 (100.0%) | 0 (0.0%) |
| Foreign Born, Citizen | 277 (100.0%) | 0 (0.0%) |
| Foreign Born, not a Citizen | 100 (97.1%) | 3 (2.9%) |
Health Insurance Coverage by Household Income in Random Lake
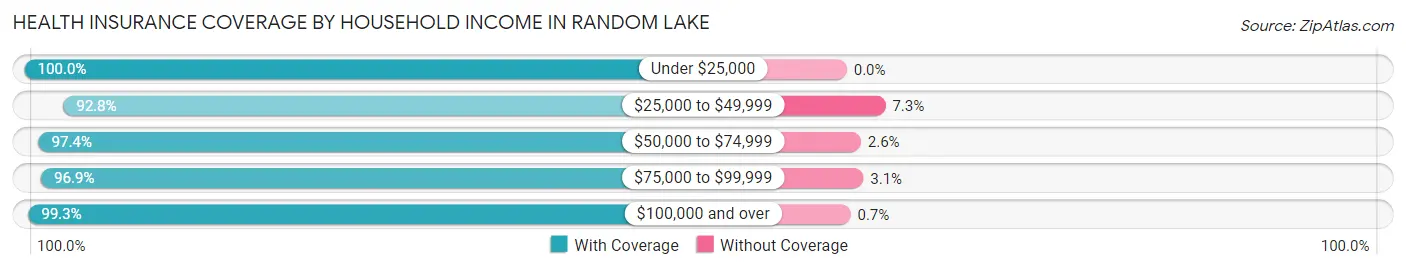
| Household Income | With Coverage | Without Coverage |
| Under $25,000 | 68 (100.0%) | 0 (0.0%) |
| $25,000 to $49,999 | 243 (92.7%) | 19 (7.2%) |
| $50,000 to $74,999 | 222 (97.4%) | 6 (2.6%) |
| $75,000 to $99,999 | 281 (96.9%) | 9 (3.1%) |
| $100,000 and over | 714 (99.3%) | 5 (0.7%) |
Public vs Private Health Insurance Coverage by Age in Random Lake
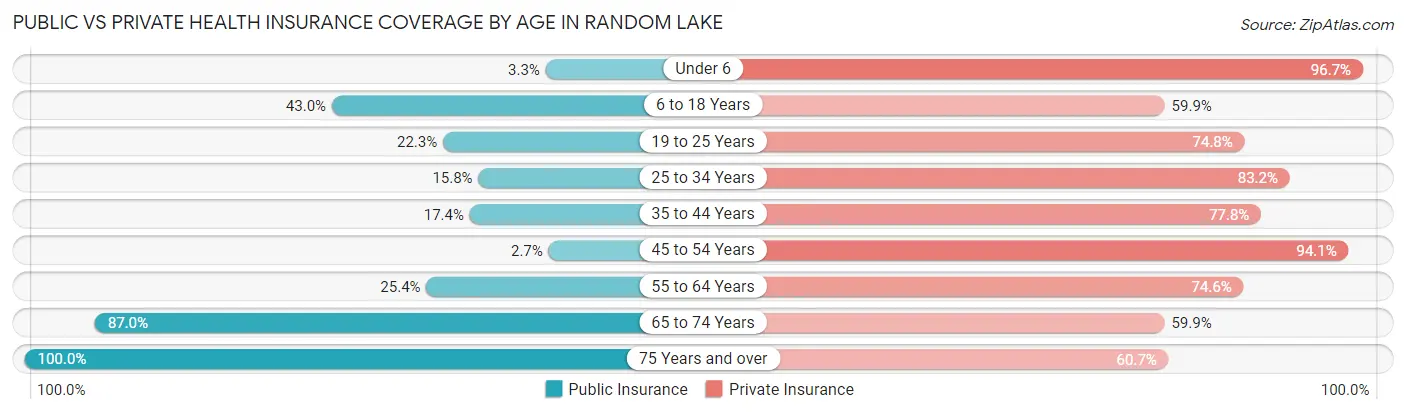
| Age Bracket | Public Insurance | Private Insurance |
| Under 6 | 2 (3.3%) | 59 (96.7%) |
| 6 to 18 Years | 119 (43.0%) | 166 (59.9%) |
| 19 to 25 Years | 23 (22.3%) | 77 (74.8%) |
| 25 to 34 Years | 29 (15.8%) | 153 (83.2%) |
| 35 to 44 Years | 29 (17.4%) | 130 (77.8%) |
| 45 to 54 Years | 6 (2.7%) | 206 (94.1%) |
| 55 to 64 Years | 61 (25.4%) | 179 (74.6%) |
| 65 to 74 Years | 180 (87.0%) | 124 (59.9%) |
| 75 Years and over | 122 (100.0%) | 74 (60.7%) |
| Total | 571 (36.1%) | 1,168 (73.9%) |
Disability Status by Sex by Age in Random Lake
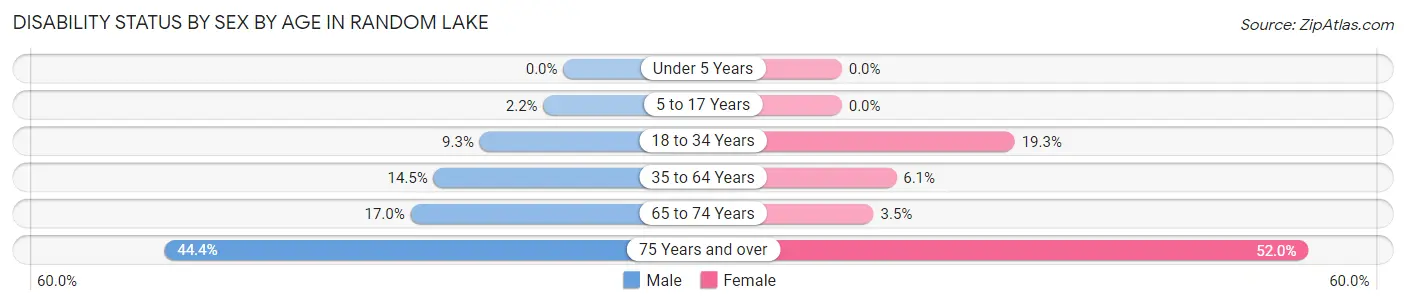
| Age Bracket | Male | Female |
| Under 5 Years | 0 (0.0%) | 0 (0.0%) |
| 5 to 17 Years | 3 (2.2%) | 0 (0.0%) |
| 18 to 34 Years | 19 (9.3%) | 26 (19.3%) |
| 35 to 64 Years | 50 (14.4%) | 17 (6.1%) |
| 65 to 74 Years | 16 (17.0%) | 4 (3.5%) |
| 75 Years and over | 20 (44.4%) | 40 (51.9%) |
Disability Class by Sex by Age in Random Lake
Disability Class: Hearing Difficulty
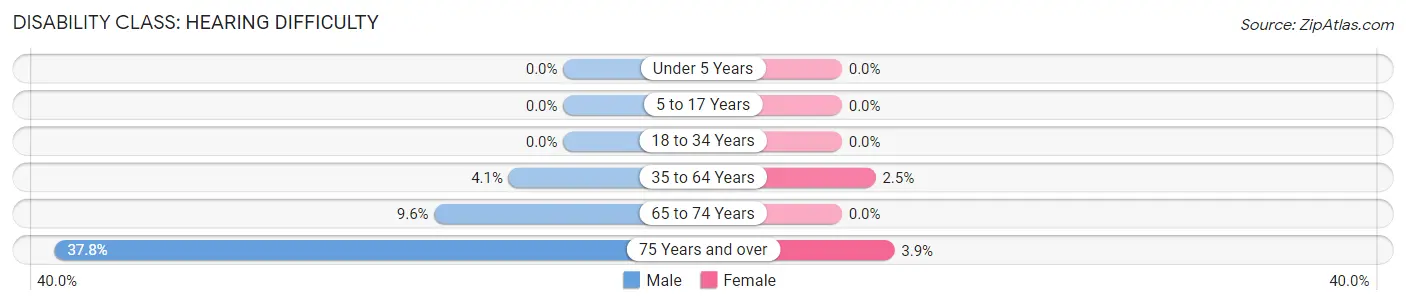
| Age Bracket | Male | Female |
| Under 5 Years | 0 (0.0%) | 0 (0.0%) |
| 5 to 17 Years | 0 (0.0%) | 0 (0.0%) |
| 18 to 34 Years | 0 (0.0%) | 0 (0.0%) |
| 35 to 64 Years | 14 (4.1%) | 7 (2.5%) |
| 65 to 74 Years | 9 (9.6%) | 0 (0.0%) |
| 75 Years and over | 17 (37.8%) | 3 (3.9%) |
Disability Class: Vision Difficulty
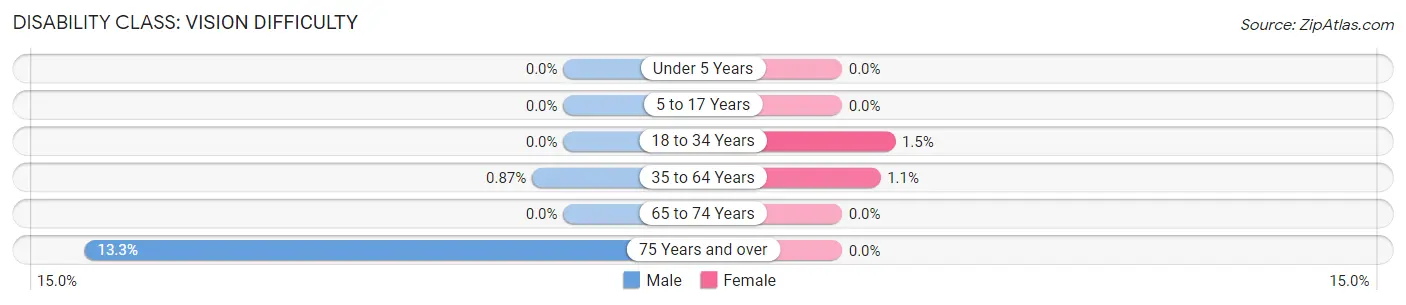
| Age Bracket | Male | Female |
| Under 5 Years | 0 (0.0%) | 0 (0.0%) |
| 5 to 17 Years | 0 (0.0%) | 0 (0.0%) |
| 18 to 34 Years | 0 (0.0%) | 2 (1.5%) |
| 35 to 64 Years | 3 (0.9%) | 3 (1.1%) |
| 65 to 74 Years | 0 (0.0%) | 0 (0.0%) |
| 75 Years and over | 6 (13.3%) | 0 (0.0%) |
Disability Class: Cognitive Difficulty
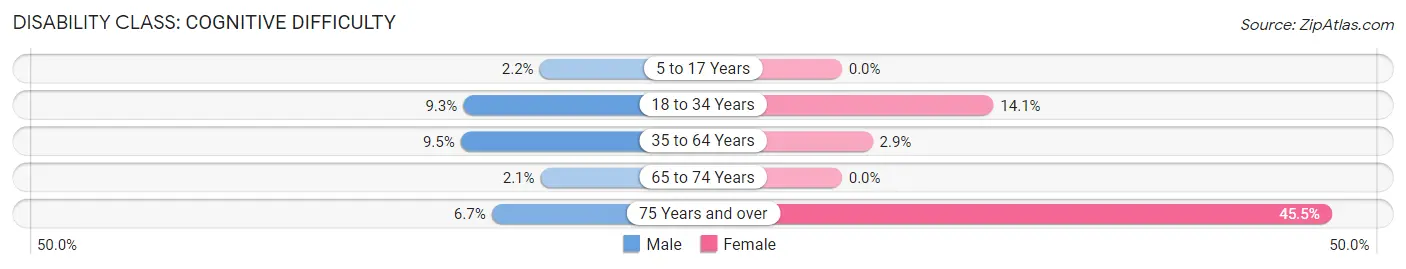
| Age Bracket | Male | Female |
| 5 to 17 Years | 3 (2.2%) | 0 (0.0%) |
| 18 to 34 Years | 19 (9.3%) | 19 (14.1%) |
| 35 to 64 Years | 33 (9.5%) | 8 (2.9%) |
| 65 to 74 Years | 2 (2.1%) | 0 (0.0%) |
| 75 Years and over | 3 (6.7%) | 35 (45.5%) |
Disability Class: Ambulatory Difficulty
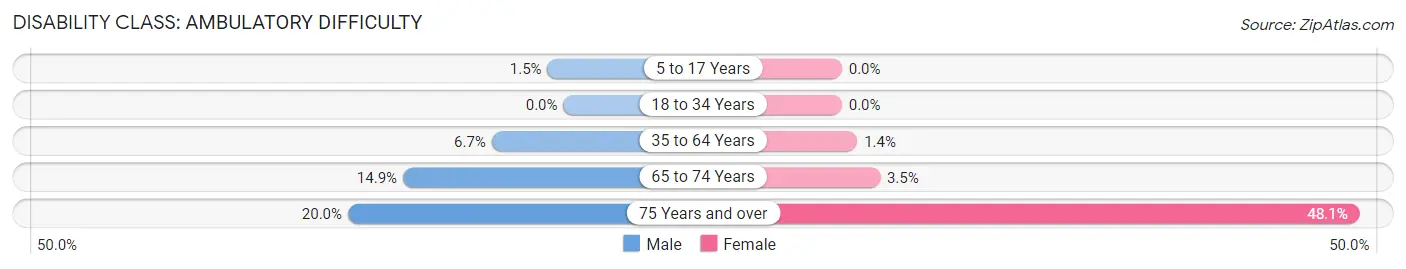
| Age Bracket | Male | Female |
| 5 to 17 Years | 2 (1.5%) | 0 (0.0%) |
| 18 to 34 Years | 0 (0.0%) | 0 (0.0%) |
| 35 to 64 Years | 23 (6.7%) | 4 (1.4%) |
| 65 to 74 Years | 14 (14.9%) | 4 (3.5%) |
| 75 Years and over | 9 (20.0%) | 37 (48.0%) |
Disability Class: Self-Care Difficulty
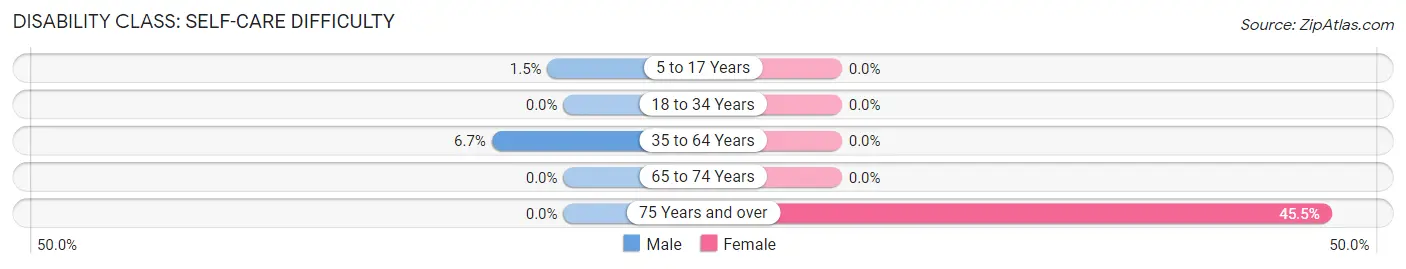
| Age Bracket | Male | Female |
| 5 to 17 Years | 2 (1.5%) | 0 (0.0%) |
| 18 to 34 Years | 0 (0.0%) | 0 (0.0%) |
| 35 to 64 Years | 23 (6.7%) | 0 (0.0%) |
| 65 to 74 Years | 0 (0.0%) | 0 (0.0%) |
| 75 Years and over | 0 (0.0%) | 35 (45.5%) |
Technology Access in Random Lake
Computing Device Access in Random Lake
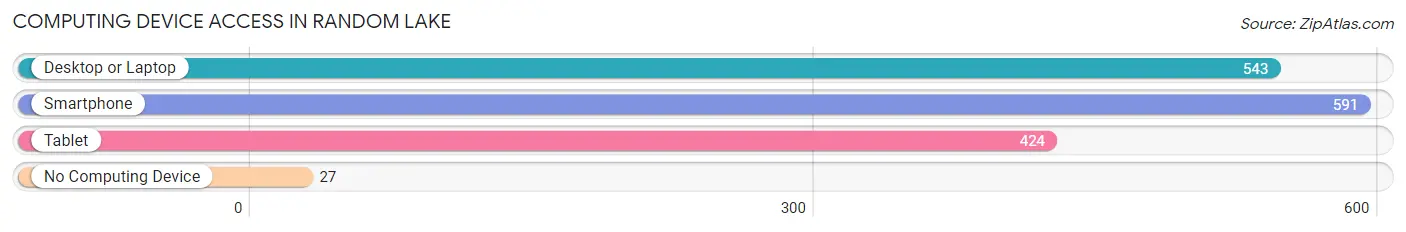
| Device Type | # Households | % Households |
| Desktop or Laptop | 543 | 79.8% |
| Smartphone | 591 | 86.9% |
| Tablet | 424 | 62.4% |
| No Computing Device | 27 | 4.0% |
| Total | 680 | 100.0% |
Internet Access in Random Lake
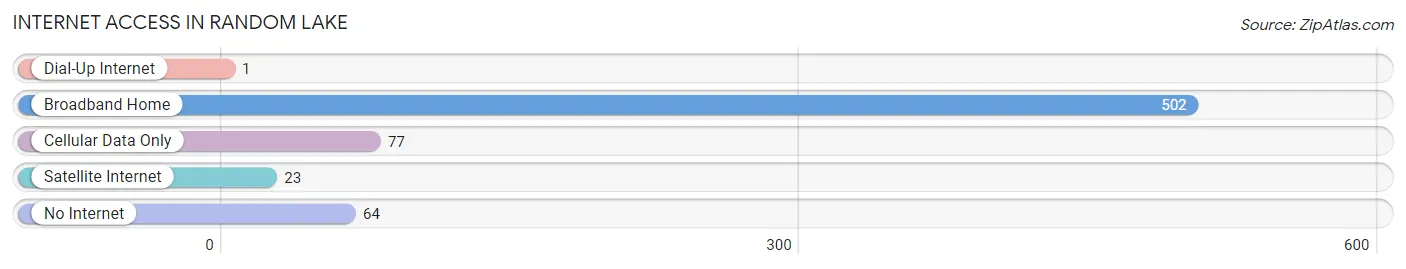
| Internet Type | # Households | % Households |
| Dial-Up Internet | 1 | 0.2% |
| Broadband Home | 502 | 73.8% |
| Cellular Data Only | 77 | 11.3% |
| Satellite Internet | 23 | 3.4% |
| No Internet | 64 | 9.4% |
| Total | 680 | 100.0% |
Random Lake Summary
History
The area now known as Random Lake, Wisconsin was first inhabited by the Potawatomi Native American tribe. The Potawatomi were a peaceful tribe that lived in the area for centuries before the arrival of European settlers. The first European settlers arrived in the area in the early 1800s and began to establish farms and homesteads. The first permanent settlement in the area was established in 1845 by a man named John Random. He named the settlement after himself and it quickly grew into a small village.
The village of Random Lake was officially incorporated in 1891 and the population quickly grew to over 500 people. The village was primarily an agricultural community, with most of the residents working on farms or in the local lumber industry. The village also had a few small businesses, including a general store, a blacksmith shop, and a sawmill.
In the early 1900s, the village began to expand and the population grew to over 1,000 people. The village was connected to the rest of the state by a railroad line and the local economy began to diversify. The village also had a few small factories, including a cheese factory and a canning factory.
The village continued to grow throughout the 20th century and by the year 2000, the population had grown to over 2,000 people. The village is now a thriving community with a variety of businesses, including a grocery store, a hardware store, and several restaurants.
Geography
Random Lake is located in Sheboygan County, Wisconsin, about 30 miles north of Milwaukee. The village is situated on the western shore of Random Lake, a small lake that is part of the Sheboygan River watershed. The village is surrounded by rolling hills and is located in a rural area.
The village covers an area of 1.3 square miles and has a population of 2,072 people, as of the 2010 census. The village is located at an elevation of 845 feet above sea level.
Economy
The economy of Random Lake is primarily based on agriculture and tourism. The village is home to several small farms that produce a variety of crops, including corn, soybeans, and hay. The village also has a few small businesses, including a grocery store, a hardware store, and several restaurants.
The village is also a popular tourist destination, as it is located near several popular attractions, including the Sheboygan County Historical Museum, the Sheboygan County Fairgrounds, and the Random Lake State Park. The village also hosts several annual events, including the Random Lake Festival and the Random Lake Car Show.
Demographics
As of the 2010 census, the population of Random Lake was 2,072 people. The racial makeup of the village was 97.3% White, 0.4% African American, 0.2% Native American, 0.6% Asian, 0.1% Pacific Islander, 0.4% from other races, and 1.0% from two or more races. Hispanic or Latino of any race were 1.7% of the population.
The median household income in Random Lake was $50,972, and the median family income was $60,972. The per capita income for the village was $25,972. About 4.3% of families and 5.7% of the population were below the poverty line, including 6.3% of those under age 18 and 4.2% of those age 65 or over.
Common Questions
What is Per Capita Income in Random Lake?
Per Capita income in Random Lake is $42,312.
What is the Median Family Income in Random Lake?
Median Family Income in Random Lake is $96,875.
What is the Median Household income in Random Lake?
Median Household Income in Random Lake is $82,010.
What is Income or Wage Gap in Random Lake?
Income or Wage Gap in Random Lake is 23.1%.
Women in Random Lake earn 76.9 cents for every dollar earned by a man.
What is Inequality or Gini Index in Random Lake?
Inequality or Gini Index in Random Lake is 0.38.
What is the Total Population of Random Lake?
Total Population of Random Lake is 1,580.
What is the Total Male Population of Random Lake?
Total Male Population of Random Lake is 849.
What is the Total Female Population of Random Lake?
Total Female Population of Random Lake is 731.
What is the Ratio of Males per 100 Females in Random Lake?
There are 116.14 Males per 100 Females in Random Lake.
What is the Ratio of Females per 100 Males in Random Lake?
There are 86.10 Females per 100 Males in Random Lake.
What is the Median Population Age in Random Lake?
Median Population Age in Random Lake is 44.9 Years.
What is the Average Family Size in Random Lake
Average Family Size in Random Lake is 2.8 People.
What is the Average Household Size in Random Lake
Average Household Size in Random Lake is 2.3 People.
How Large is the Labor Force in Random Lake?
There are 839 People in the Labor Forcein in Random Lake.
What is the Percentage of People in the Labor Force in Random Lake?
62.4% of People are in the Labor Force in Random Lake.
What is the Unemployment Rate in Random Lake?
Unemployment Rate in Random Lake is 6.2%.