Hurley, WI Map & Demographics
Hurley Map
Hurley Overview
$28,474
PER CAPITA INCOME
$59,844
AVG FAMILY INCOME
$38,580
AVG HOUSEHOLD INCOME
11.5%
WAGE / INCOME GAP [ % ]
88.5¢/ $1
WAGE / INCOME GAP [ $ ]
0.45
INEQUALITY / GINI INDEX
1,405
TOTAL POPULATION
705
MALE POPULATION
700
FEMALE POPULATION
100.71
MALES / 100 FEMALES
99.29
FEMALES / 100 MALES
54.5
MEDIAN AGE
2.7
AVG FAMILY SIZE
1.9
AVG HOUSEHOLD SIZE
634
LABOR FORCE [ PEOPLE ]
51.7%
PERCENT IN LABOR FORCE
6.2%
UNEMPLOYMENT RATE
Hurley Zip Codes
Hurley Area Codes
Income in Hurley
Income Overview in Hurley
Per Capita Income in Hurley is $28,474, while median incomes of families and households are $59,844 and $38,580 respectively.
| Characteristic | Number | Measure |
| Per Capita Income | 1,405 | $28,474 |
| Median Family Income | 317 | $59,844 |
| Mean Family Income | 317 | $73,520 |
| Median Household Income | 688 | $38,580 |
| Mean Household Income | 688 | $53,701 |
| Income Deficit | 317 | $0 |
| Wage / Income Gap (%) | 1,405 | 11.53% |
| Wage / Income Gap ($) | 1,405 | 88.47¢ per $1 |
| Gini / Inequality Index | 1,405 | 0.45 |
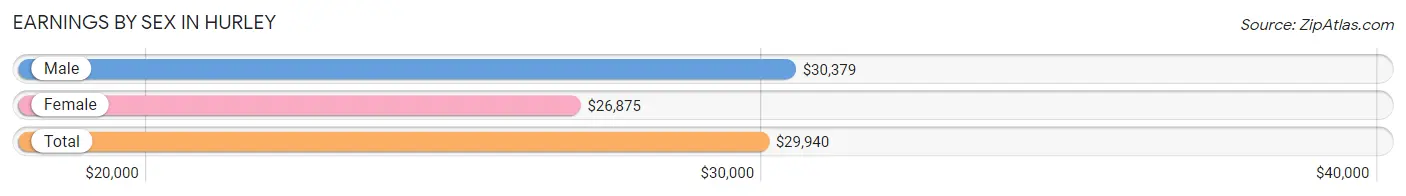
Earnings by Sex in Hurley
Average Earnings in Hurley are $29,940, $30,379 for men and $26,875 for women, a difference of 11.5%.
| Sex | Number | Average Earnings |
| Male | 376 (56.5%) | $30,379 |
| Female | 290 (43.5%) | $26,875 |
| Total | 666 (100.0%) | $29,940 |
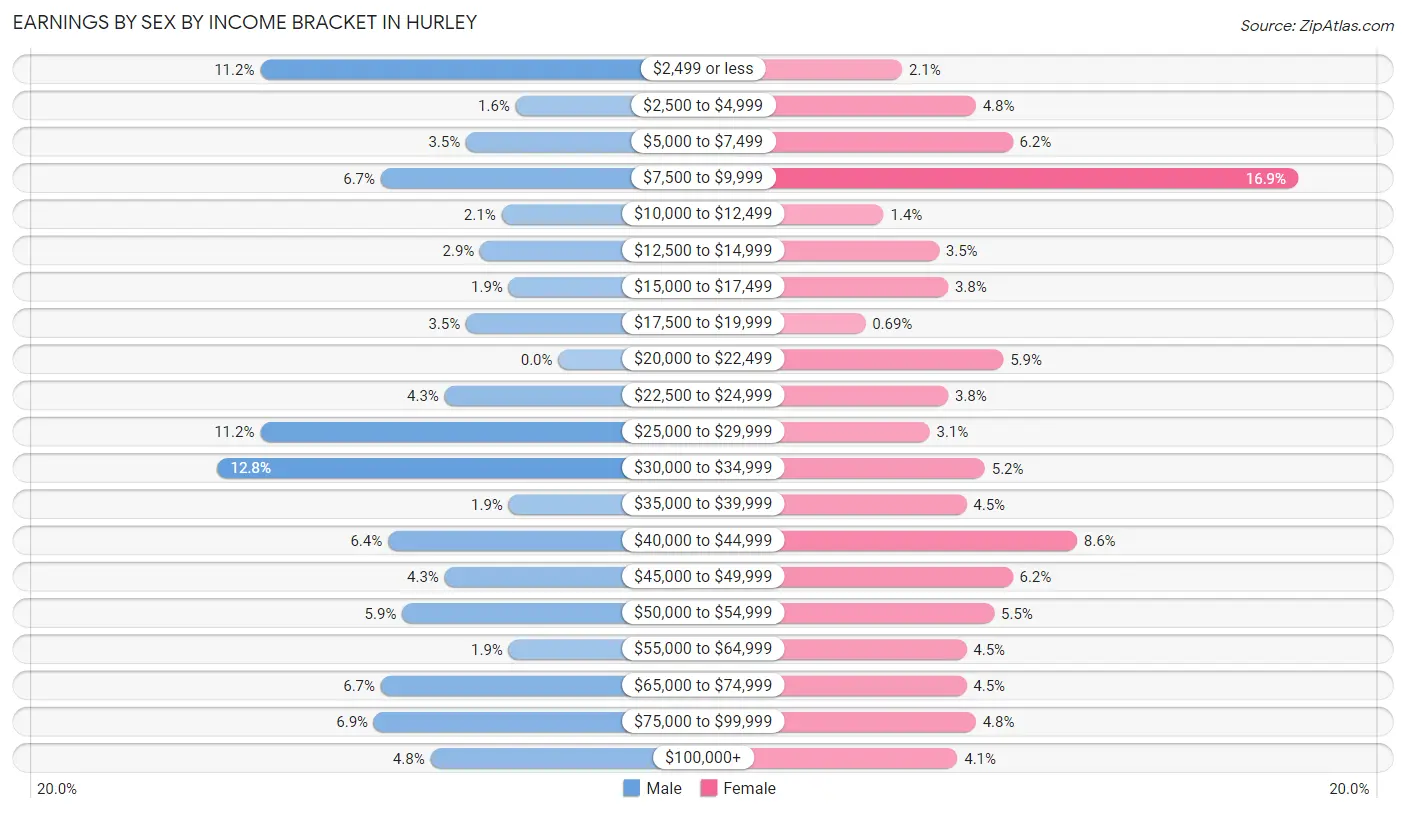
Earnings by Sex by Income Bracket in Hurley
The most common earnings brackets in Hurley are $30,000 to $34,999 for men (48 | 12.8%) and $7,500 to $9,999 for women (49 | 16.9%).
| Income | Male | Female |
| $2,499 or less | 42 (11.2%) | 6 (2.1%) |
| $2,500 to $4,999 | 6 (1.6%) | 14 (4.8%) |
| $5,000 to $7,499 | 13 (3.5%) | 18 (6.2%) |
| $7,500 to $9,999 | 25 (6.7%) | 49 (16.9%) |
| $10,000 to $12,499 | 8 (2.1%) | 4 (1.4%) |
| $12,500 to $14,999 | 11 (2.9%) | 10 (3.5%) |
| $15,000 to $17,499 | 7 (1.9%) | 11 (3.8%) |
| $17,500 to $19,999 | 13 (3.5%) | 2 (0.7%) |
| $20,000 to $22,499 | 0 (0.0%) | 17 (5.9%) |
| $22,500 to $24,999 | 16 (4.3%) | 11 (3.8%) |
| $25,000 to $29,999 | 42 (11.2%) | 9 (3.1%) |
| $30,000 to $34,999 | 48 (12.8%) | 15 (5.2%) |
| $35,000 to $39,999 | 7 (1.9%) | 13 (4.5%) |
| $40,000 to $44,999 | 24 (6.4%) | 25 (8.6%) |
| $45,000 to $49,999 | 16 (4.3%) | 18 (6.2%) |
| $50,000 to $54,999 | 22 (5.9%) | 16 (5.5%) |
| $55,000 to $64,999 | 7 (1.9%) | 13 (4.5%) |
| $65,000 to $74,999 | 25 (6.7%) | 13 (4.5%) |
| $75,000 to $99,999 | 26 (6.9%) | 14 (4.8%) |
| $100,000+ | 18 (4.8%) | 12 (4.1%) |
| Total | 376 (100.0%) | 290 (100.0%) |
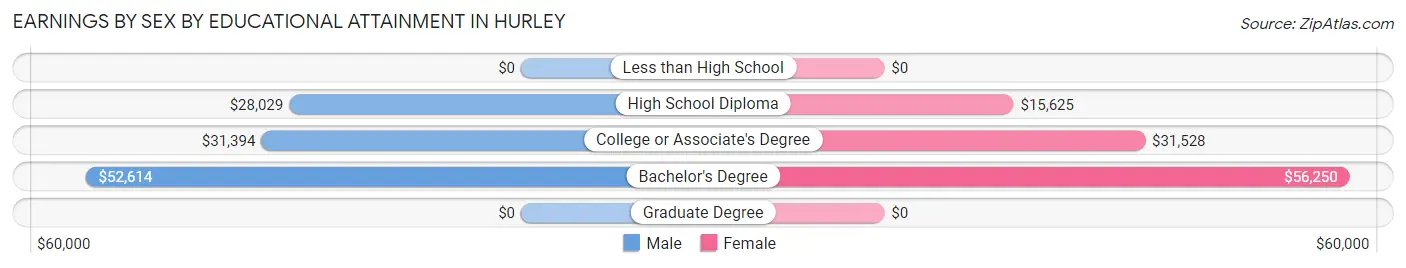
Earnings by Sex by Educational Attainment in Hurley
Average earnings in Hurley are $31,202 for men and $27,188 for women, a difference of 12.9%. Men with an educational attainment of bachelor's degree enjoy the highest average annual earnings of $52,614, while those with high school diploma education earn the least with $28,029. Women with an educational attainment of bachelor's degree earn the most with the average annual earnings of $56,250, while those with high school diploma education have the smallest earnings of $15,625.
| Educational Attainment | Male Income | Female Income |
| Less than High School | - | - |
| High School Diploma | $28,029 | $15,625 |
| College or Associate's Degree | $31,394 | $31,528 |
| Bachelor's Degree | $52,614 | $56,250 |
| Graduate Degree | - | - |
| Total | $31,202 | $27,188 |
Family Income in Hurley
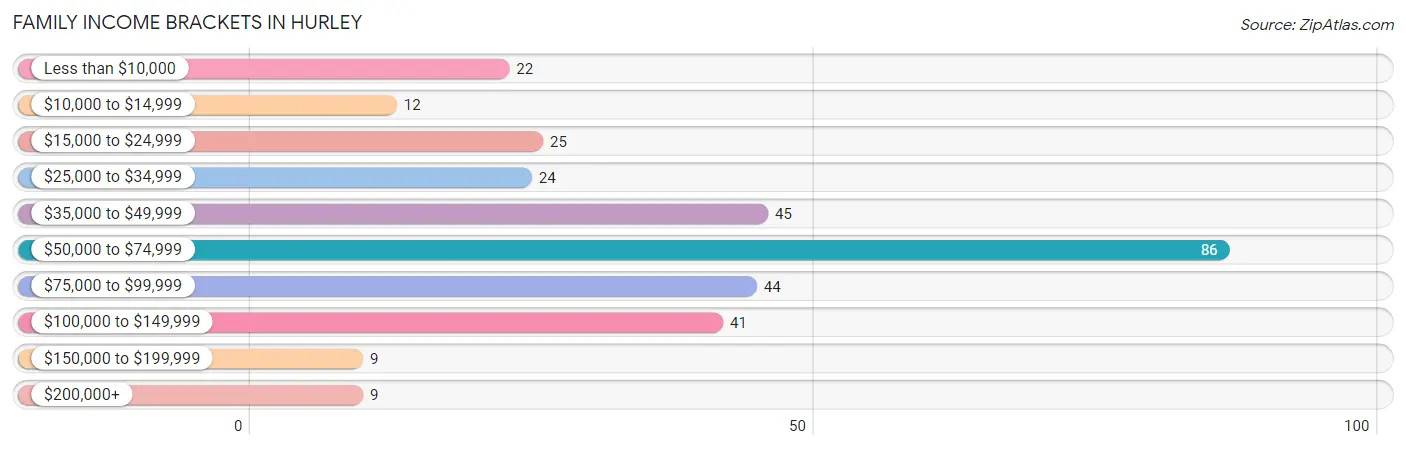
Family Income Brackets in Hurley
According to the Hurley family income data, there are 86 families falling into the $50,000 to $74,999 income range, which is the most common income bracket and makes up 27.1% of all families. Conversely, the $150,000 to $199,999 income bracket is the least frequent group with only 9 families (2.8%) belonging to this category.
| Income Bracket | # Families | % Families |
| Less than $10,000 | 22 | 6.9% |
| $10,000 to $14,999 | 12 | 3.8% |
| $15,000 to $24,999 | 25 | 7.9% |
| $25,000 to $34,999 | 24 | 7.6% |
| $35,000 to $49,999 | 45 | 14.2% |
| $50,000 to $74,999 | 86 | 27.1% |
| $75,000 to $99,999 | 44 | 13.9% |
| $100,000 to $149,999 | 41 | 12.9% |
| $150,000 to $199,999 | 9 | 2.8% |
| $200,000+ | 9 | 2.8% |
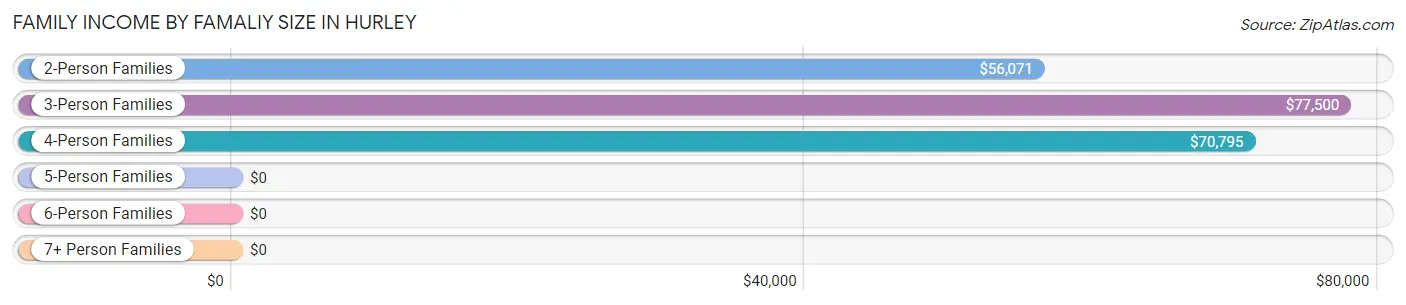
Family Income by Famaliy Size in Hurley
3-person families (50 | 15.8%) account for the highest median family income in Hurley with $77,500 per family, while 2-person families (210 | 66.2%) have the highest median income of $28,036 per family member.
| Income Bracket | # Families | Median Income |
| 2-Person Families | 210 (66.2%) | $56,071 |
| 3-Person Families | 50 (15.8%) | $77,500 |
| 4-Person Families | 40 (12.6%) | $70,795 |
| 5-Person Families | 10 (3.2%) | $0 |
| 6-Person Families | 7 (2.2%) | $0 |
| 7+ Person Families | 0 (0.0%) | $0 |
| Total | 317 (100.0%) | $59,844 |
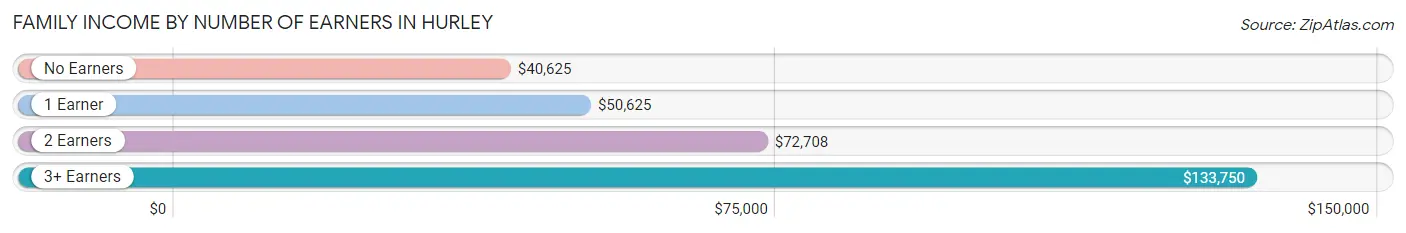
Family Income by Number of Earners in Hurley
The median family income in Hurley is $59,844, with families comprising 3+ earners (14) having the highest median family income of $133,750, while families with no earners (122) have the lowest median family income of $40,625, accounting for 4.4% and 38.5% of families, respectively.
| Number of Earners | # Families | Median Income |
| No Earners | 122 (38.5%) | $40,625 |
| 1 Earner | 58 (18.3%) | $50,625 |
| 2 Earners | 123 (38.8%) | $72,708 |
| 3+ Earners | 14 (4.4%) | $133,750 |
| Total | 317 (100.0%) | $59,844 |
Household Income in Hurley
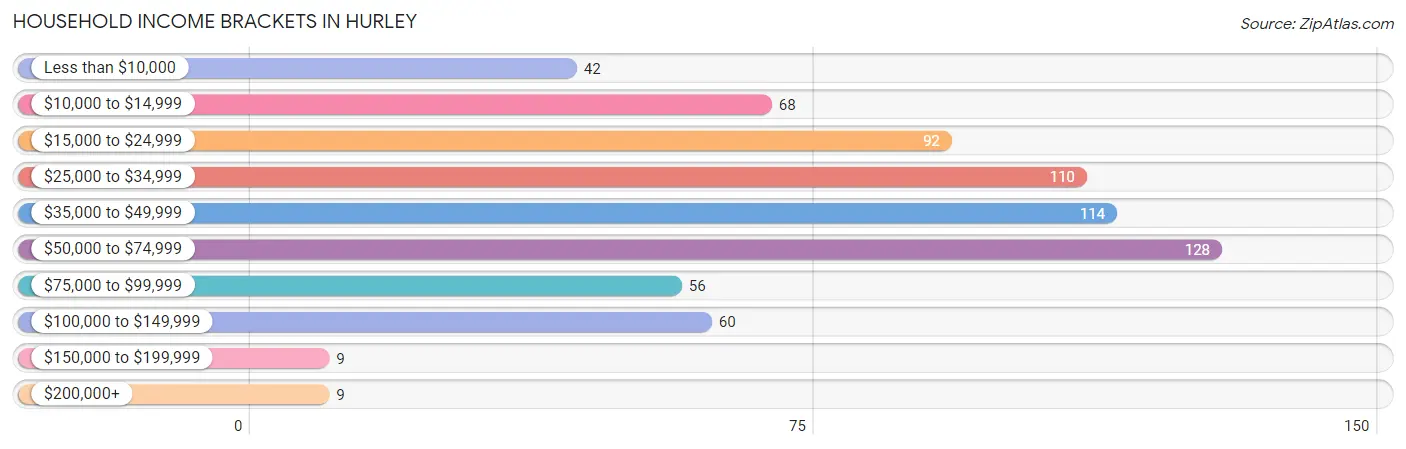
Household Income Brackets in Hurley
With 128 households falling in the category, the $50,000 to $74,999 income range is the most frequent in Hurley, accounting for 18.6% of all households. In contrast, only 9 households (1.3%) fall into the $150,000 to $199,999 income bracket, making it the least populous group.
| Income Bracket | # Households | % Households |
| Less than $10,000 | 42 | 6.1% |
| $10,000 to $14,999 | 68 | 9.9% |
| $15,000 to $24,999 | 92 | 13.4% |
| $25,000 to $34,999 | 110 | 16.0% |
| $35,000 to $49,999 | 114 | 16.6% |
| $50,000 to $74,999 | 128 | 18.6% |
| $75,000 to $99,999 | 56 | 8.1% |
| $100,000 to $149,999 | 60 | 8.7% |
| $150,000 to $199,999 | 9 | 1.3% |
| $200,000+ | 9 | 1.3% |
Household Income by Householder Age in Hurley
The median household income in Hurley is $38,580, with the highest median household income of $126,429 found in the 15 to 24 years age bracket for the primary householder. A total of 24 households (3.5%) fall into this category. Meanwhile, the 65+ years age bracket for the primary householder has the lowest median household income of $32,500, with 256 households (37.2%) in this group.
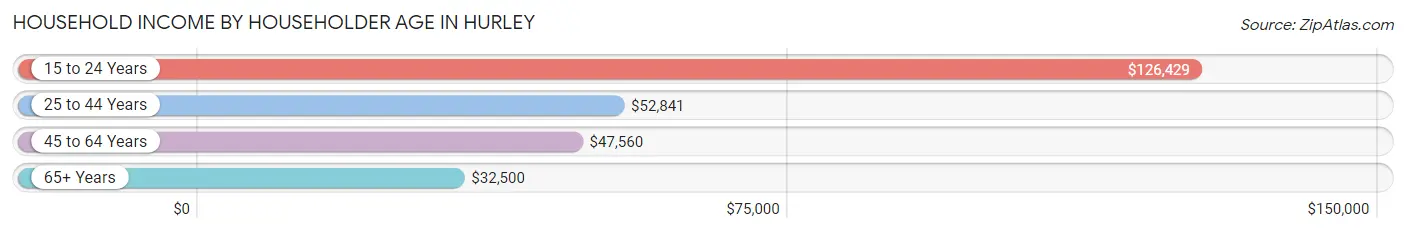
| Income Bracket | # Households | Median Income |
| 15 to 24 Years | 24 (3.5%) | $126,429 |
| 25 to 44 Years | 155 (22.5%) | $52,841 |
| 45 to 64 Years | 253 (36.8%) | $47,560 |
| 65+ Years | 256 (37.2%) | $32,500 |
| Total | 688 (100.0%) | $38,580 |
Poverty in Hurley
Income Below Poverty by Sex and Age in Hurley
With 12.1% poverty level for males and 22.4% for females among the residents of Hurley, 6 to 11 year old males and 16 and 17 year old females are the most vulnerable to poverty, with 22 males (36.1%) and 6 females (100.0%) in their respective age groups living below the poverty level.
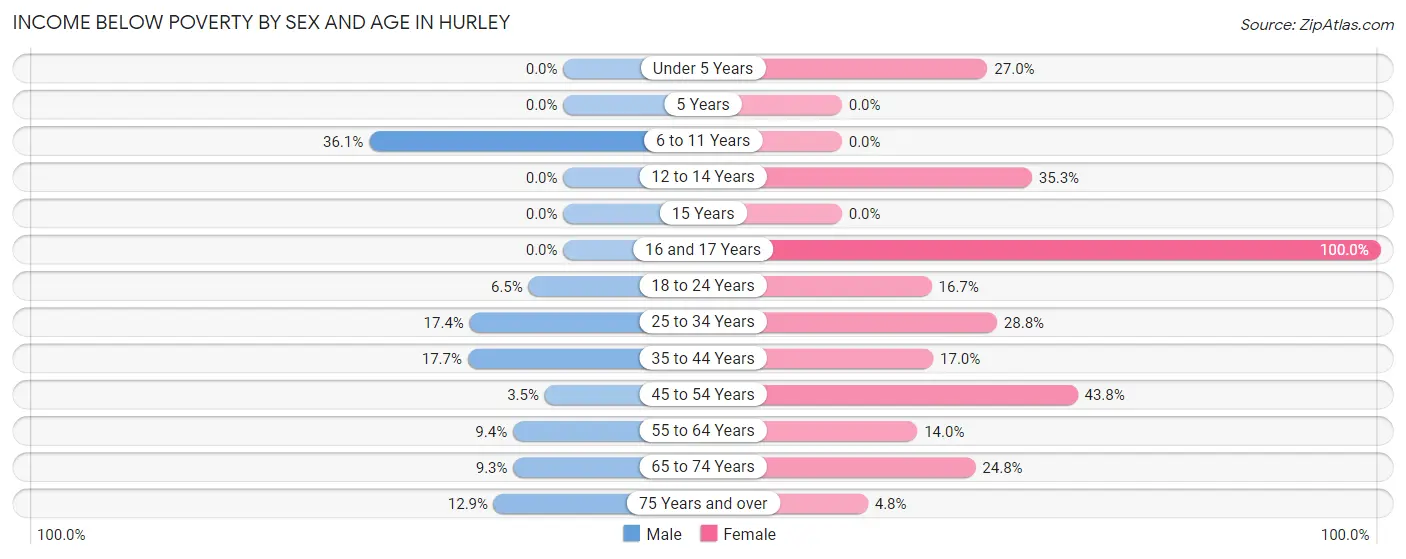
| Age Bracket | Male | Female |
| Under 5 Years | 0 (0.0%) | 10 (27.0%) |
| 5 Years | 0 (0.0%) | 0 (0.0%) |
| 6 to 11 Years | 22 (36.1%) | 0 (0.0%) |
| 12 to 14 Years | 0 (0.0%) | 6 (35.3%) |
| 15 Years | 0 (0.0%) | 0 (0.0%) |
| 16 and 17 Years | 0 (0.0%) | 6 (100.0%) |
| 18 to 24 Years | 4 (6.5%) | 7 (16.7%) |
| 25 to 34 Years | 12 (17.4%) | 19 (28.8%) |
| 35 to 44 Years | 11 (17.7%) | 10 (17.0%) |
| 45 to 54 Years | 2 (3.5%) | 35 (43.8%) |
| 55 to 64 Years | 13 (9.3%) | 14 (14.0%) |
| 65 to 74 Years | 9 (9.3%) | 31 (24.8%) |
| 75 Years and over | 8 (12.9%) | 4 (4.8%) |
| Total | 81 (12.1%) | 142 (22.4%) |
Income Above Poverty by Sex and Age in Hurley
According to the poverty statistics in Hurley, males aged under 5 years and females aged 5 years are the age groups that are most secure financially, with 100.0% of males and 100.0% of females in these age groups living above the poverty line.
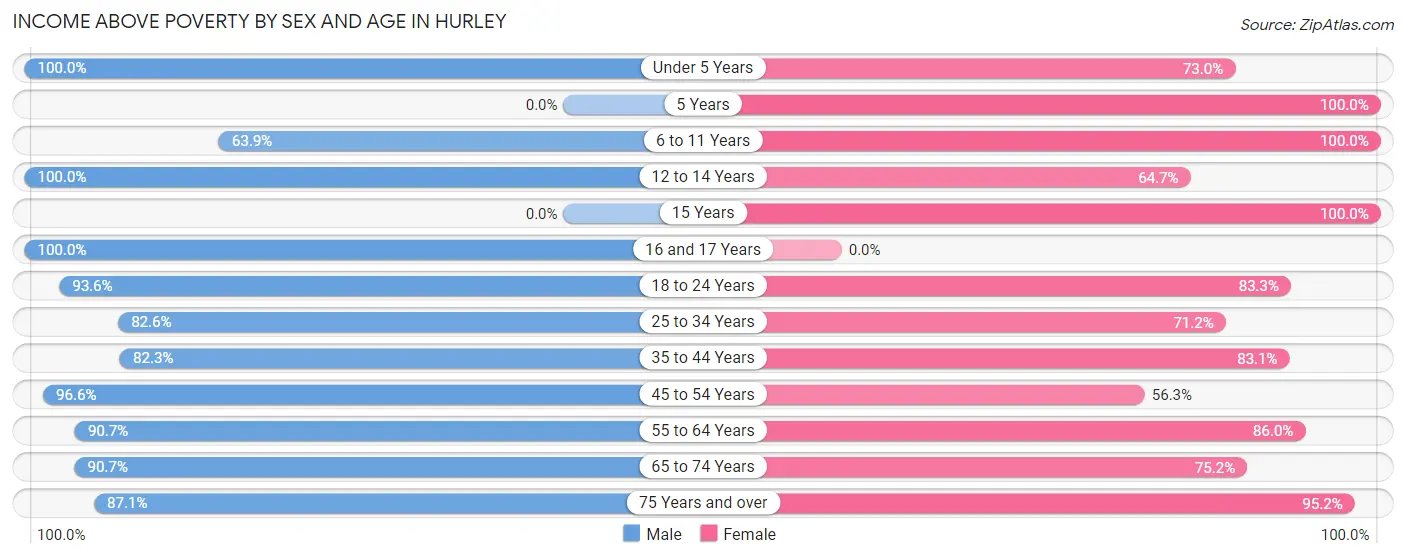
| Age Bracket | Male | Female |
| Under 5 Years | 27 (100.0%) | 27 (73.0%) |
| 5 Years | 0 (0.0%) | 9 (100.0%) |
| 6 to 11 Years | 39 (63.9%) | 4 (100.0%) |
| 12 to 14 Years | 18 (100.0%) | 11 (64.7%) |
| 15 Years | 0 (0.0%) | 6 (100.0%) |
| 16 and 17 Years | 14 (100.0%) | 0 (0.0%) |
| 18 to 24 Years | 58 (93.5%) | 35 (83.3%) |
| 25 to 34 Years | 57 (82.6%) | 47 (71.2%) |
| 35 to 44 Years | 51 (82.3%) | 49 (83.1%) |
| 45 to 54 Years | 56 (96.6%) | 45 (56.2%) |
| 55 to 64 Years | 126 (90.6%) | 86 (86.0%) |
| 65 to 74 Years | 88 (90.7%) | 94 (75.2%) |
| 75 Years and over | 54 (87.1%) | 79 (95.2%) |
| Total | 588 (87.9%) | 492 (77.6%) |
Income Below Poverty Among Married-Couple Families in Hurley
The poverty statistics for married-couple families in Hurley show that 13.8% or 33 of the total 240 families live below the poverty line. Families with 3 or 4 children have the highest poverty rate of 50.0%, comprising of 6 families. On the other hand, families with 1 or 2 children have the lowest poverty rate of 0.0%, which includes 0 families.
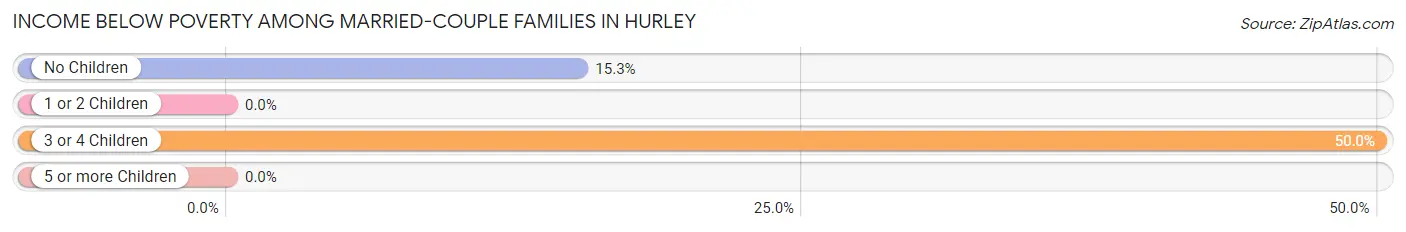
| Children | Above Poverty | Below Poverty |
| No Children | 150 (84.8%) | 27 (15.2%) |
| 1 or 2 Children | 51 (100.0%) | 0 (0.0%) |
| 3 or 4 Children | 6 (50.0%) | 6 (50.0%) |
| 5 or more Children | 0 (0.0%) | 0 (0.0%) |
| Total | 207 (86.3%) | 33 (13.8%) |
Income Below Poverty Among Single-Parent Households in Hurley
According to the poverty data in Hurley, 10.0% or 3 single-father households and 21.3% or 10 single-mother households are living below the poverty line. Among single-father households, those with no children have the highest poverty rate, with 3 households (25.0%) experiencing poverty. Likewise, among single-mother households, those with 3 or 4 children have the highest poverty rate, with 8 households (100.0%) falling below the poverty line.
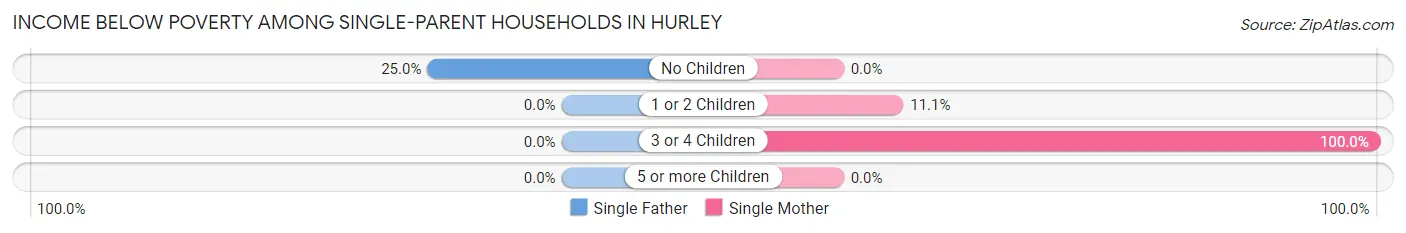
| Children | Single Father | Single Mother |
| No Children | 3 (25.0%) | 0 (0.0%) |
| 1 or 2 Children | 0 (0.0%) | 2 (11.1%) |
| 3 or 4 Children | 0 (0.0%) | 8 (100.0%) |
| 5 or more Children | 0 (0.0%) | 0 (0.0%) |
| Total | 3 (10.0%) | 10 (21.3%) |
Income Below Poverty Among Married-Couple vs Single-Parent Households in Hurley
The poverty data for Hurley shows that 33 of the married-couple family households (13.8%) and 13 of the single-parent households (16.9%) are living below the poverty level. Within the married-couple family households, those with 3 or 4 children have the highest poverty rate, with 6 households (50.0%) falling below the poverty line. Among the single-parent households, those with 3 or 4 children have the highest poverty rate, with 8 household (72.7%) living below poverty.
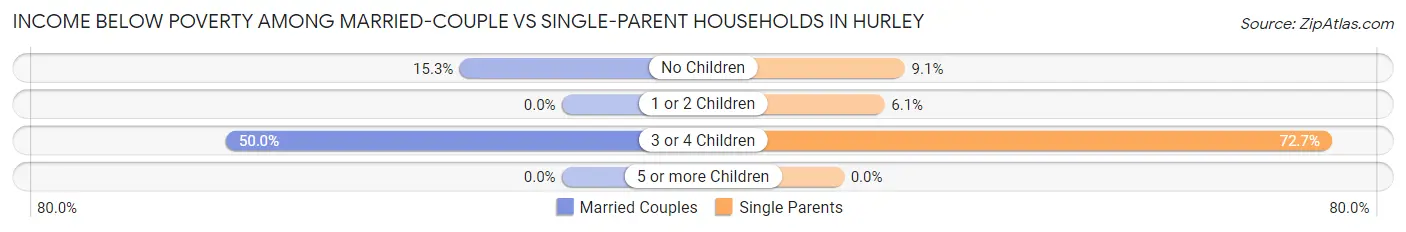
| Children | Married-Couple Families | Single-Parent Households |
| No Children | 27 (15.2%) | 3 (9.1%) |
| 1 or 2 Children | 0 (0.0%) | 2 (6.1%) |
| 3 or 4 Children | 6 (50.0%) | 8 (72.7%) |
| 5 or more Children | 0 (0.0%) | 0 (0.0%) |
| Total | 33 (13.8%) | 13 (16.9%) |
Race in Hurley
The most populous races in Hurley are White / Caucasian (1,328 | 94.5%), Hispanic or Latino (33 | 2.4%), and Asian (22 | 1.6%).
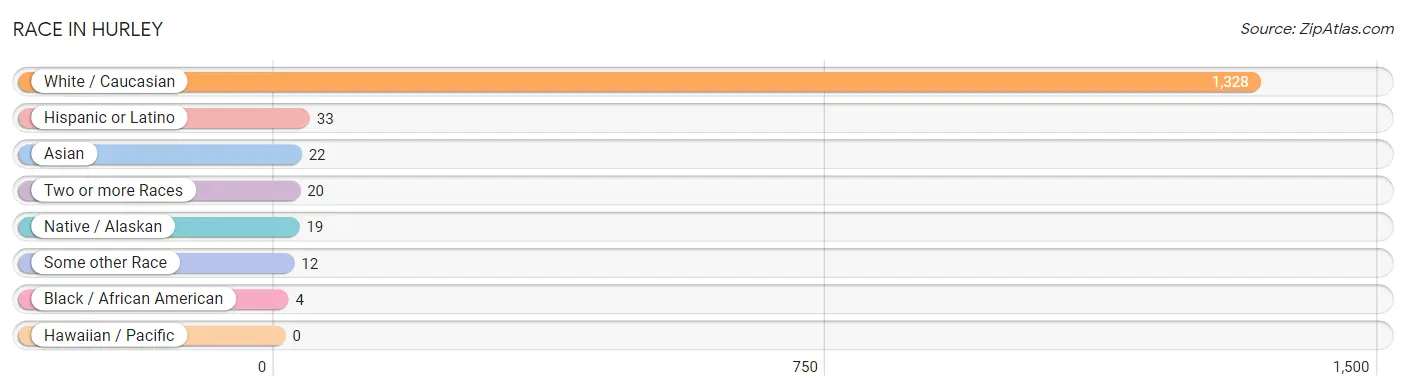
| Race | # Population | % Population |
| Asian | 22 | 1.6% |
| Black / African American | 4 | 0.3% |
| Hawaiian / Pacific | 0 | 0.0% |
| Hispanic or Latino | 33 | 2.4% |
| Native / Alaskan | 19 | 1.3% |
| White / Caucasian | 1,328 | 94.5% |
| Two or more Races | 20 | 1.4% |
| Some other Race | 12 | 0.9% |
| Total | 1,405 | 100.0% |
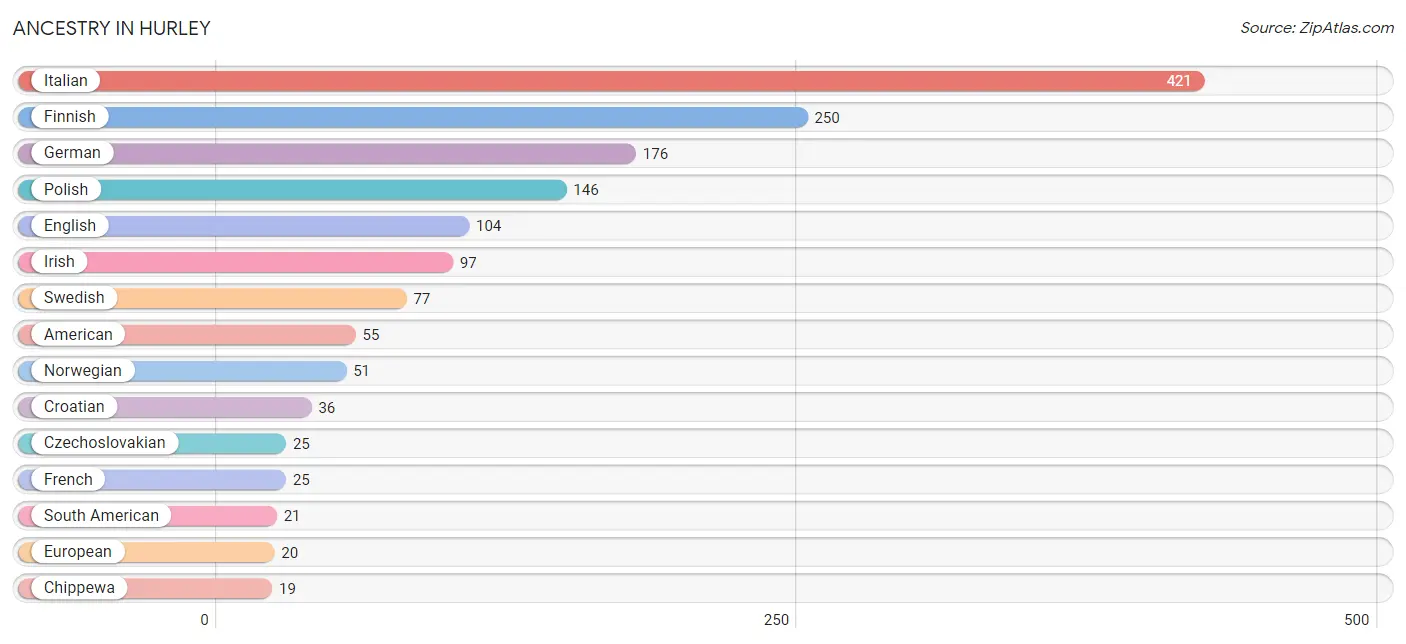
Ancestry in Hurley
The most populous ancestries reported in Hurley are Italian (421 | 30.0%), Finnish (250 | 17.8%), German (176 | 12.5%), Polish (146 | 10.4%), and English (104 | 7.4%), together accounting for 78.1% of all Hurley residents.
| Ancestry | # Population | % Population |
| American | 55 | 3.9% |
| Arab | 4 | 0.3% |
| Austrian | 6 | 0.4% |
| Belgian | 3 | 0.2% |
| Chippewa | 19 | 1.3% |
| Colombian | 11 | 0.8% |
| Croatian | 36 | 2.6% |
| Czech | 3 | 0.2% |
| Czechoslovakian | 25 | 1.8% |
| Danish | 2 | 0.1% |
| Dutch | 15 | 1.1% |
| Eastern European | 2 | 0.1% |
| Ecuadorian | 9 | 0.6% |
| English | 104 | 7.4% |
| European | 20 | 1.4% |
| Finnish | 250 | 17.8% |
| French | 25 | 1.8% |
| French Canadian | 8 | 0.6% |
| German | 176 | 12.5% |
| Greek | 1 | 0.1% |
| Hungarian | 3 | 0.2% |
| Irish | 97 | 6.9% |
| Italian | 421 | 30.0% |
| Korean | 6 | 0.4% |
| Lebanese | 4 | 0.3% |
| Mexican | 11 | 0.8% |
| Northern European | 7 | 0.5% |
| Norwegian | 51 | 3.6% |
| Peruvian | 1 | 0.1% |
| Polish | 146 | 10.4% |
| Scandinavian | 13 | 0.9% |
| Scottish | 5 | 0.4% |
| Slovak | 10 | 0.7% |
| Slovene | 4 | 0.3% |
| South American | 21 | 1.5% |
| South American Indian | 11 | 0.8% |
| Spaniard | 1 | 0.1% |
| Swedish | 77 | 5.5% |
| Thai | 17 | 1.2% |
| Ukrainian | 4 | 0.3% |
| Welsh | 4 | 0.3% | View All 41 Rows |
Immigrants in Hurley
The most numerous immigrant groups reported in Hurley came from Latin America (16 | 1.1%), South America (16 | 1.1%), Asia (11 | 0.8%), Colombia (11 | 0.8%), and Philippines (11 | 0.8%), together accounting for 4.6% of all Hurley residents.
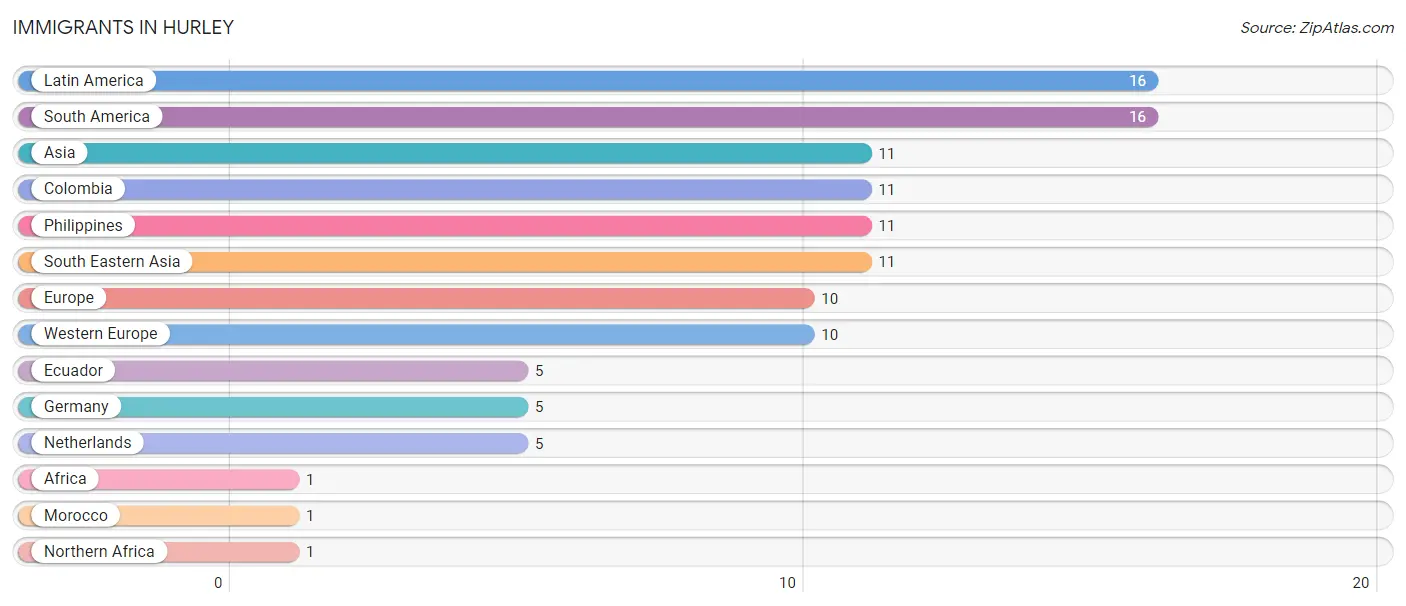
| Immigration Origin | # Population | % Population |
| Africa | 1 | 0.1% |
| Asia | 11 | 0.8% |
| Colombia | 11 | 0.8% |
| Ecuador | 5 | 0.4% |
| Europe | 10 | 0.7% |
| Germany | 5 | 0.4% |
| Latin America | 16 | 1.1% |
| Morocco | 1 | 0.1% |
| Netherlands | 5 | 0.4% |
| Northern Africa | 1 | 0.1% |
| Philippines | 11 | 0.8% |
| South America | 16 | 1.1% |
| South Eastern Asia | 11 | 0.8% |
| Western Europe | 10 | 0.7% | View All 14 Rows |
Sex and Age in Hurley
Sex and Age in Hurley
The most populous age groups in Hurley are 60 to 64 Years (83 | 11.8%) for men and 70 to 74 Years (94 | 13.4%) for women.
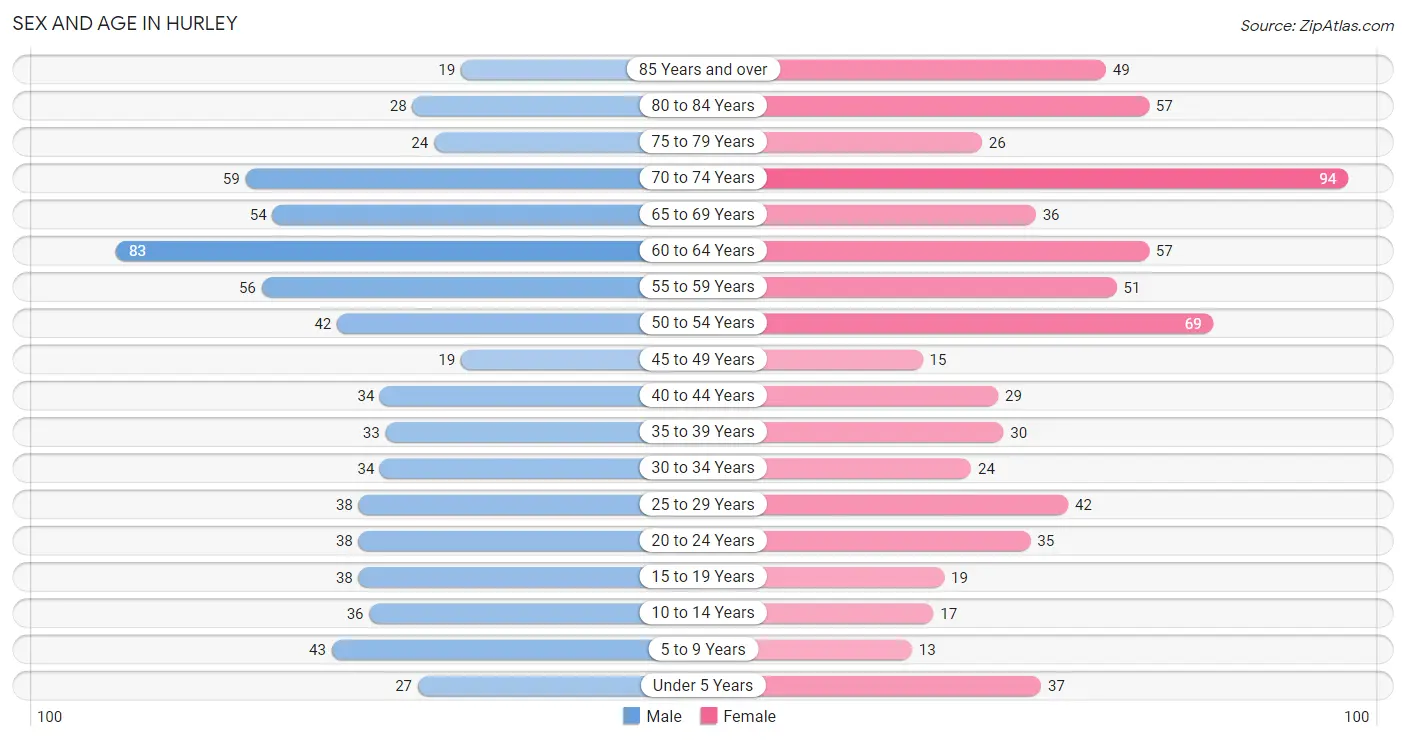
| Age Bracket | Male | Female |
| Under 5 Years | 27 (3.8%) | 37 (5.3%) |
| 5 to 9 Years | 43 (6.1%) | 13 (1.9%) |
| 10 to 14 Years | 36 (5.1%) | 17 (2.4%) |
| 15 to 19 Years | 38 (5.4%) | 19 (2.7%) |
| 20 to 24 Years | 38 (5.4%) | 35 (5.0%) |
| 25 to 29 Years | 38 (5.4%) | 42 (6.0%) |
| 30 to 34 Years | 34 (4.8%) | 24 (3.4%) |
| 35 to 39 Years | 33 (4.7%) | 30 (4.3%) |
| 40 to 44 Years | 34 (4.8%) | 29 (4.1%) |
| 45 to 49 Years | 19 (2.7%) | 15 (2.1%) |
| 50 to 54 Years | 42 (6.0%) | 69 (9.9%) |
| 55 to 59 Years | 56 (7.9%) | 51 (7.3%) |
| 60 to 64 Years | 83 (11.8%) | 57 (8.1%) |
| 65 to 69 Years | 54 (7.7%) | 36 (5.1%) |
| 70 to 74 Years | 59 (8.4%) | 94 (13.4%) |
| 75 to 79 Years | 24 (3.4%) | 26 (3.7%) |
| 80 to 84 Years | 28 (4.0%) | 57 (8.1%) |
| 85 Years and over | 19 (2.7%) | 49 (7.0%) |
| Total | 705 (100.0%) | 700 (100.0%) |
Families and Households in Hurley
Median Family Size in Hurley
The median family size in Hurley is 2.70 persons per family, with single female/mother families (47 | 14.8%) accounting for the largest median family size of 3.26 persons per family. On the other hand, single male/father families (30 | 9.5%) represent the smallest median family size with 2.50 persons per family.
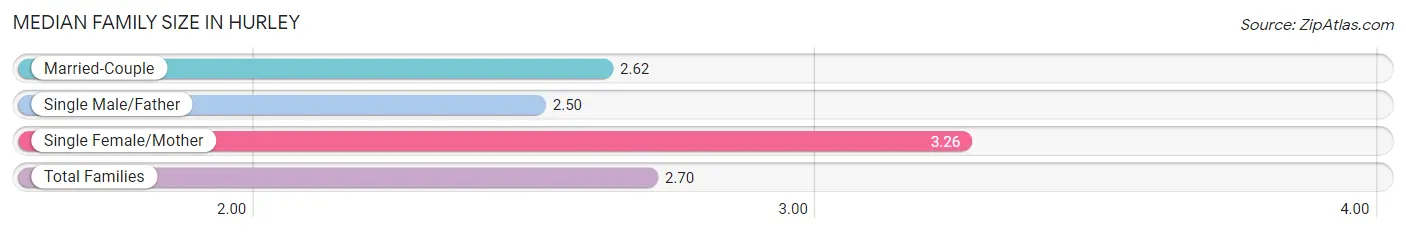
| Family Type | # Families | Family Size |
| Married-Couple | 240 (75.7%) | 2.62 |
| Single Male/Father | 30 (9.5%) | 2.50 |
| Single Female/Mother | 47 (14.8%) | 3.26 |
| Total Families | 317 (100.0%) | 2.70 |
Median Household Size in Hurley
The median household size in Hurley is 1.89 persons per household, with single female/mother households (47 | 6.8%) accounting for the largest median household size of 3.34 persons per household. non-family households (371 | 53.9%) represent the smallest median household size with 1.16 persons per household.
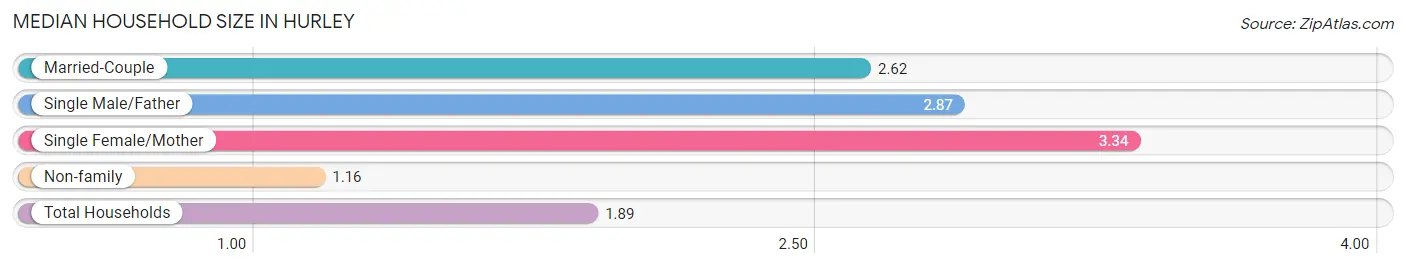
| Household Type | # Households | Household Size |
| Married-Couple | 240 (34.9%) | 2.62 |
| Single Male/Father | 30 (4.4%) | 2.87 |
| Single Female/Mother | 47 (6.8%) | 3.34 |
| Non-family | 371 (53.9%) | 1.16 |
| Total Households | 688 (100.0%) | 1.89 |
Household Size by Marriage Status in Hurley
Out of a total of 688 households in Hurley, 317 (46.1%) are family households, while 371 (53.9%) are nonfamily households. The most numerous type of family households are 2-person households, comprising 194, and the most common type of nonfamily households are 1-person households, comprising 286.
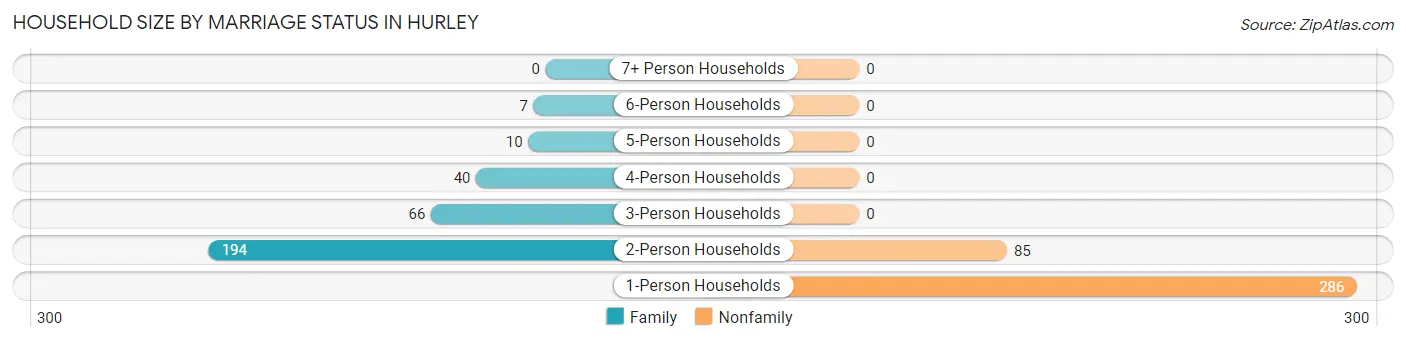
| Household Size | Family Households | Nonfamily Households |
| 1-Person Households | - | 286 (41.6%) |
| 2-Person Households | 194 (28.2%) | 85 (12.3%) |
| 3-Person Households | 66 (9.6%) | 0 (0.0%) |
| 4-Person Households | 40 (5.8%) | 0 (0.0%) |
| 5-Person Households | 10 (1.5%) | 0 (0.0%) |
| 6-Person Households | 7 (1.0%) | 0 (0.0%) |
| 7+ Person Households | 0 (0.0%) | 0 (0.0%) |
| Total | 317 (46.1%) | 371 (53.9%) |
Female Fertility in Hurley
Fertility by Age in Hurley
Average fertility rate in Hurley is 171.0 births per 1,000 women. Women in the age bracket of 20 to 34 years have the highest fertility rate with 307.0 births per 1,000 women. Women in the age bracket of 20 to 34 years acount for 91.2% of all women with births.
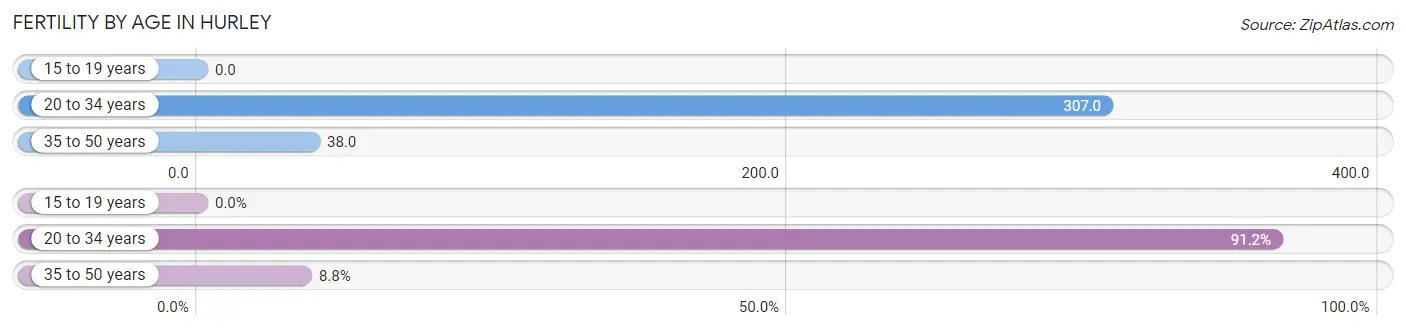
| Age Bracket | Women with Births | Births / 1,000 Women |
| 15 to 19 years | 0 (0.0%) | 0.0 |
| 20 to 34 years | 31 (91.2%) | 307.0 |
| 35 to 50 years | 3 (8.8%) | 38.0 |
| Total | 34 (100.0%) | 171.0 |
Fertility by Age by Marriage Status in Hurley
79.4% of women with births (34) in Hurley are married. The highest percentage of unmarried women with births falls into 20 to 34 years age bracket with 22.6% of them unmarried at the time of birth, while the lowest percentage of unmarried women with births belong to 35 to 50 years age bracket with 0.0% of them unmarried.
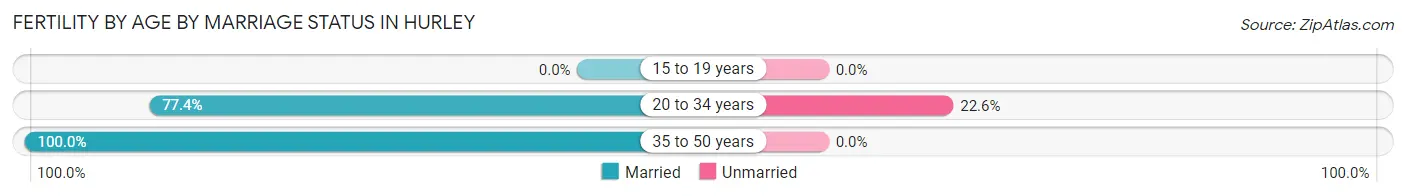
| Age Bracket | Married | Unmarried |
| 15 to 19 years | 0 (0.0%) | 0 (0.0%) |
| 20 to 34 years | 24 (77.4%) | 7 (22.6%) |
| 35 to 50 years | 3 (100.0%) | 0 (0.0%) |
| Total | 27 (79.4%) | 7 (20.6%) |
Fertility by Education in Hurley
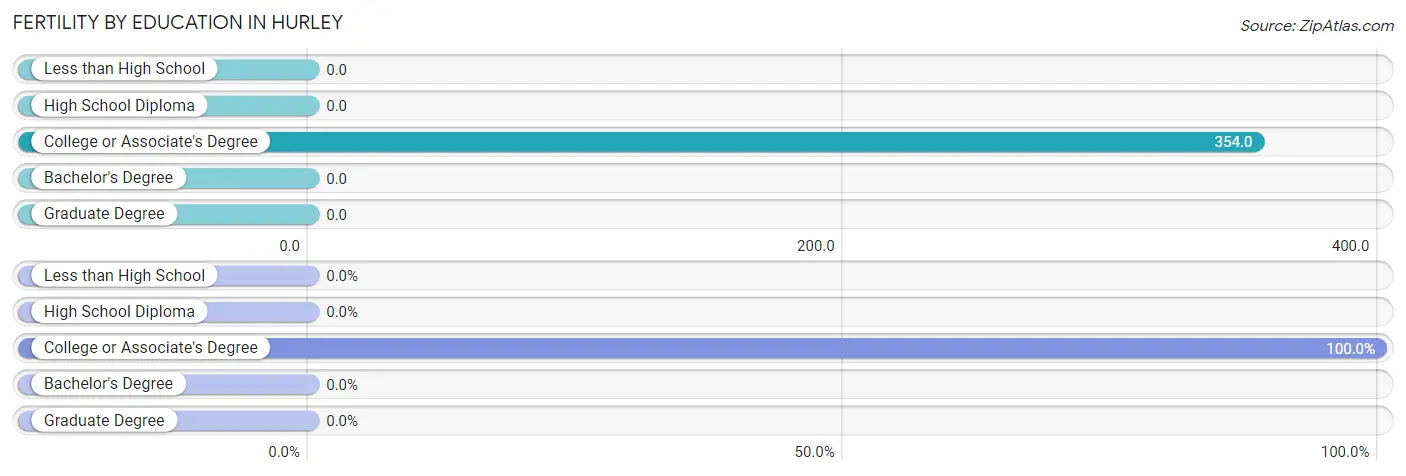
| Educational Attainment | Women with Births | Births / 1,000 Women |
| Less than High School | 0 (0.0%) | 0.0 |
| High School Diploma | 0 (0.0%) | 0.0 |
| College or Associate's Degree | 34 (100.0%) | 354.0 |
| Bachelor's Degree | 0 (0.0%) | 0.0 |
| Graduate Degree | 0 (0.0%) | 0.0 |
| Total | 34 (100.0%) | 171.0 |
Fertility by Education by Marriage Status in Hurley
20.6% of women with births in Hurley are unmarried. Women with the educational attainment of college or associate's degree are most likely to be married with 79.4% of them married at childbirth, while women with the educational attainment of college or associate's degree are least likely to be married with 20.6% of them unmarried at childbirth.
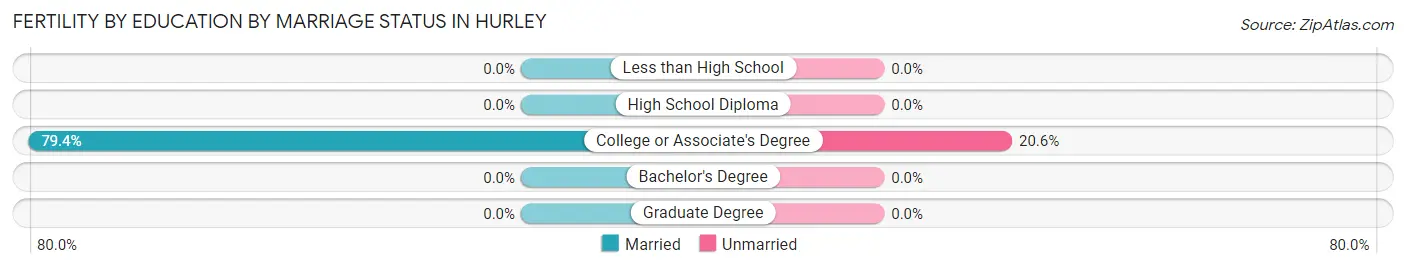
| Educational Attainment | Married | Unmarried |
| Less than High School | 0 (0.0%) | 0 (0.0%) |
| High School Diploma | 0 (0.0%) | 0 (0.0%) |
| College or Associate's Degree | 27 (79.4%) | 7 (20.6%) |
| Bachelor's Degree | 0 (0.0%) | 0 (0.0%) |
| Graduate Degree | 0 (0.0%) | 0 (0.0%) |
| Total | 27 (79.4%) | 7 (20.6%) |
Employment Characteristics in Hurley
Employment by Class of Employer in Hurley
Among the 591 employed individuals in Hurley, private company employees (338 | 57.2%), self-employed (not incorporated) (92 | 15.6%), and not-for-profit organizations (61 | 10.3%) make up the most common classes of employment.
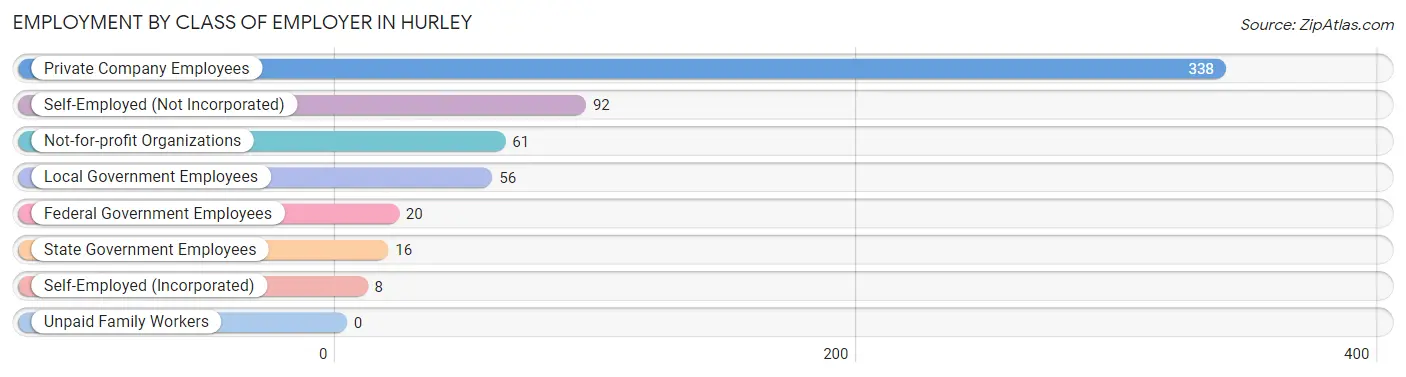
| Employer Class | # Employees | % Employees |
| Private Company Employees | 338 | 57.2% |
| Self-Employed (Incorporated) | 8 | 1.3% |
| Self-Employed (Not Incorporated) | 92 | 15.6% |
| Not-for-profit Organizations | 61 | 10.3% |
| Local Government Employees | 56 | 9.5% |
| State Government Employees | 16 | 2.7% |
| Federal Government Employees | 20 | 3.4% |
| Unpaid Family Workers | 0 | 0.0% |
| Total | 591 | 100.0% |
Employment Status by Age in Hurley
According to the labor force statistics for Hurley, out of the total population over 16 years of age (1,226), 51.7% or 634 individuals are in the labor force, with 6.2% or 39 of them unemployed. The age group with the highest labor force participation rate is 25 to 29 years, with 90.0% or 72 individuals in the labor force. Within the labor force, the 30 to 34 years age range has the highest percentage of unemployed individuals, with 25.0% or 13 of them being unemployed.
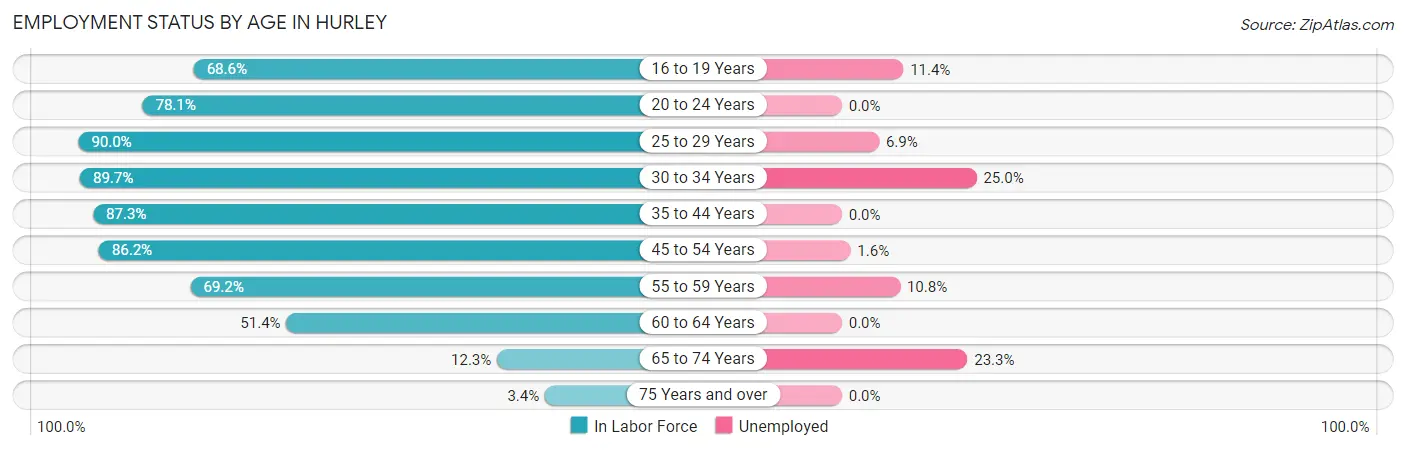
| Age Bracket | In Labor Force | Unemployed |
| 16 to 19 Years | 35 (68.6%) | 4 (11.4%) |
| 20 to 24 Years | 57 (78.1%) | 0 (0.0%) |
| 25 to 29 Years | 72 (90.0%) | 5 (6.9%) |
| 30 to 34 Years | 52 (89.7%) | 13 (25.0%) |
| 35 to 44 Years | 110 (87.3%) | 0 (0.0%) |
| 45 to 54 Years | 125 (86.2%) | 2 (1.6%) |
| 55 to 59 Years | 74 (69.2%) | 8 (10.8%) |
| 60 to 64 Years | 72 (51.4%) | 0 (0.0%) |
| 65 to 74 Years | 30 (12.3%) | 7 (23.3%) |
| 75 Years and over | 7 (3.4%) | 0 (0.0%) |
| Total | 634 (51.7%) | 39 (6.2%) |
Employment Status by Educational Attainment in Hurley
According to labor force statistics for Hurley, 77.0% of individuals (505) out of the total population between 25 and 64 years of age (656) are in the labor force, with 5.5% or 28 of them being unemployed. The group with the highest labor force participation rate are those with the educational attainment of college / associate degree, with 80.0% or 220 individuals in the labor force. Within the labor force, individuals with college / associate degree education have the highest percentage of unemployment, with 9.1% or 20 of them being unemployed.
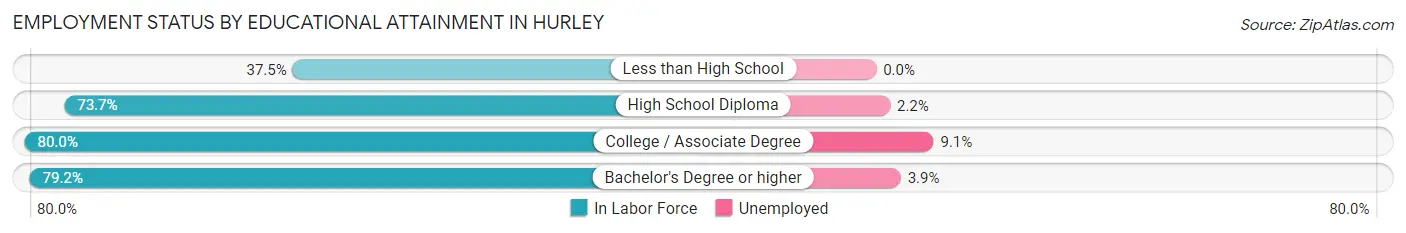
| Educational Attainment | In Labor Force | Unemployed |
| Less than High School | 3 (37.5%) | 0 (0.0%) |
| High School Diploma | 179 (73.7%) | 5 (2.2%) |
| College / Associate Degree | 220 (80.0%) | 25 (9.1%) |
| Bachelor's Degree or higher | 103 (79.2%) | 5 (3.9%) |
| Total | 505 (77.0%) | 36 (5.5%) |
Employment Occupations by Sex in Hurley
Management, Business, Science and Arts Occupations
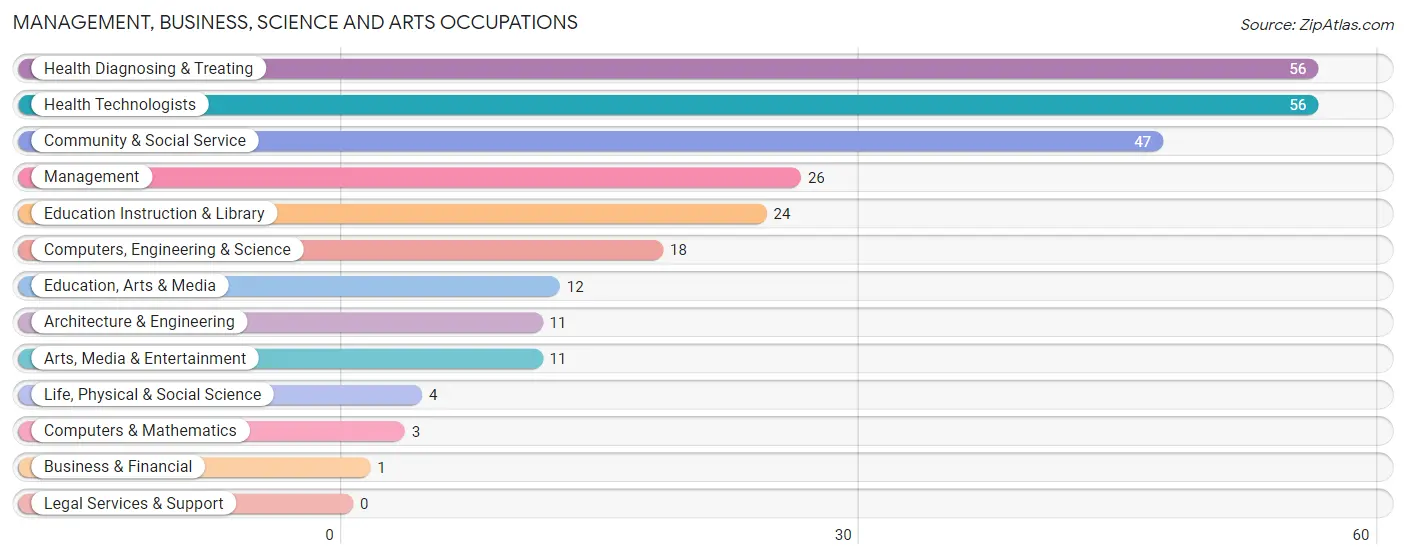
The most common Management, Business, Science and Arts occupations in Hurley are Health Diagnosing & Treating (56 | 9.4%), Health Technologists (56 | 9.4%), Community & Social Service (47 | 7.9%), Management (26 | 4.4%), and Education Instruction & Library (24 | 4.0%).
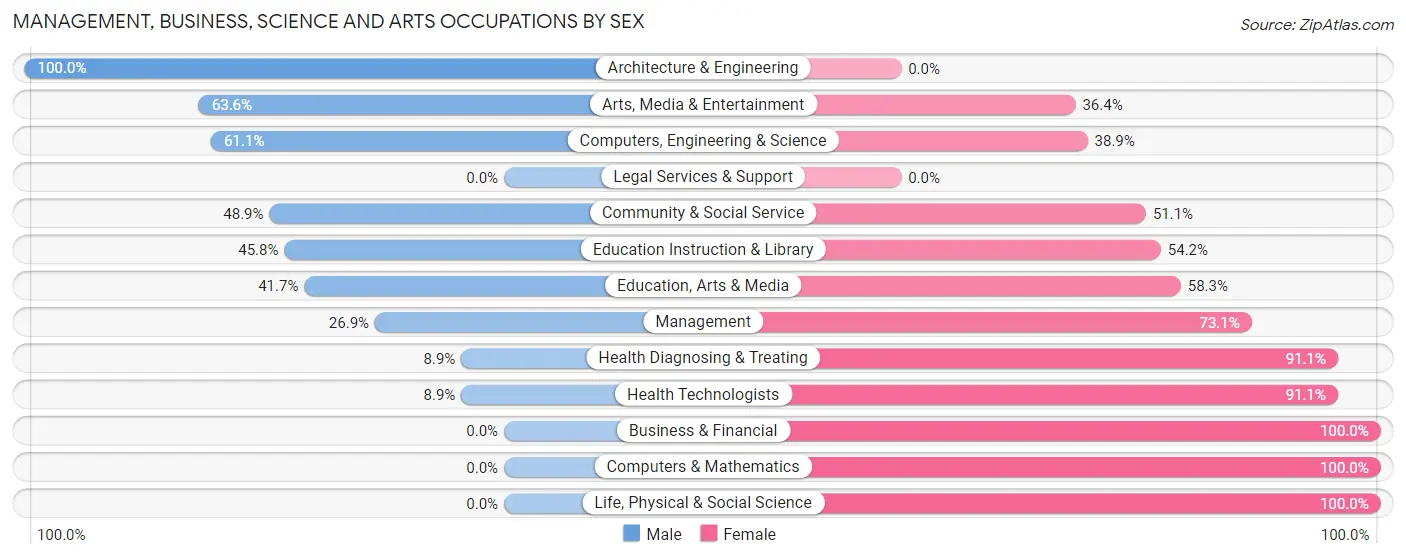
Management, Business, Science and Arts Occupations by Sex
Within the Management, Business, Science and Arts occupations in Hurley, the most male-oriented occupations are Architecture & Engineering (100.0%), Arts, Media & Entertainment (63.6%), and Computers, Engineering & Science (61.1%), while the most female-oriented occupations are Business & Financial (100.0%), Computers & Mathematics (100.0%), and Life, Physical & Social Science (100.0%).
| Occupation | Male | Female |
| Management | 7 (26.9%) | 19 (73.1%) |
| Business & Financial | 0 (0.0%) | 1 (100.0%) |
| Computers, Engineering & Science | 11 (61.1%) | 7 (38.9%) |
| Computers & Mathematics | 0 (0.0%) | 3 (100.0%) |
| Architecture & Engineering | 11 (100.0%) | 0 (0.0%) |
| Life, Physical & Social Science | 0 (0.0%) | 4 (100.0%) |
| Community & Social Service | 23 (48.9%) | 24 (51.1%) |
| Education, Arts & Media | 5 (41.7%) | 7 (58.3%) |
| Legal Services & Support | 0 (0.0%) | 0 (0.0%) |
| Education Instruction & Library | 11 (45.8%) | 13 (54.2%) |
| Arts, Media & Entertainment | 7 (63.6%) | 4 (36.4%) |
| Health Diagnosing & Treating | 5 (8.9%) | 51 (91.1%) |
| Health Technologists | 5 (8.9%) | 51 (91.1%) |
| Total (Category) | 46 (31.1%) | 102 (68.9%) |
| Total (Overall) | 325 (54.6%) | 270 (45.4%) |
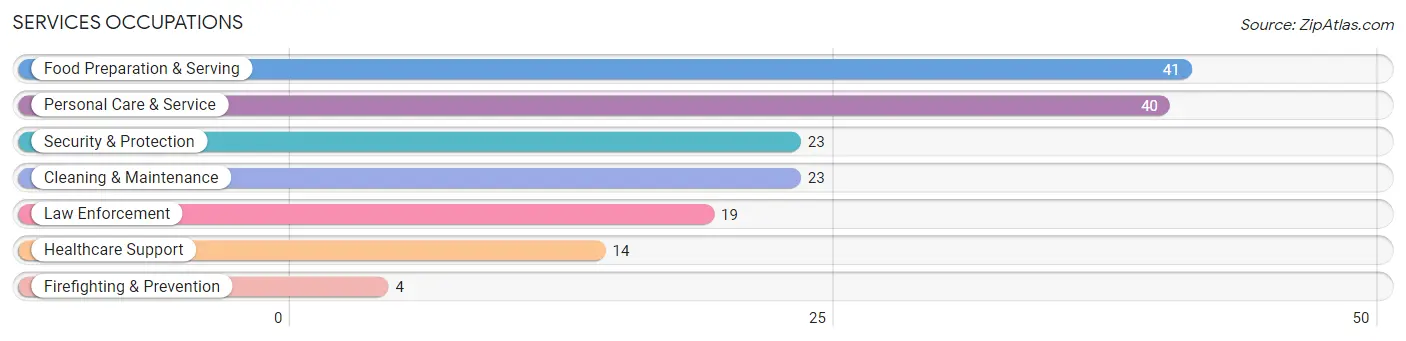
Services Occupations
The most common Services occupations in Hurley are Food Preparation & Serving (41 | 6.9%), Personal Care & Service (40 | 6.7%), Security & Protection (23 | 3.9%), Cleaning & Maintenance (23 | 3.9%), and Law Enforcement (19 | 3.2%).
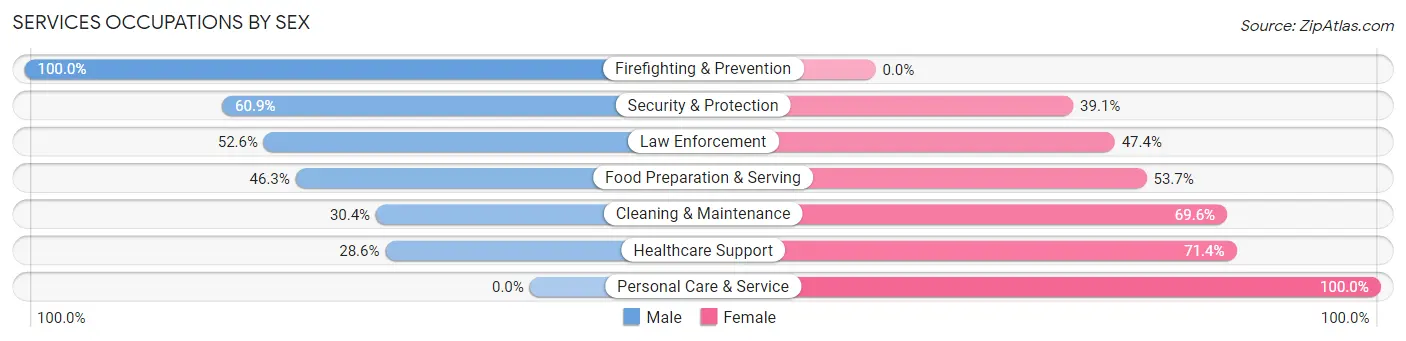
Services Occupations by Sex
Within the Services occupations in Hurley, the most male-oriented occupations are Firefighting & Prevention (100.0%), Security & Protection (60.9%), and Law Enforcement (52.6%), while the most female-oriented occupations are Personal Care & Service (100.0%), Healthcare Support (71.4%), and Cleaning & Maintenance (69.6%).
| Occupation | Male | Female |
| Healthcare Support | 4 (28.6%) | 10 (71.4%) |
| Security & Protection | 14 (60.9%) | 9 (39.1%) |
| Firefighting & Prevention | 4 (100.0%) | 0 (0.0%) |
| Law Enforcement | 10 (52.6%) | 9 (47.4%) |
| Food Preparation & Serving | 19 (46.3%) | 22 (53.7%) |
| Cleaning & Maintenance | 7 (30.4%) | 16 (69.6%) |
| Personal Care & Service | 0 (0.0%) | 40 (100.0%) |
| Total (Category) | 44 (31.2%) | 97 (68.8%) |
| Total (Overall) | 325 (54.6%) | 270 (45.4%) |
Sales and Office Occupations
The most common Sales and Office occupations in Hurley are Sales & Related (63 | 10.6%), and Office & Administration (42 | 7.1%).
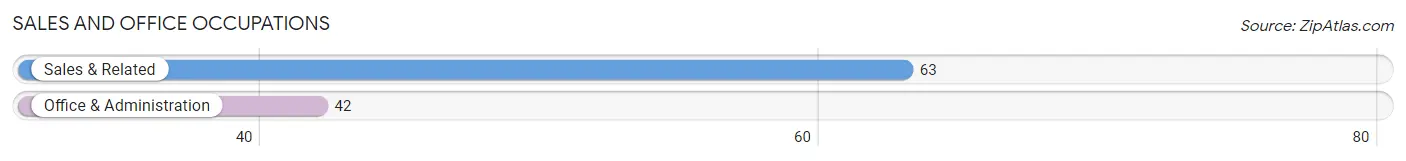
Sales and Office Occupations by Sex
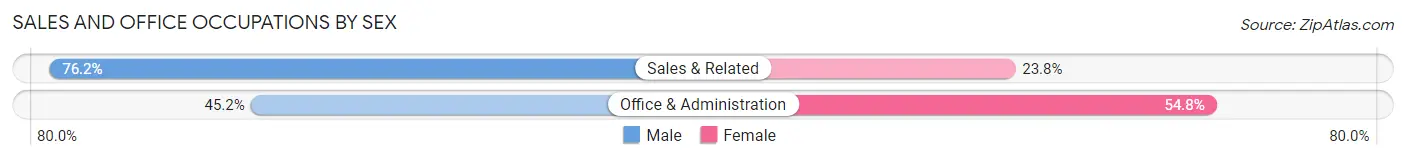
| Occupation | Male | Female |
| Sales & Related | 48 (76.2%) | 15 (23.8%) |
| Office & Administration | 19 (45.2%) | 23 (54.8%) |
| Total (Category) | 67 (63.8%) | 38 (36.2%) |
| Total (Overall) | 325 (54.6%) | 270 (45.4%) |
Natural Resources, Construction and Maintenance Occupations
The most common Natural Resources, Construction and Maintenance occupations in Hurley are Construction & Extraction (65 | 10.9%), Installation, Maintenance & Repair (25 | 4.2%), and Farming, Fishing & Forestry (10 | 1.7%).
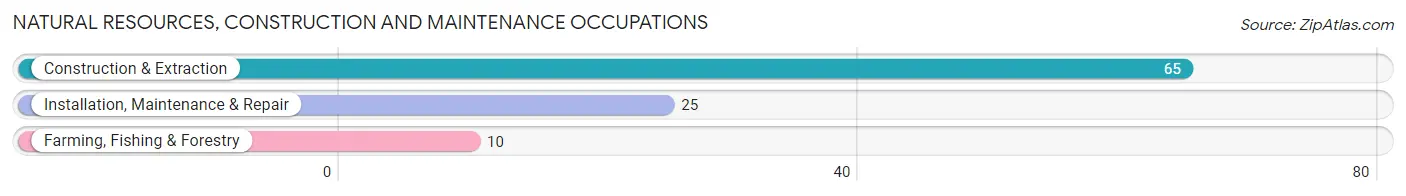
Natural Resources, Construction and Maintenance Occupations by Sex
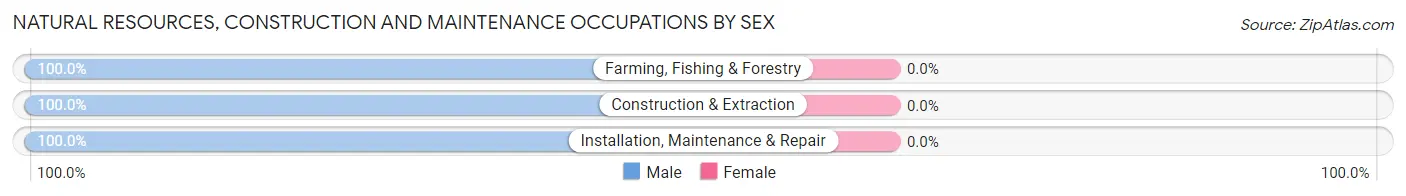
| Occupation | Male | Female |
| Farming, Fishing & Forestry | 10 (100.0%) | 0 (0.0%) |
| Construction & Extraction | 65 (100.0%) | 0 (0.0%) |
| Installation, Maintenance & Repair | 25 (100.0%) | 0 (0.0%) |
| Total (Category) | 100 (100.0%) | 0 (0.0%) |
| Total (Overall) | 325 (54.6%) | 270 (45.4%) |
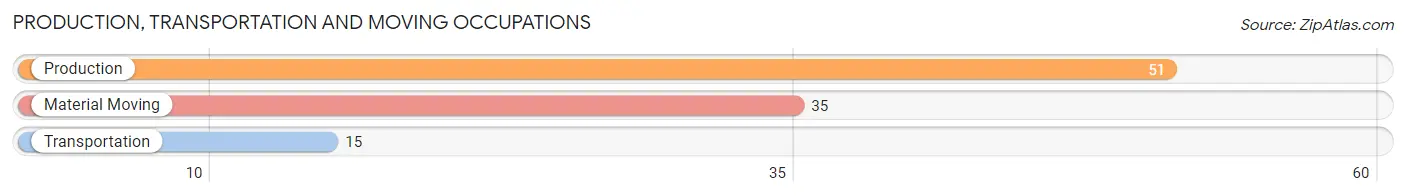
Production, Transportation and Moving Occupations
The most common Production, Transportation and Moving occupations in Hurley are Production (51 | 8.6%), Material Moving (35 | 5.9%), and Transportation (15 | 2.5%).
Production, Transportation and Moving Occupations by Sex
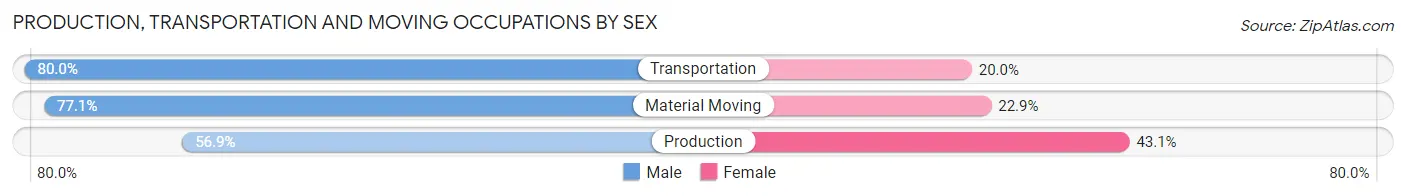
| Occupation | Male | Female |
| Production | 29 (56.9%) | 22 (43.1%) |
| Transportation | 12 (80.0%) | 3 (20.0%) |
| Material Moving | 27 (77.1%) | 8 (22.9%) |
| Total (Category) | 68 (67.3%) | 33 (32.7%) |
| Total (Overall) | 325 (54.6%) | 270 (45.4%) |
Employment Industries by Sex in Hurley
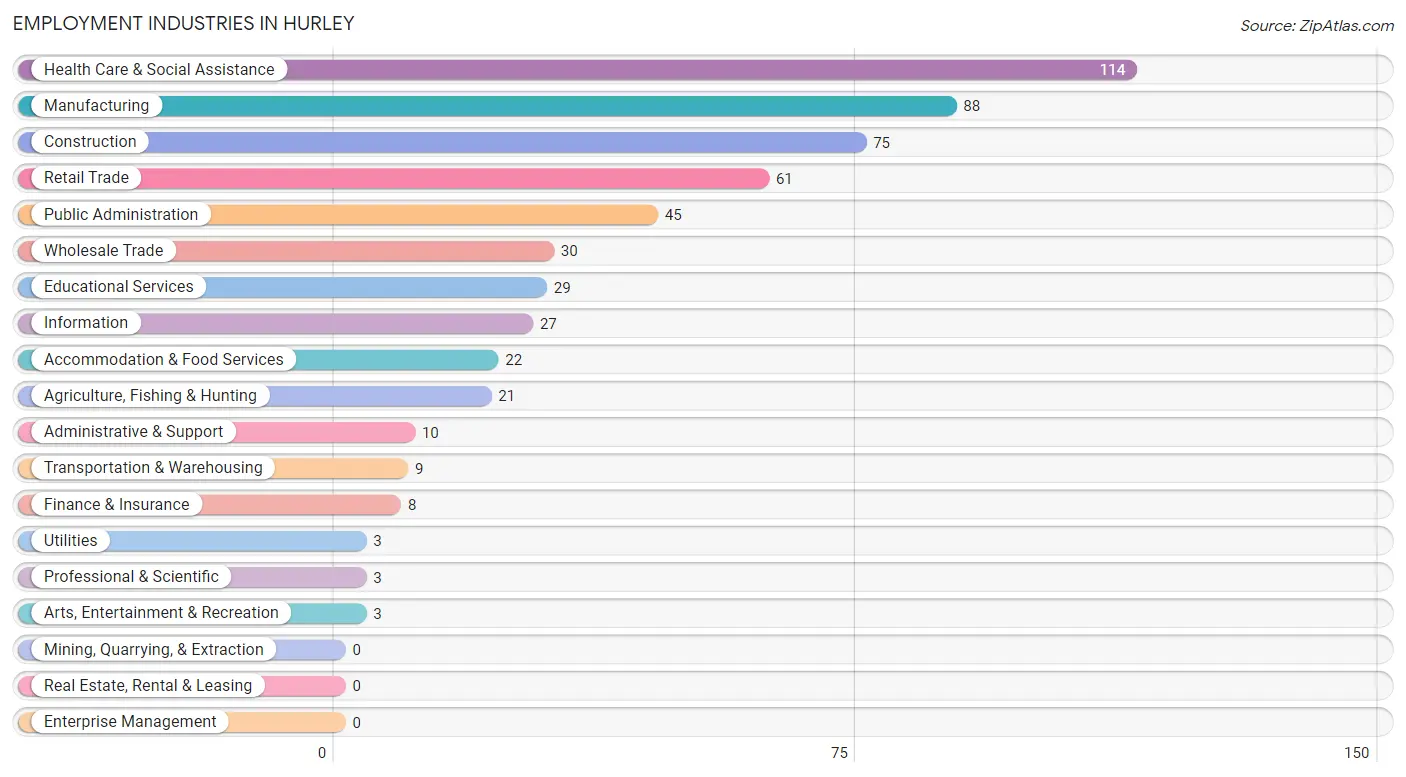
Employment Industries in Hurley
The major employment industries in Hurley include Health Care & Social Assistance (114 | 19.2%), Manufacturing (88 | 14.8%), Construction (75 | 12.6%), Retail Trade (61 | 10.2%), and Public Administration (45 | 7.6%).
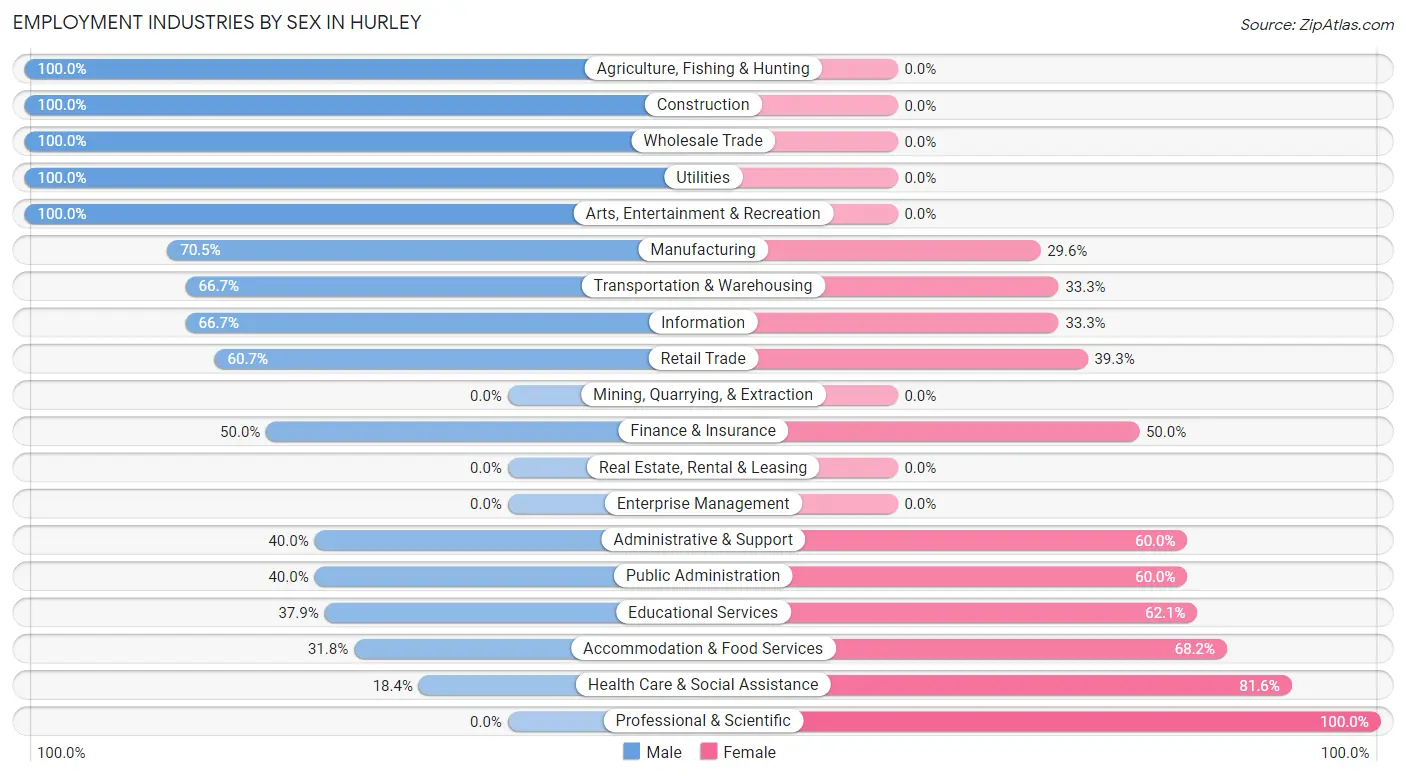
Employment Industries by Sex in Hurley
The Hurley industries that see more men than women are Agriculture, Fishing & Hunting (100.0%), Construction (100.0%), and Wholesale Trade (100.0%), whereas the industries that tend to have a higher number of women are Professional & Scientific (100.0%), Health Care & Social Assistance (81.6%), and Accommodation & Food Services (68.2%).
| Industry | Male | Female |
| Agriculture, Fishing & Hunting | 21 (100.0%) | 0 (0.0%) |
| Mining, Quarrying, & Extraction | 0 (0.0%) | 0 (0.0%) |
| Construction | 75 (100.0%) | 0 (0.0%) |
| Manufacturing | 62 (70.5%) | 26 (29.5%) |
| Wholesale Trade | 30 (100.0%) | 0 (0.0%) |
| Retail Trade | 37 (60.7%) | 24 (39.3%) |
| Transportation & Warehousing | 6 (66.7%) | 3 (33.3%) |
| Utilities | 3 (100.0%) | 0 (0.0%) |
| Information | 18 (66.7%) | 9 (33.3%) |
| Finance & Insurance | 4 (50.0%) | 4 (50.0%) |
| Real Estate, Rental & Leasing | 0 (0.0%) | 0 (0.0%) |
| Professional & Scientific | 0 (0.0%) | 3 (100.0%) |
| Enterprise Management | 0 (0.0%) | 0 (0.0%) |
| Administrative & Support | 4 (40.0%) | 6 (60.0%) |
| Educational Services | 11 (37.9%) | 18 (62.1%) |
| Health Care & Social Assistance | 21 (18.4%) | 93 (81.6%) |
| Arts, Entertainment & Recreation | 3 (100.0%) | 0 (0.0%) |
| Accommodation & Food Services | 7 (31.8%) | 15 (68.2%) |
| Public Administration | 18 (40.0%) | 27 (60.0%) |
| Total | 325 (54.6%) | 270 (45.4%) |
Education in Hurley
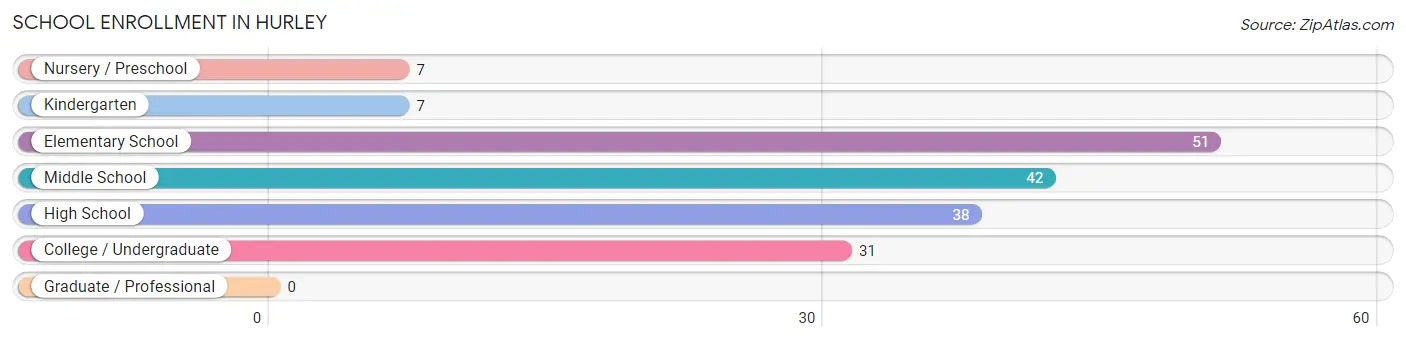
School Enrollment in Hurley
The most common levels of schooling among the 176 students in Hurley are elementary school (51 | 29.0%), middle school (42 | 23.9%), and high school (38 | 21.6%).
| School Level | # Students | % Students |
| Nursery / Preschool | 7 | 4.0% |
| Kindergarten | 7 | 4.0% |
| Elementary School | 51 | 29.0% |
| Middle School | 42 | 23.9% |
| High School | 38 | 21.6% |
| College / Undergraduate | 31 | 17.6% |
| Graduate / Professional | 0 | 0.0% |
| Total | 176 | 100.0% |
School Enrollment by Age by Funding Source in Hurley
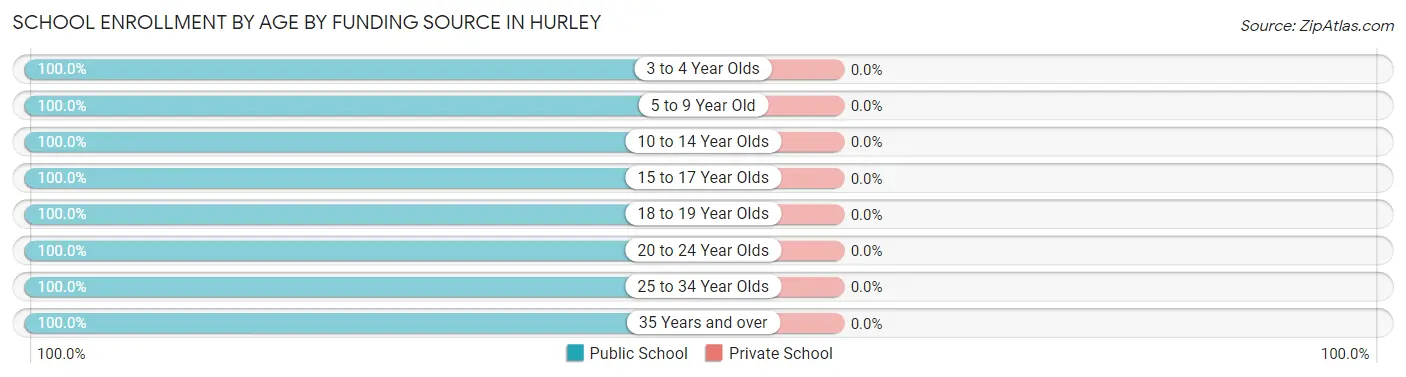
| Age Bracket | Public School | Private School |
| 3 to 4 Year Olds | 5 (100.0%) | 0 (0.0%) |
| 5 to 9 Year Old | 49 (100.0%) | 0 (0.0%) |
| 10 to 14 Year Olds | 53 (100.0%) | 0 (0.0%) |
| 15 to 17 Year Olds | 26 (100.0%) | 0 (0.0%) |
| 18 to 19 Year Olds | 16 (100.0%) | 0 (0.0%) |
| 20 to 24 Year Olds | 22 (100.0%) | 0 (0.0%) |
| 25 to 34 Year Olds | 4 (100.0%) | 0 (0.0%) |
| 35 Years and over | 1 (100.0%) | 0 (0.0%) |
| Total | 176 (100.0%) | 0 (0.0%) |
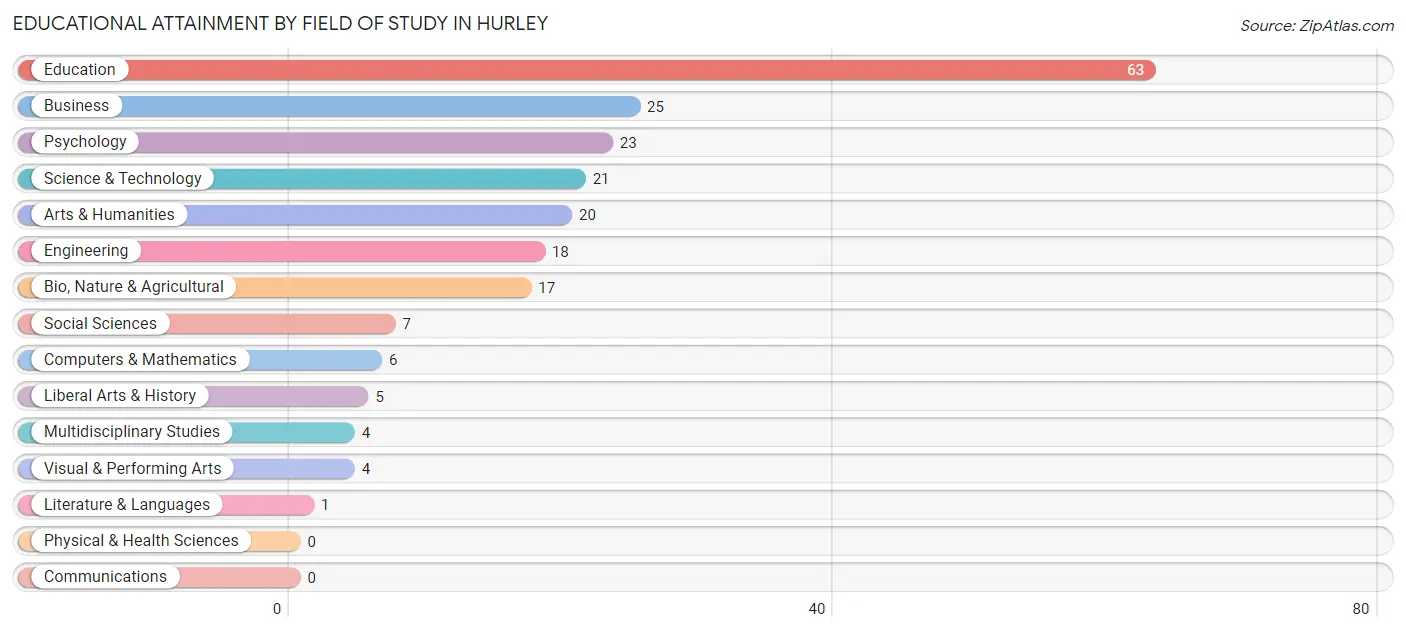
Educational Attainment by Field of Study in Hurley
Education (63 | 29.4%), business (25 | 11.7%), psychology (23 | 10.7%), science & technology (21 | 9.8%), and arts & humanities (20 | 9.3%) are the most common fields of study among 214 individuals in Hurley who have obtained a bachelor's degree or higher.
| Field of Study | # Graduates | % Graduates |
| Computers & Mathematics | 6 | 2.8% |
| Bio, Nature & Agricultural | 17 | 7.9% |
| Physical & Health Sciences | 0 | 0.0% |
| Psychology | 23 | 10.7% |
| Social Sciences | 7 | 3.3% |
| Engineering | 18 | 8.4% |
| Multidisciplinary Studies | 4 | 1.9% |
| Science & Technology | 21 | 9.8% |
| Business | 25 | 11.7% |
| Education | 63 | 29.4% |
| Literature & Languages | 1 | 0.5% |
| Liberal Arts & History | 5 | 2.3% |
| Visual & Performing Arts | 4 | 1.9% |
| Communications | 0 | 0.0% |
| Arts & Humanities | 20 | 9.3% |
| Total | 214 | 100.0% |
Transportation & Commute in Hurley
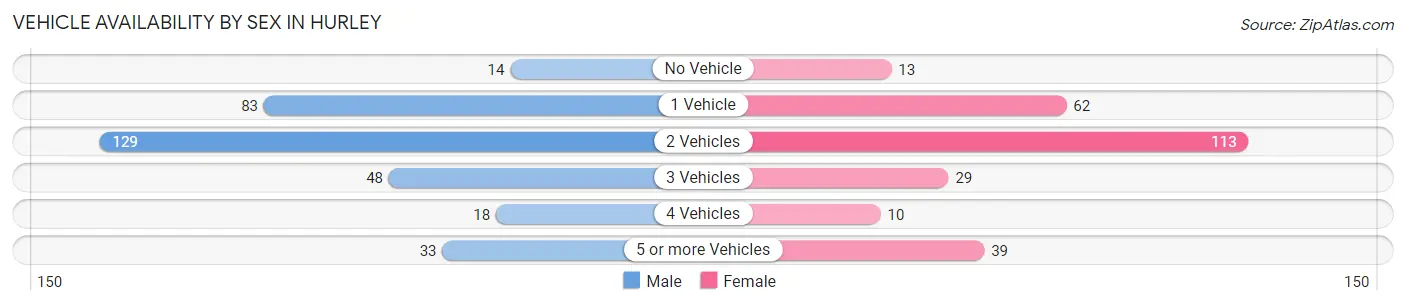
Vehicle Availability by Sex in Hurley
The most prevalent vehicle ownership categories in Hurley are males with 2 vehicles (129, accounting for 39.7%) and females with 2 vehicles (113, making up 48.5%).
| Vehicles Available | Male | Female |
| No Vehicle | 14 (4.3%) | 13 (4.9%) |
| 1 Vehicle | 83 (25.5%) | 62 (23.3%) |
| 2 Vehicles | 129 (39.7%) | 113 (42.5%) |
| 3 Vehicles | 48 (14.8%) | 29 (10.9%) |
| 4 Vehicles | 18 (5.5%) | 10 (3.8%) |
| 5 or more Vehicles | 33 (10.2%) | 39 (14.7%) |
| Total | 325 (100.0%) | 266 (100.0%) |
Commute Time in Hurley
The most frequently occuring commute durations in Hurley are 5 to 9 minutes (161 commuters, 27.9%), 15 to 19 minutes (103 commuters, 17.8%), and 10 to 14 minutes (93 commuters, 16.1%).
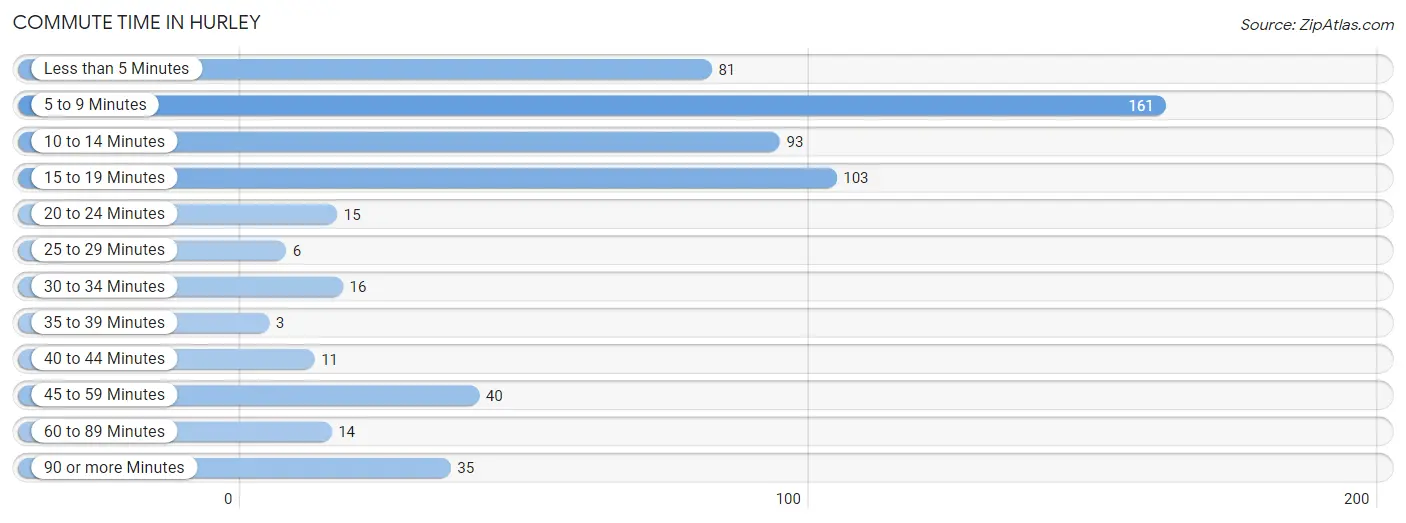
| Commute Time | # Commuters | % Commuters |
| Less than 5 Minutes | 81 | 14.0% |
| 5 to 9 Minutes | 161 | 27.9% |
| 10 to 14 Minutes | 93 | 16.1% |
| 15 to 19 Minutes | 103 | 17.8% |
| 20 to 24 Minutes | 15 | 2.6% |
| 25 to 29 Minutes | 6 | 1.0% |
| 30 to 34 Minutes | 16 | 2.8% |
| 35 to 39 Minutes | 3 | 0.5% |
| 40 to 44 Minutes | 11 | 1.9% |
| 45 to 59 Minutes | 40 | 6.9% |
| 60 to 89 Minutes | 14 | 2.4% |
| 90 or more Minutes | 35 | 6.1% |
Commute Time by Sex in Hurley
The most common commute times in Hurley are 5 to 9 minutes (102 commuters, 31.8%) for males and 15 to 19 minutes (65 commuters, 25.3%) for females.
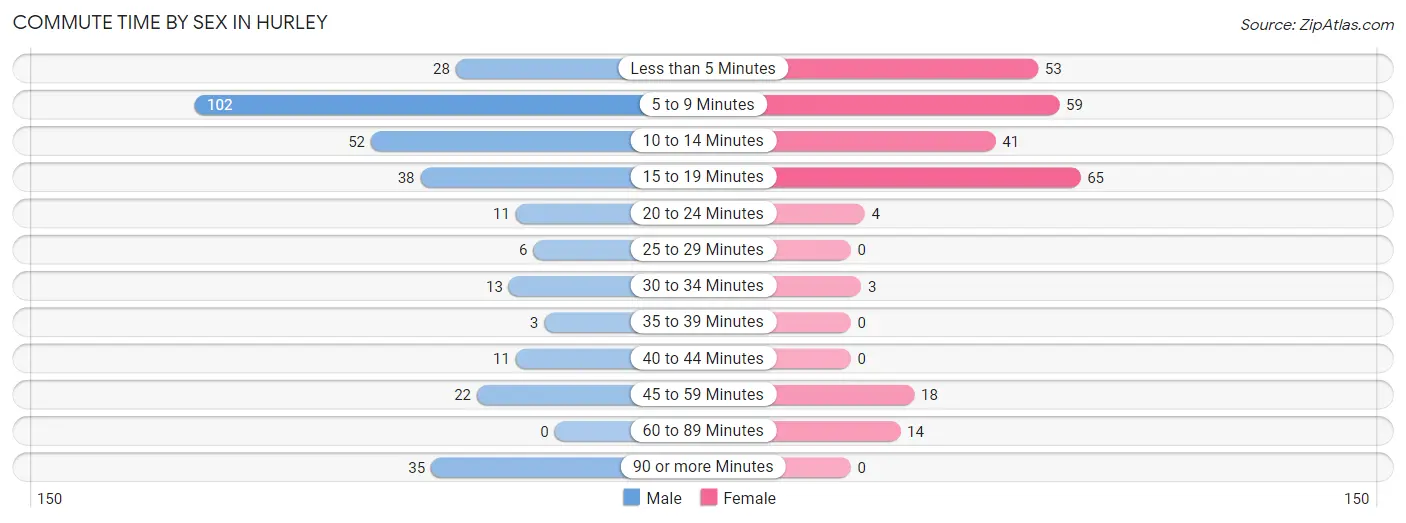
| Commute Time | Male | Female |
| Less than 5 Minutes | 28 (8.7%) | 53 (20.6%) |
| 5 to 9 Minutes | 102 (31.8%) | 59 (23.0%) |
| 10 to 14 Minutes | 52 (16.2%) | 41 (16.0%) |
| 15 to 19 Minutes | 38 (11.8%) | 65 (25.3%) |
| 20 to 24 Minutes | 11 (3.4%) | 4 (1.6%) |
| 25 to 29 Minutes | 6 (1.9%) | 0 (0.0%) |
| 30 to 34 Minutes | 13 (4.1%) | 3 (1.2%) |
| 35 to 39 Minutes | 3 (0.9%) | 0 (0.0%) |
| 40 to 44 Minutes | 11 (3.4%) | 0 (0.0%) |
| 45 to 59 Minutes | 22 (6.9%) | 18 (7.0%) |
| 60 to 89 Minutes | 0 (0.0%) | 14 (5.4%) |
| 90 or more Minutes | 35 (10.9%) | 0 (0.0%) |
Time of Departure to Work by Sex in Hurley
The most frequent times of departure to work in Hurley are 7:30 AM to 7:59 AM (69, 21.5%) for males and 8:30 AM to 8:59 AM (39, 15.2%) for females.
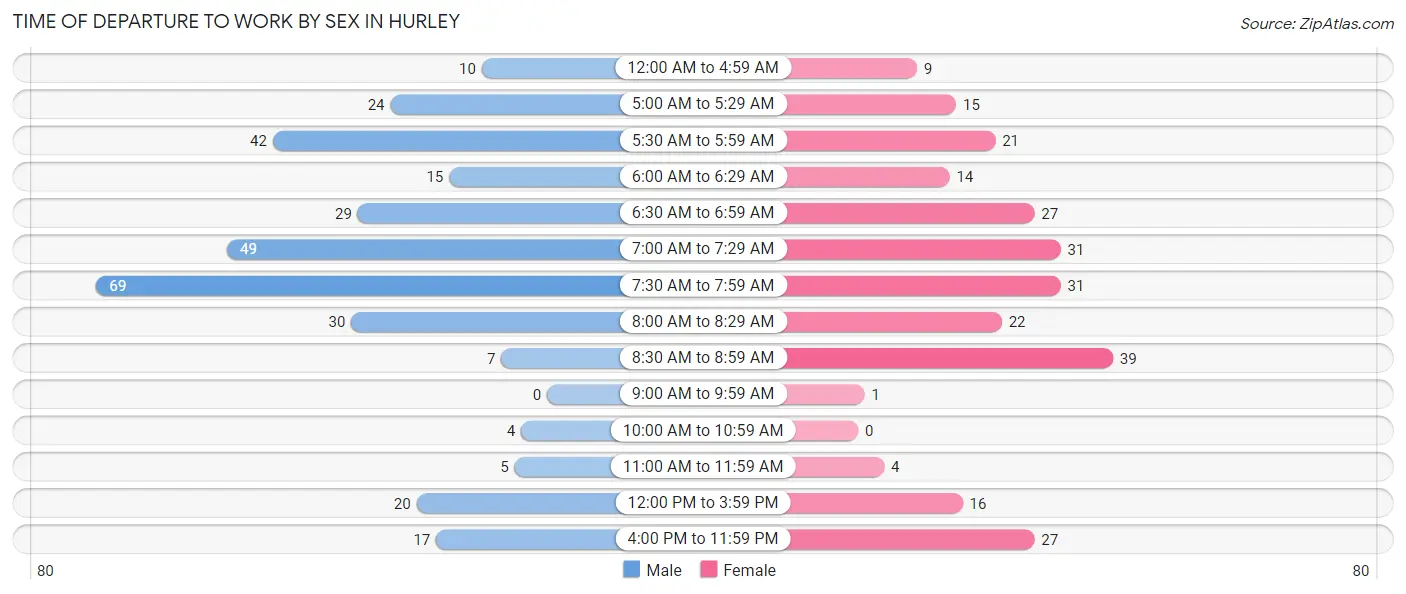
| Time of Departure | Male | Female |
| 12:00 AM to 4:59 AM | 10 (3.1%) | 9 (3.5%) |
| 5:00 AM to 5:29 AM | 24 (7.5%) | 15 (5.8%) |
| 5:30 AM to 5:59 AM | 42 (13.1%) | 21 (8.2%) |
| 6:00 AM to 6:29 AM | 15 (4.7%) | 14 (5.4%) |
| 6:30 AM to 6:59 AM | 29 (9.0%) | 27 (10.5%) |
| 7:00 AM to 7:29 AM | 49 (15.3%) | 31 (12.1%) |
| 7:30 AM to 7:59 AM | 69 (21.5%) | 31 (12.1%) |
| 8:00 AM to 8:29 AM | 30 (9.3%) | 22 (8.6%) |
| 8:30 AM to 8:59 AM | 7 (2.2%) | 39 (15.2%) |
| 9:00 AM to 9:59 AM | 0 (0.0%) | 1 (0.4%) |
| 10:00 AM to 10:59 AM | 4 (1.3%) | 0 (0.0%) |
| 11:00 AM to 11:59 AM | 5 (1.6%) | 4 (1.6%) |
| 12:00 PM to 3:59 PM | 20 (6.2%) | 16 (6.2%) |
| 4:00 PM to 11:59 PM | 17 (5.3%) | 27 (10.5%) |
| Total | 321 (100.0%) | 257 (100.0%) |
Housing Occupancy in Hurley
Occupancy by Ownership in Hurley
Of the total 688 dwellings in Hurley, owner-occupied units account for 469 (68.2%), while renter-occupied units make up 219 (31.8%).
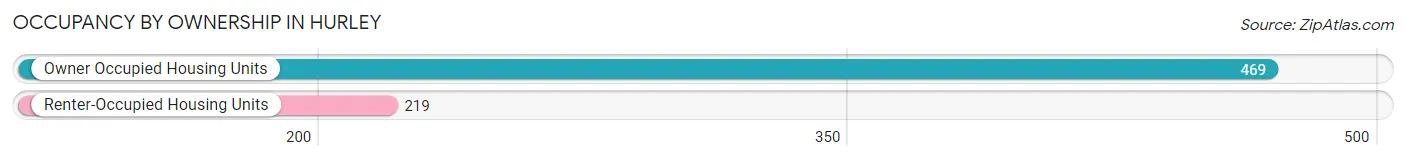
| Occupancy | # Housing Units | % Housing Units |
| Owner Occupied Housing Units | 469 | 68.2% |
| Renter-Occupied Housing Units | 219 | 31.8% |
| Total Occupied Housing Units | 688 | 100.0% |
Occupancy by Household Size in Hurley
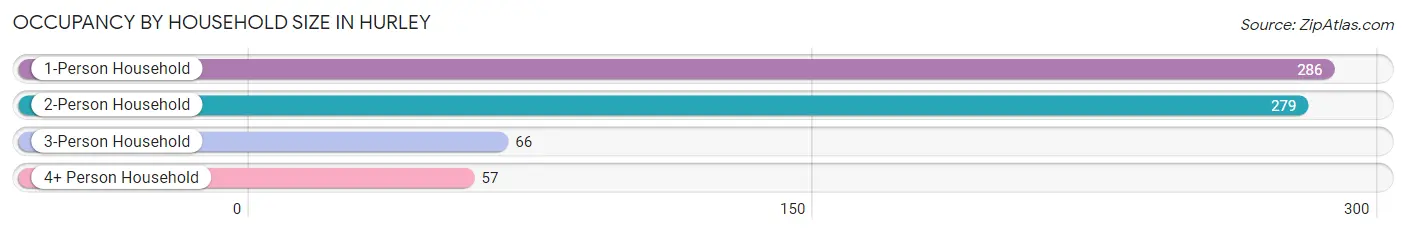
| Household Size | # Housing Units | % Housing Units |
| 1-Person Household | 286 | 41.6% |
| 2-Person Household | 279 | 40.6% |
| 3-Person Household | 66 | 9.6% |
| 4+ Person Household | 57 | 8.3% |
| Total Housing Units | 688 | 100.0% |
Occupancy by Ownership by Household Size in Hurley
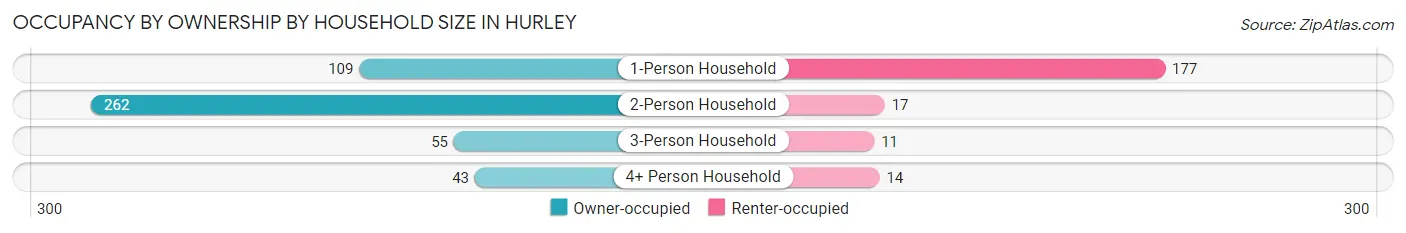
| Household Size | Owner-occupied | Renter-occupied |
| 1-Person Household | 109 (38.1%) | 177 (61.9%) |
| 2-Person Household | 262 (93.9%) | 17 (6.1%) |
| 3-Person Household | 55 (83.3%) | 11 (16.7%) |
| 4+ Person Household | 43 (75.4%) | 14 (24.6%) |
| Total Housing Units | 469 (68.2%) | 219 (31.8%) |
Occupancy by Educational Attainment in Hurley
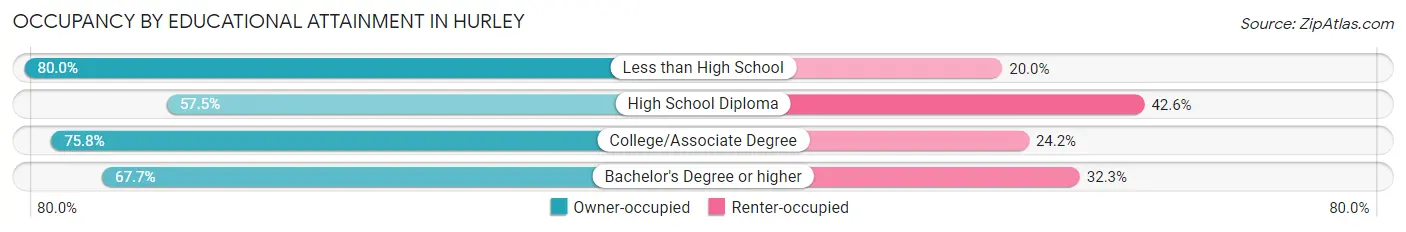
| Household Size | Owner-occupied | Renter-occupied |
| Less than High School | 24 (80.0%) | 6 (20.0%) |
| High School Diploma | 135 (57.5%) | 100 (42.5%) |
| College/Associate Degree | 222 (75.8%) | 71 (24.2%) |
| Bachelor's Degree or higher | 88 (67.7%) | 42 (32.3%) |
Occupancy by Age of Householder in Hurley
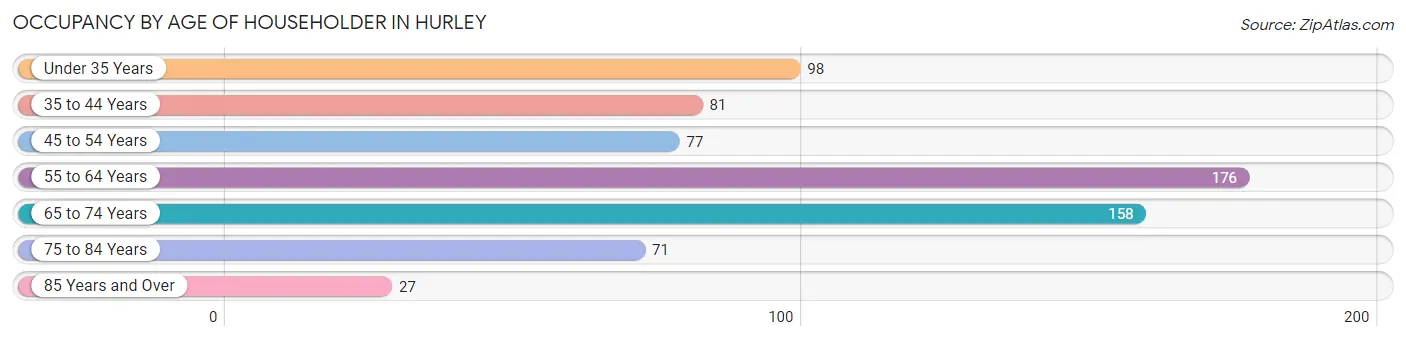
| Age Bracket | # Households | % Households |
| Under 35 Years | 98 | 14.2% |
| 35 to 44 Years | 81 | 11.8% |
| 45 to 54 Years | 77 | 11.2% |
| 55 to 64 Years | 176 | 25.6% |
| 65 to 74 Years | 158 | 23.0% |
| 75 to 84 Years | 71 | 10.3% |
| 85 Years and Over | 27 | 3.9% |
| Total | 688 | 100.0% |
Housing Finances in Hurley
Median Income by Occupancy in Hurley
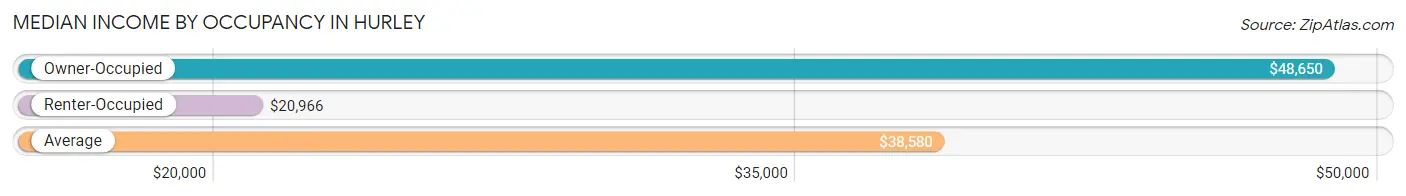
| Occupancy Type | # Households | Median Income |
| Owner-Occupied | 469 (68.2%) | $48,650 |
| Renter-Occupied | 219 (31.8%) | $20,966 |
| Average | 688 (100.0%) | $38,580 |
Occupancy by Householder Income Bracket in Hurley
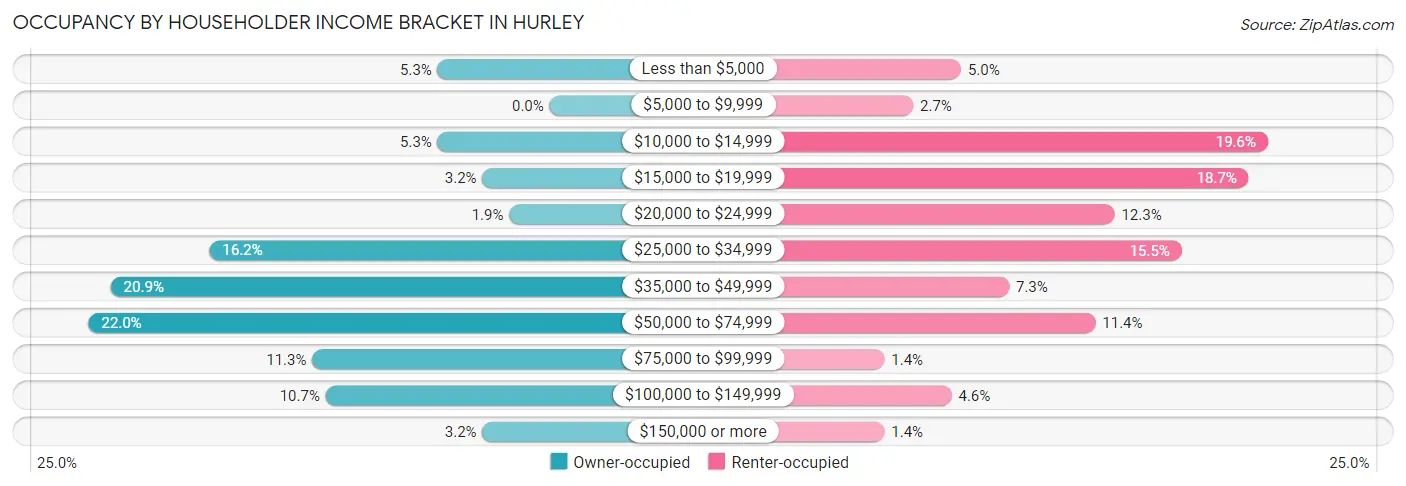
| Income Bracket | Owner-occupied | Renter-occupied |
| Less than $5,000 | 25 (5.3%) | 11 (5.0%) |
| $5,000 to $9,999 | 0 (0.0%) | 6 (2.7%) |
| $10,000 to $14,999 | 25 (5.3%) | 43 (19.6%) |
| $15,000 to $19,999 | 15 (3.2%) | 41 (18.7%) |
| $20,000 to $24,999 | 9 (1.9%) | 27 (12.3%) |
| $25,000 to $34,999 | 76 (16.2%) | 34 (15.5%) |
| $35,000 to $49,999 | 98 (20.9%) | 16 (7.3%) |
| $50,000 to $74,999 | 103 (22.0%) | 25 (11.4%) |
| $75,000 to $99,999 | 53 (11.3%) | 3 (1.4%) |
| $100,000 to $149,999 | 50 (10.7%) | 10 (4.6%) |
| $150,000 or more | 15 (3.2%) | 3 (1.4%) |
| Total | 469 (100.0%) | 219 (100.0%) |
Monthly Housing Cost Tiers in Hurley
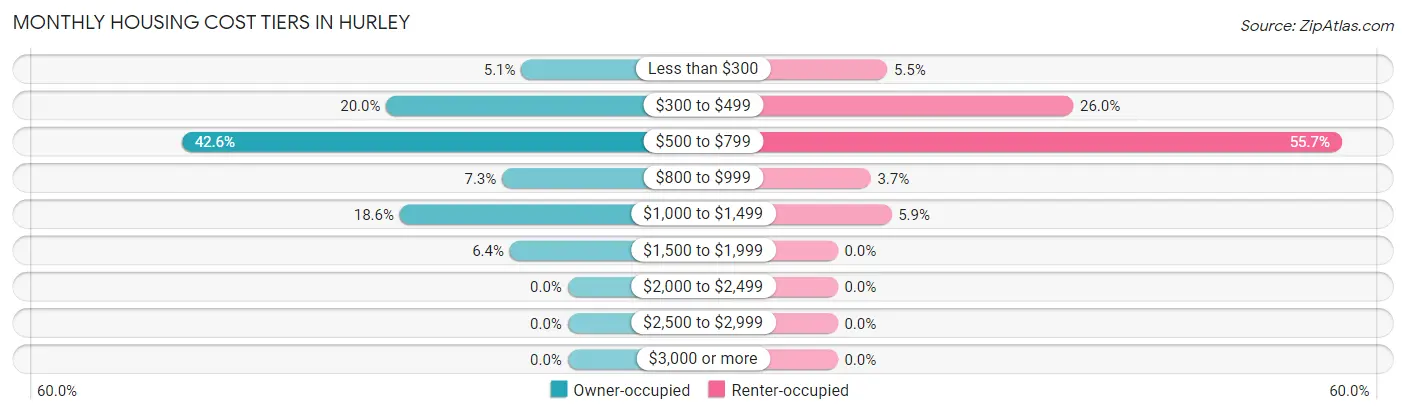
| Monthly Cost | Owner-occupied | Renter-occupied |
| Less than $300 | 24 (5.1%) | 12 (5.5%) |
| $300 to $499 | 94 (20.0%) | 57 (26.0%) |
| $500 to $799 | 200 (42.6%) | 122 (55.7%) |
| $800 to $999 | 34 (7.2%) | 8 (3.6%) |
| $1,000 to $1,499 | 87 (18.5%) | 13 (5.9%) |
| $1,500 to $1,999 | 30 (6.4%) | 0 (0.0%) |
| $2,000 to $2,499 | 0 (0.0%) | 0 (0.0%) |
| $2,500 to $2,999 | 0 (0.0%) | 0 (0.0%) |
| $3,000 or more | 0 (0.0%) | 0 (0.0%) |
| Total | 469 (100.0%) | 219 (100.0%) |
Physical Housing Characteristics in Hurley
Housing Structures in Hurley
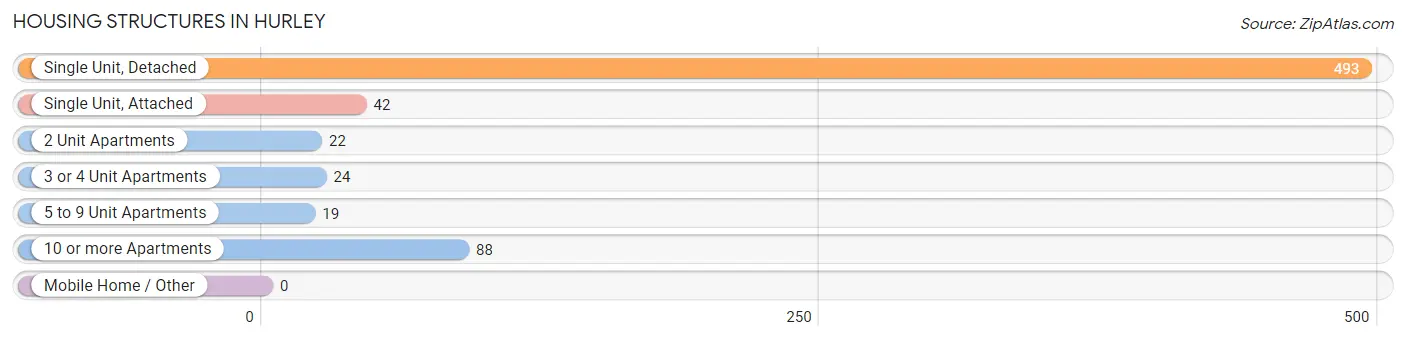
| Structure Type | # Housing Units | % Housing Units |
| Single Unit, Detached | 493 | 71.7% |
| Single Unit, Attached | 42 | 6.1% |
| 2 Unit Apartments | 22 | 3.2% |
| 3 or 4 Unit Apartments | 24 | 3.5% |
| 5 to 9 Unit Apartments | 19 | 2.8% |
| 10 or more Apartments | 88 | 12.8% |
| Mobile Home / Other | 0 | 0.0% |
| Total | 688 | 100.0% |
Housing Structures by Occupancy in Hurley
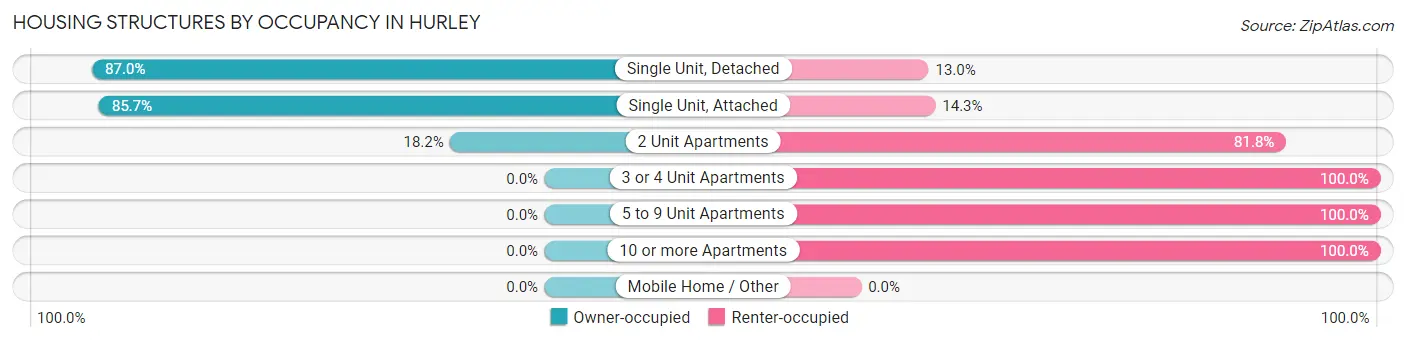
| Structure Type | Owner-occupied | Renter-occupied |
| Single Unit, Detached | 429 (87.0%) | 64 (13.0%) |
| Single Unit, Attached | 36 (85.7%) | 6 (14.3%) |
| 2 Unit Apartments | 4 (18.2%) | 18 (81.8%) |
| 3 or 4 Unit Apartments | 0 (0.0%) | 24 (100.0%) |
| 5 to 9 Unit Apartments | 0 (0.0%) | 19 (100.0%) |
| 10 or more Apartments | 0 (0.0%) | 88 (100.0%) |
| Mobile Home / Other | 0 (0.0%) | 0 (0.0%) |
| Total | 469 (68.2%) | 219 (31.8%) |
Housing Structures by Number of Rooms in Hurley
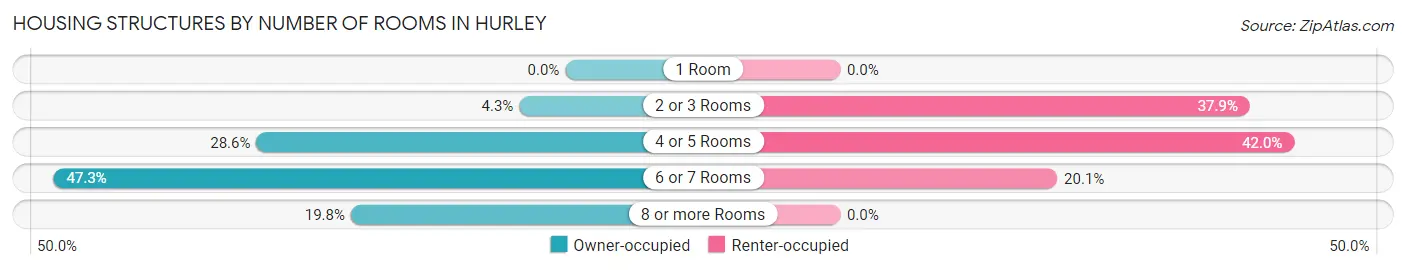
| Number of Rooms | Owner-occupied | Renter-occupied |
| 1 Room | 0 (0.0%) | 0 (0.0%) |
| 2 or 3 Rooms | 20 (4.3%) | 83 (37.9%) |
| 4 or 5 Rooms | 134 (28.6%) | 92 (42.0%) |
| 6 or 7 Rooms | 222 (47.3%) | 44 (20.1%) |
| 8 or more Rooms | 93 (19.8%) | 0 (0.0%) |
| Total | 469 (100.0%) | 219 (100.0%) |
Housing Structure by Heating Type in Hurley
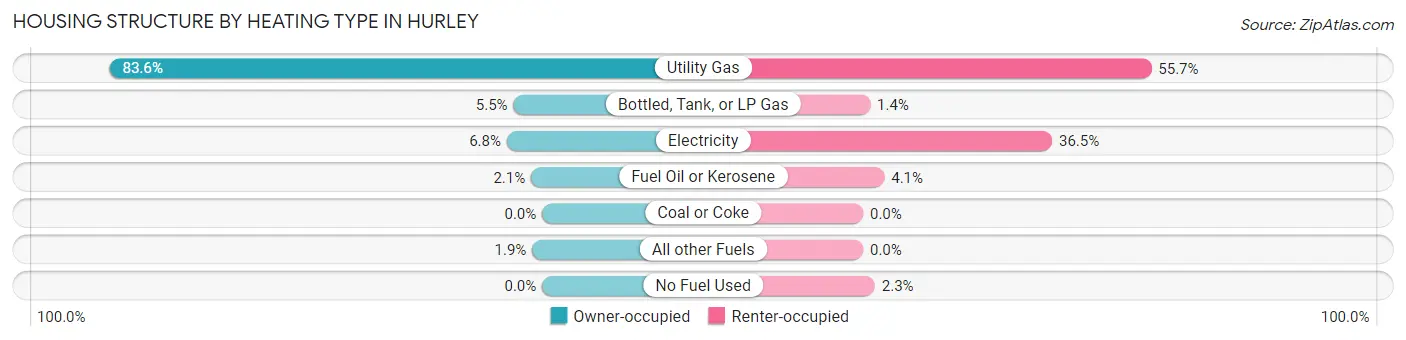
| Heating Type | Owner-occupied | Renter-occupied |
| Utility Gas | 392 (83.6%) | 122 (55.7%) |
| Bottled, Tank, or LP Gas | 26 (5.5%) | 3 (1.4%) |
| Electricity | 32 (6.8%) | 80 (36.5%) |
| Fuel Oil or Kerosene | 10 (2.1%) | 9 (4.1%) |
| Coal or Coke | 0 (0.0%) | 0 (0.0%) |
| All other Fuels | 9 (1.9%) | 0 (0.0%) |
| No Fuel Used | 0 (0.0%) | 5 (2.3%) |
| Total | 469 (100.0%) | 219 (100.0%) |
Household Vehicle Usage in Hurley
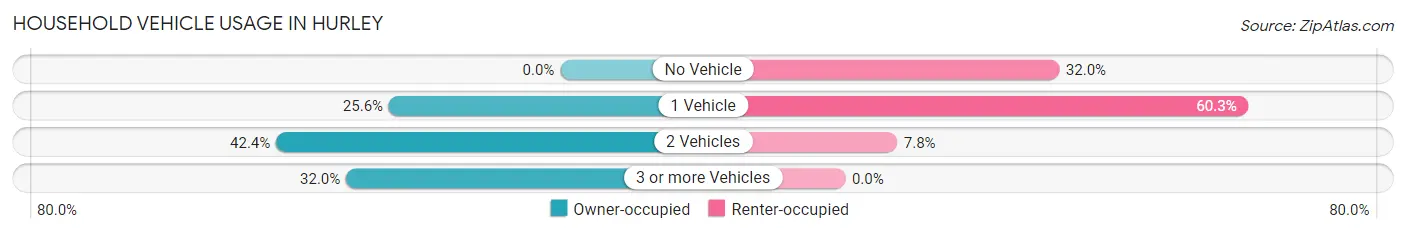
| Vehicles per Household | Owner-occupied | Renter-occupied |
| No Vehicle | 0 (0.0%) | 70 (32.0%) |
| 1 Vehicle | 120 (25.6%) | 132 (60.3%) |
| 2 Vehicles | 199 (42.4%) | 17 (7.8%) |
| 3 or more Vehicles | 150 (32.0%) | 0 (0.0%) |
| Total | 469 (100.0%) | 219 (100.0%) |
Real Estate & Mortgages in Hurley
Real Estate and Mortgage Overview in Hurley
| Characteristic | Without Mortgage | With Mortgage |
| Housing Units | 250 | 219 |
| Median Property Value | $67,100 | $59,200 |
| Median Household Income | $39,375 | $13 |
| Monthly Housing Costs | $508 | $0 |
| Real Estate Taxes | $1,383 | $0 |
Property Value by Mortgage Status in Hurley
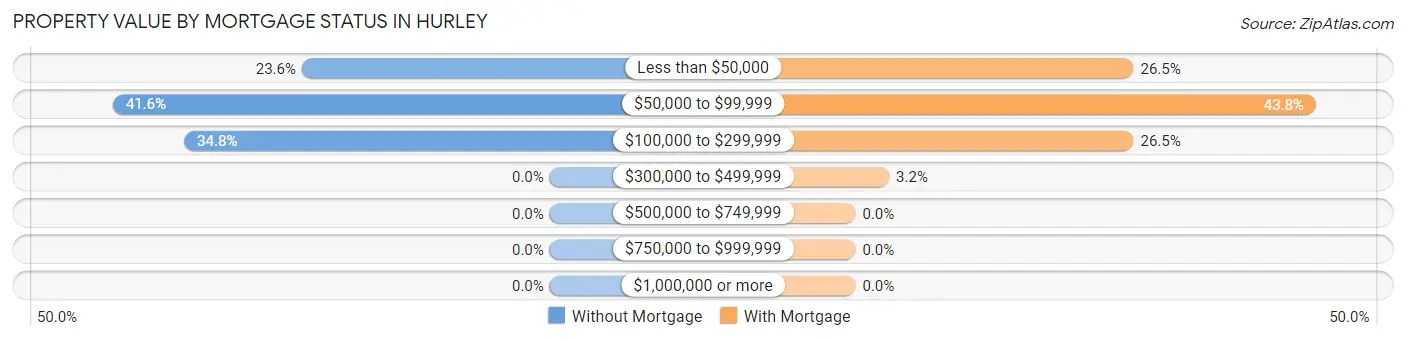
| Property Value | Without Mortgage | With Mortgage |
| Less than $50,000 | 59 (23.6%) | 58 (26.5%) |
| $50,000 to $99,999 | 104 (41.6%) | 96 (43.8%) |
| $100,000 to $299,999 | 87 (34.8%) | 58 (26.5%) |
| $300,000 to $499,999 | 0 (0.0%) | 7 (3.2%) |
| $500,000 to $749,999 | 0 (0.0%) | 0 (0.0%) |
| $750,000 to $999,999 | 0 (0.0%) | 0 (0.0%) |
| $1,000,000 or more | 0 (0.0%) | 0 (0.0%) |
| Total | 250 (100.0%) | 219 (100.0%) |
Household Income by Mortgage Status in Hurley
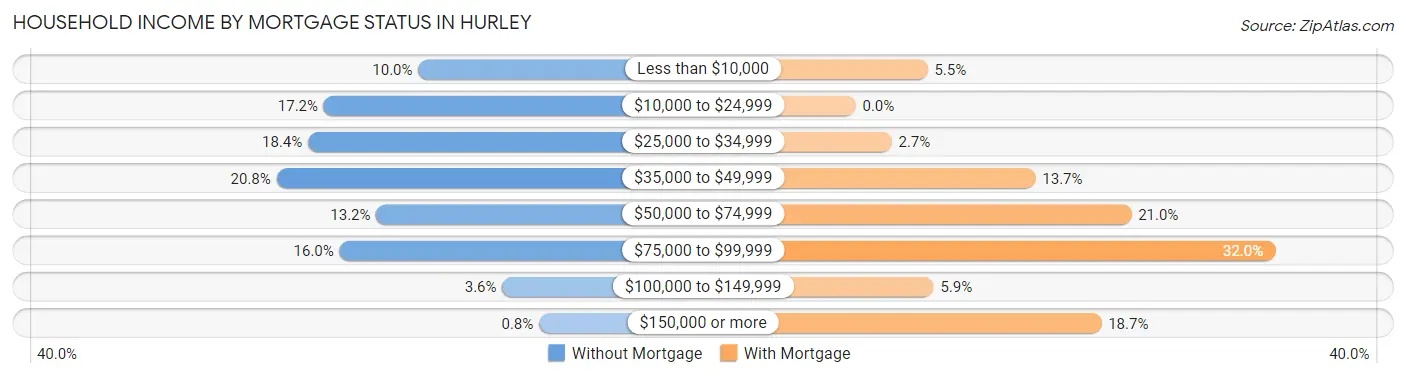
| Household Income | Without Mortgage | With Mortgage |
| Less than $10,000 | 25 (10.0%) | 12 (5.5%) |
| $10,000 to $24,999 | 43 (17.2%) | 0 (0.0%) |
| $25,000 to $34,999 | 46 (18.4%) | 6 (2.7%) |
| $35,000 to $49,999 | 52 (20.8%) | 30 (13.7%) |
| $50,000 to $74,999 | 33 (13.2%) | 46 (21.0%) |
| $75,000 to $99,999 | 40 (16.0%) | 70 (32.0%) |
| $100,000 to $149,999 | 9 (3.6%) | 13 (5.9%) |
| $150,000 or more | 2 (0.8%) | 41 (18.7%) |
| Total | 250 (100.0%) | 219 (100.0%) |
Property Value to Household Income Ratio in Hurley
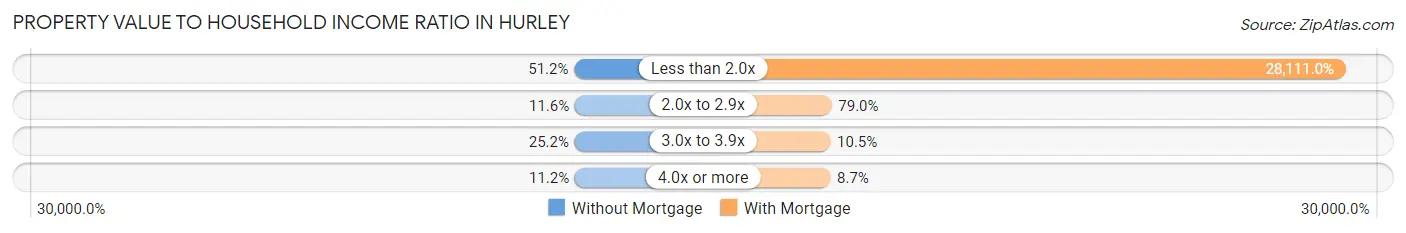
| Value-to-Income Ratio | Without Mortgage | With Mortgage |
| Less than 2.0x | 128 (51.2%) | 61,563 (28,111.0%) |
| 2.0x to 2.9x | 29 (11.6%) | 173 (79.0%) |
| 3.0x to 3.9x | 63 (25.2%) | 23 (10.5%) |
| 4.0x or more | 28 (11.2%) | 19 (8.7%) |
| Total | 250 (100.0%) | 219 (100.0%) |
Real Estate Taxes by Mortgage Status in Hurley
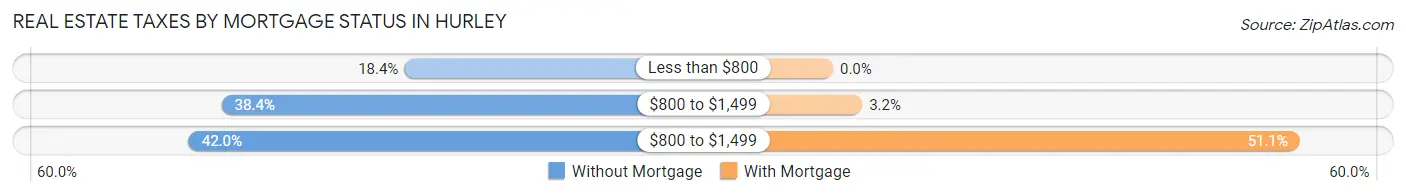
| Property Taxes | Without Mortgage | With Mortgage |
| Less than $800 | 46 (18.4%) | 0 (0.0%) |
| $800 to $1,499 | 96 (38.4%) | 7 (3.2%) |
| $800 to $1,499 | 105 (42.0%) | 112 (51.1%) |
| Total | 250 (100.0%) | 219 (100.0%) |
Health & Disability in Hurley
Health Insurance Coverage by Age in Hurley
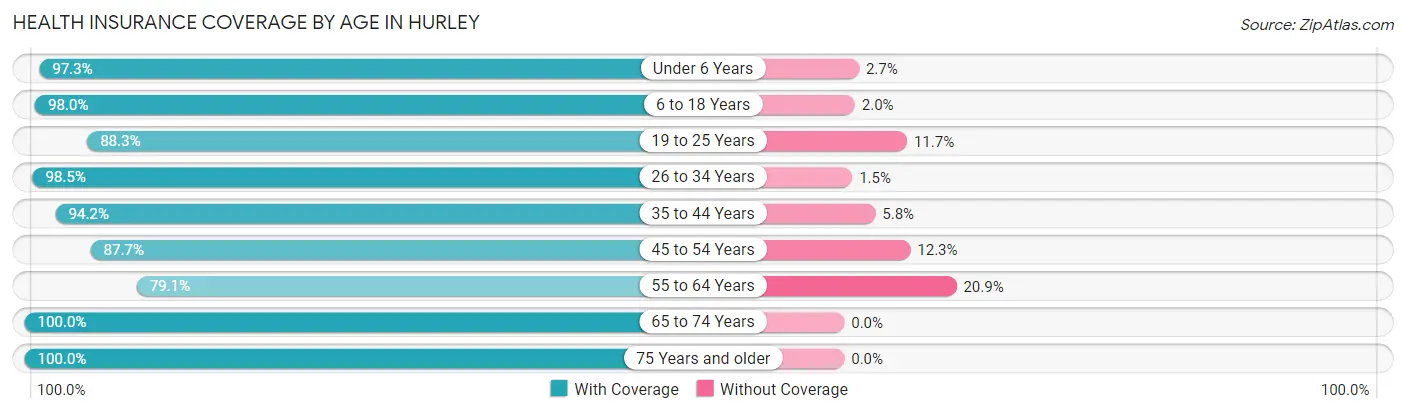
| Age Bracket | With Coverage | Without Coverage |
| Under 6 Years | 71 (97.3%) | 2 (2.7%) |
| 6 to 18 Years | 150 (98.0%) | 3 (2.0%) |
| 19 to 25 Years | 68 (88.3%) | 9 (11.7%) |
| 26 to 34 Years | 133 (98.5%) | 2 (1.5%) |
| 35 to 44 Years | 114 (94.2%) | 7 (5.8%) |
| 45 to 54 Years | 121 (87.7%) | 17 (12.3%) |
| 55 to 64 Years | 189 (79.1%) | 50 (20.9%) |
| 65 to 74 Years | 222 (100.0%) | 0 (0.0%) |
| 75 Years and older | 145 (100.0%) | 0 (0.0%) |
| Total | 1,213 (93.1%) | 90 (6.9%) |
Health Insurance Coverage by Citizenship Status in Hurley
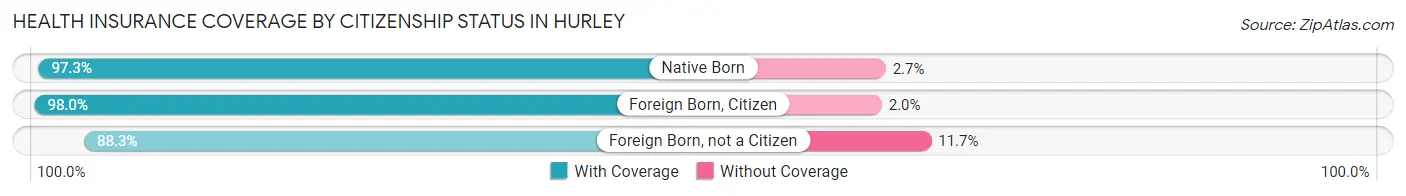
| Citizenship Status | With Coverage | Without Coverage |
| Native Born | 71 (97.3%) | 2 (2.7%) |
| Foreign Born, Citizen | 150 (98.0%) | 3 (2.0%) |
| Foreign Born, not a Citizen | 68 (88.3%) | 9 (11.7%) |
Health Insurance Coverage by Household Income in Hurley
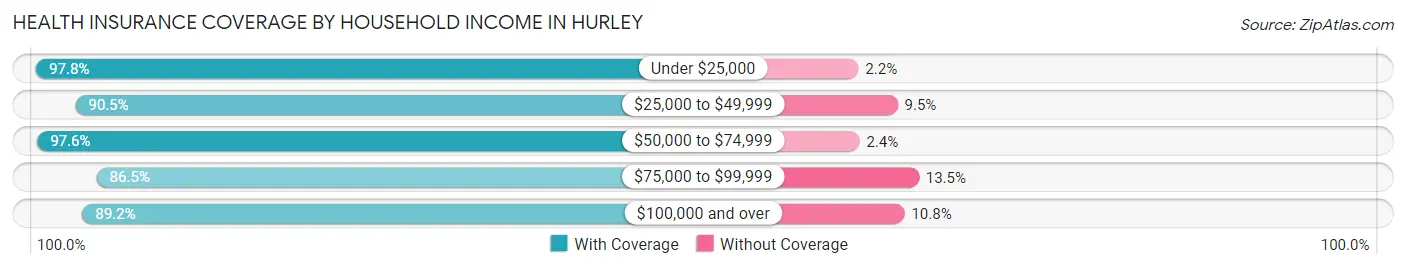
| Household Income | With Coverage | Without Coverage |
| Under $25,000 | 271 (97.8%) | 6 (2.2%) |
| $25,000 to $49,999 | 380 (90.5%) | 40 (9.5%) |
| $50,000 to $74,999 | 288 (97.6%) | 7 (2.4%) |
| $75,000 to $99,999 | 109 (86.5%) | 17 (13.5%) |
| $100,000 and over | 165 (89.2%) | 20 (10.8%) |
Public vs Private Health Insurance Coverage by Age in Hurley
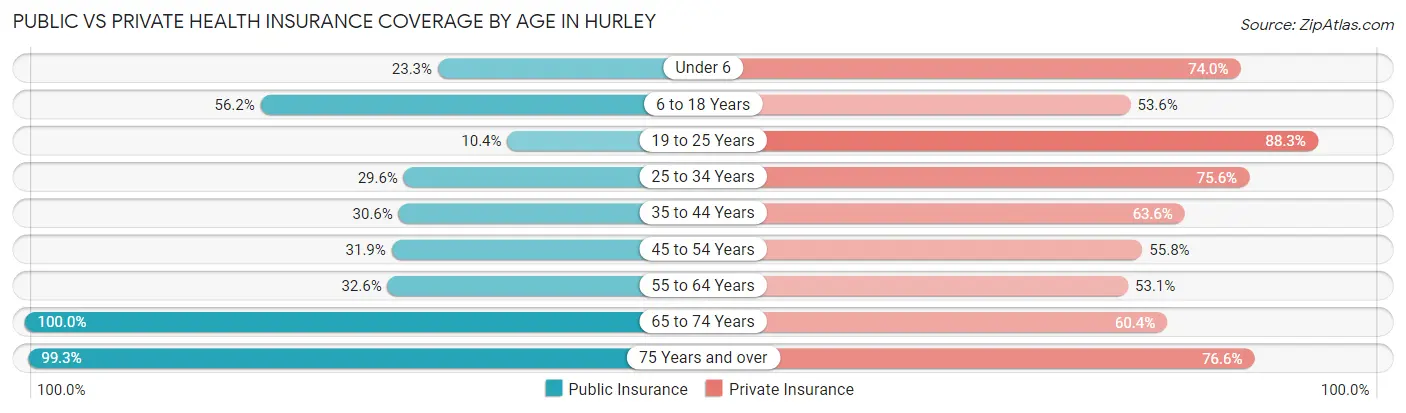
| Age Bracket | Public Insurance | Private Insurance |
| Under 6 | 17 (23.3%) | 54 (74.0%) |
| 6 to 18 Years | 86 (56.2%) | 82 (53.6%) |
| 19 to 25 Years | 8 (10.4%) | 68 (88.3%) |
| 25 to 34 Years | 40 (29.6%) | 102 (75.6%) |
| 35 to 44 Years | 37 (30.6%) | 77 (63.6%) |
| 45 to 54 Years | 44 (31.9%) | 77 (55.8%) |
| 55 to 64 Years | 78 (32.6%) | 127 (53.1%) |
| 65 to 74 Years | 222 (100.0%) | 134 (60.4%) |
| 75 Years and over | 144 (99.3%) | 111 (76.5%) |
| Total | 676 (51.9%) | 832 (63.8%) |
Disability Status by Sex by Age in Hurley
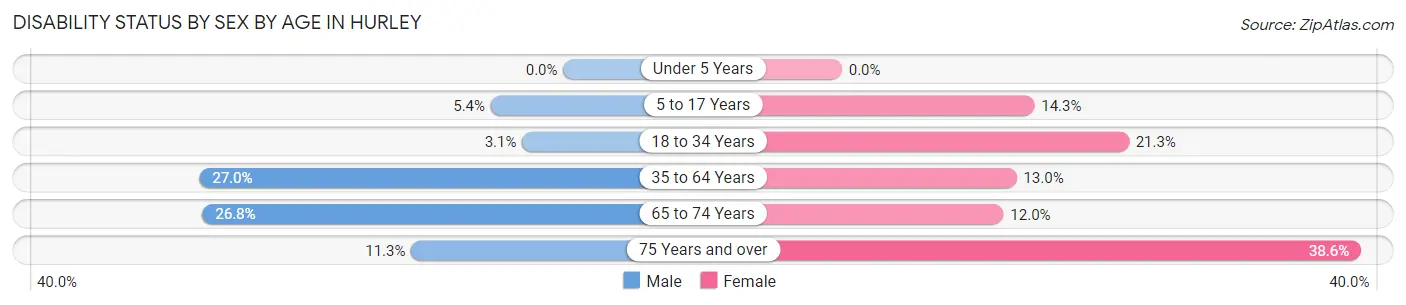
| Age Bracket | Male | Female |
| Under 5 Years | 0 (0.0%) | 0 (0.0%) |
| 5 to 17 Years | 5 (5.4%) | 6 (14.3%) |
| 18 to 34 Years | 4 (3.0%) | 23 (21.3%) |
| 35 to 64 Years | 70 (27.0%) | 31 (13.0%) |
| 65 to 74 Years | 26 (26.8%) | 15 (12.0%) |
| 75 Years and over | 7 (11.3%) | 32 (38.6%) |
Disability Class by Sex by Age in Hurley
Disability Class: Hearing Difficulty
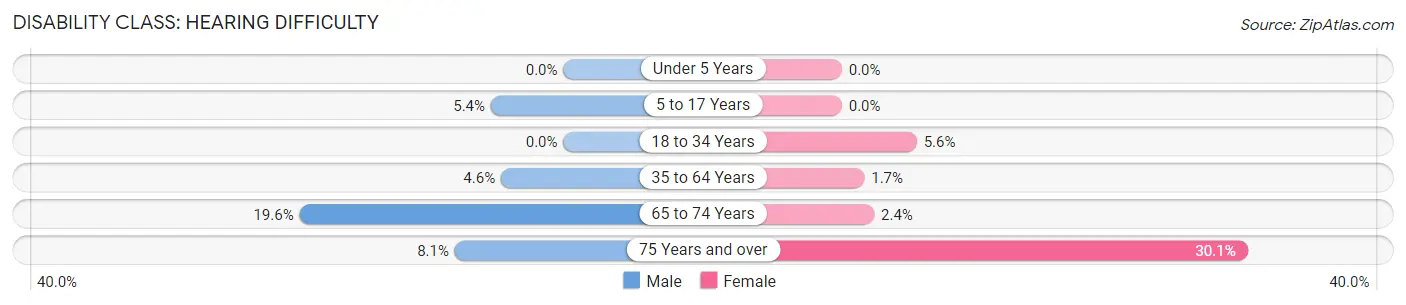
| Age Bracket | Male | Female |
| Under 5 Years | 0 (0.0%) | 0 (0.0%) |
| 5 to 17 Years | 5 (5.4%) | 0 (0.0%) |
| 18 to 34 Years | 0 (0.0%) | 6 (5.6%) |
| 35 to 64 Years | 12 (4.6%) | 4 (1.7%) |
| 65 to 74 Years | 19 (19.6%) | 3 (2.4%) |
| 75 Years and over | 5 (8.1%) | 25 (30.1%) |
Disability Class: Vision Difficulty
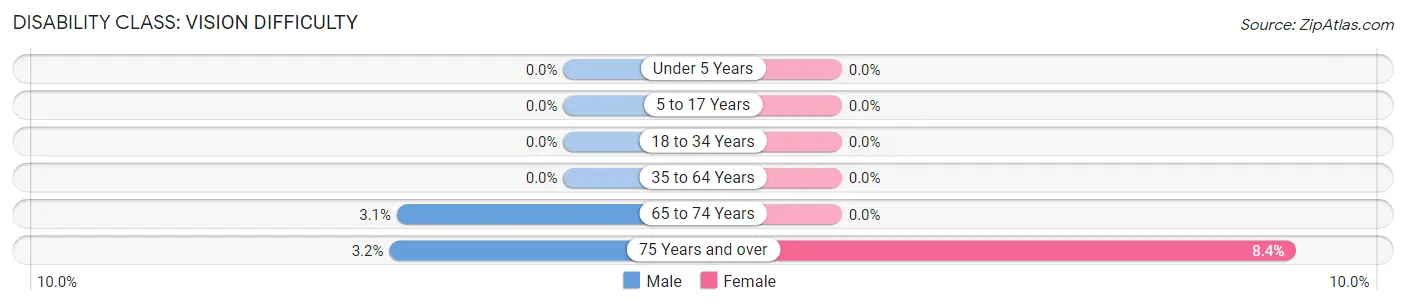
| Age Bracket | Male | Female |
| Under 5 Years | 0 (0.0%) | 0 (0.0%) |
| 5 to 17 Years | 0 (0.0%) | 0 (0.0%) |
| 18 to 34 Years | 0 (0.0%) | 0 (0.0%) |
| 35 to 64 Years | 0 (0.0%) | 0 (0.0%) |
| 65 to 74 Years | 3 (3.1%) | 0 (0.0%) |
| 75 Years and over | 2 (3.2%) | 7 (8.4%) |
Disability Class: Cognitive Difficulty

| Age Bracket | Male | Female |
| 5 to 17 Years | 0 (0.0%) | 6 (14.3%) |
| 18 to 34 Years | 4 (3.0%) | 15 (13.9%) |
| 35 to 64 Years | 17 (6.6%) | 11 (4.6%) |
| 65 to 74 Years | 7 (7.2%) | 4 (3.2%) |
| 75 Years and over | 0 (0.0%) | 3 (3.6%) |
Disability Class: Ambulatory Difficulty
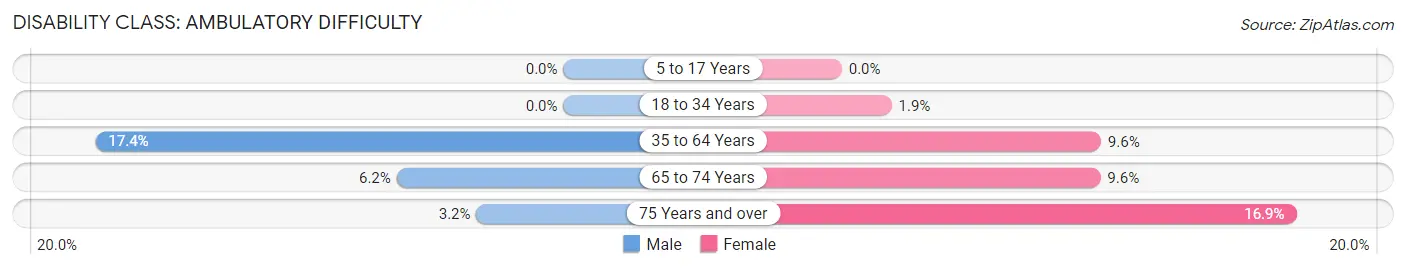
| Age Bracket | Male | Female |
| 5 to 17 Years | 0 (0.0%) | 0 (0.0%) |
| 18 to 34 Years | 0 (0.0%) | 2 (1.8%) |
| 35 to 64 Years | 45 (17.4%) | 23 (9.6%) |
| 65 to 74 Years | 6 (6.2%) | 12 (9.6%) |
| 75 Years and over | 2 (3.2%) | 14 (16.9%) |
Disability Class: Self-Care Difficulty
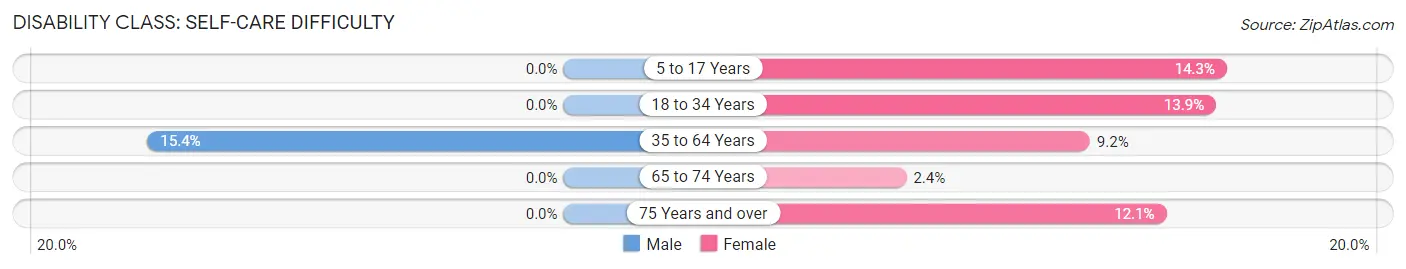
| Age Bracket | Male | Female |
| 5 to 17 Years | 0 (0.0%) | 6 (14.3%) |
| 18 to 34 Years | 0 (0.0%) | 15 (13.9%) |
| 35 to 64 Years | 40 (15.4%) | 22 (9.2%) |
| 65 to 74 Years | 0 (0.0%) | 3 (2.4%) |
| 75 Years and over | 0 (0.0%) | 10 (12.0%) |
Technology Access in Hurley
Computing Device Access in Hurley
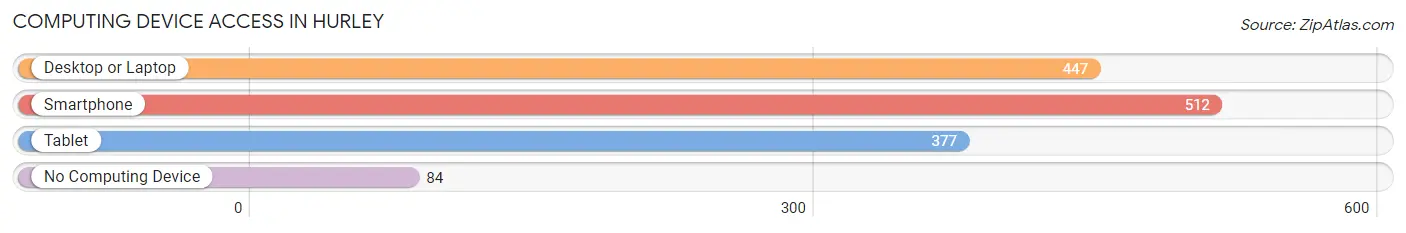
| Device Type | # Households | % Households |
| Desktop or Laptop | 447 | 65.0% |
| Smartphone | 512 | 74.4% |
| Tablet | 377 | 54.8% |
| No Computing Device | 84 | 12.2% |
| Total | 688 | 100.0% |
Internet Access in Hurley
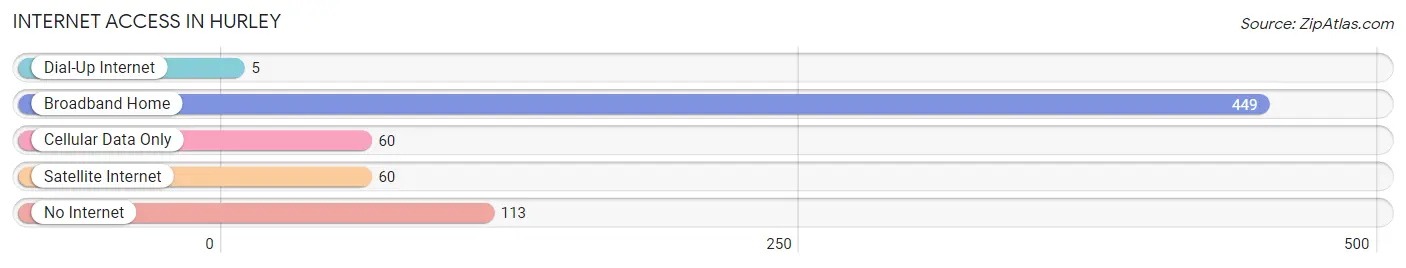
| Internet Type | # Households | % Households |
| Dial-Up Internet | 5 | 0.7% |
| Broadband Home | 449 | 65.3% |
| Cellular Data Only | 60 | 8.7% |
| Satellite Internet | 60 | 8.7% |
| No Internet | 113 | 16.4% |
| Total | 688 | 100.0% |
Hurley Summary
Hurley, Wisconsin is a small city located in Iron County, Wisconsin, United States. It is situated on the Montreal River, which forms the border between Wisconsin and Michigan's Upper Peninsula. The city is the county seat of Iron County and is the largest city in the county. As of the 2010 census, the city had a population of 1,541.
History
The area that is now Hurley was first settled in the late 1800s by miners and loggers. The city was officially incorporated in 1885 and was named after William Hurley, a prominent local businessman. The city quickly grew as a center of the mining industry, and by the early 1900s, it was the largest city in Iron County.
In the early 1900s, the city was home to a large number of immigrants from Finland, Sweden, and other parts of Europe. This influx of immigrants helped to shape the culture of the city and gave it a unique character.
Geography
Hurley is located in the northwest corner of Wisconsin, near the border with Michigan's Upper Peninsula. The city is situated on the Montreal River, which forms the border between the two states. The city is located in a heavily forested area, and the surrounding area is known for its lakes and rivers.
The city has a total area of 2.2 square miles, all of which is land. The city is located at an elevation of 1,541 feet above sea level.
Economy
The economy of Hurley is largely based on the mining industry. The city is home to several large mining companies, including the Iron County Mining Company and the Hurley Mining Company. The city is also home to several small businesses, including restaurants, retail stores, and other services.
The city is also home to a number of tourist attractions, including the Iron County Historical Museum, the Iron County Mining Museum, and the Hurley Mining Museum. The city is also home to a number of outdoor recreation areas, including the Montreal River State Wildlife Area and the Iron County Forest.
Demographics
As of the 2010 census, the city had a population of 1,541. The racial makeup of the city was 95.2% White, 0.7% African American, 0.7% Native American, 0.3% Asian, 0.1% Pacific Islander, 1.2% from other races, and 1.8% from two or more races. Hispanic or Latino of any race were 3.2% of the population.
The median income for a household in the city was $35,938, and the median income for a family was $41,250. The per capita income for the city was $17,945. About 14.2% of families and 17.2% of the population were below the poverty line, including 24.2% of those under age 18 and 8.3% of those age 65 or over.
Common Questions
What is Per Capita Income in Hurley?
Per Capita income in Hurley is $28,474.
What is the Median Family Income in Hurley?
Median Family Income in Hurley is $59,844.
What is the Median Household income in Hurley?
Median Household Income in Hurley is $38,580.
What is Income or Wage Gap in Hurley?
Income or Wage Gap in Hurley is 11.5%.
Women in Hurley earn 88.5 cents for every dollar earned by a man.
What is Inequality or Gini Index in Hurley?
Inequality or Gini Index in Hurley is 0.45.
What is the Total Population of Hurley?
Total Population of Hurley is 1,405.
What is the Total Male Population of Hurley?
Total Male Population of Hurley is 705.
What is the Total Female Population of Hurley?
Total Female Population of Hurley is 700.
What is the Ratio of Males per 100 Females in Hurley?
There are 100.71 Males per 100 Females in Hurley.
What is the Ratio of Females per 100 Males in Hurley?
There are 99.29 Females per 100 Males in Hurley.
What is the Median Population Age in Hurley?
Median Population Age in Hurley is 54.5 Years.
What is the Average Family Size in Hurley
Average Family Size in Hurley is 2.7 People.
What is the Average Household Size in Hurley
Average Household Size in Hurley is 1.9 People.
How Large is the Labor Force in Hurley?
There are 634 People in the Labor Forcein in Hurley.
What is the Percentage of People in the Labor Force in Hurley?
51.7% of People are in the Labor Force in Hurley.
What is the Unemployment Rate in Hurley?
Unemployment Rate in Hurley is 6.2%.