Windsor, WI Map & Demographics
Windsor Map
Windsor Overview
$48,087
PER CAPITA INCOME
$142,750
AVG FAMILY INCOME
$110,000
AVG HOUSEHOLD INCOME
26.6%
WAGE / INCOME GAP [ % ]
73.4¢/ $1
WAGE / INCOME GAP [ $ ]
0.39
INEQUALITY / GINI INDEX
8,756
TOTAL POPULATION
4,127
MALE POPULATION
4,629
FEMALE POPULATION
89.16
MALES / 100 FEMALES
112.16
FEMALES / 100 MALES
38.5
MEDIAN AGE
3.3
AVG FAMILY SIZE
2.8
AVG HOUSEHOLD SIZE
5,183
LABOR FORCE [ PEOPLE ]
77.0%
PERCENT IN LABOR FORCE
2.0%
UNEMPLOYMENT RATE
Windsor Zip Codes
Windsor Area Codes
Income in Windsor
Income Overview in Windsor
Per Capita Income in Windsor is $48,087, while median incomes of families and households are $142,750 and $110,000 respectively.
| Characteristic | Number | Measure |
| Per Capita Income | 8,756 | $48,087 |
| Median Family Income | 2,265 | $142,750 |
| Mean Family Income | 2,265 | $154,688 |
| Median Household Income | 3,186 | $110,000 |
| Mean Household Income | 3,186 | $128,672 |
| Income Deficit | 2,265 | $0 |
| Wage / Income Gap (%) | 8,756 | 26.57% |
| Wage / Income Gap ($) | 8,756 | 73.43¢ per $1 |
| Gini / Inequality Index | 8,756 | 0.39 |
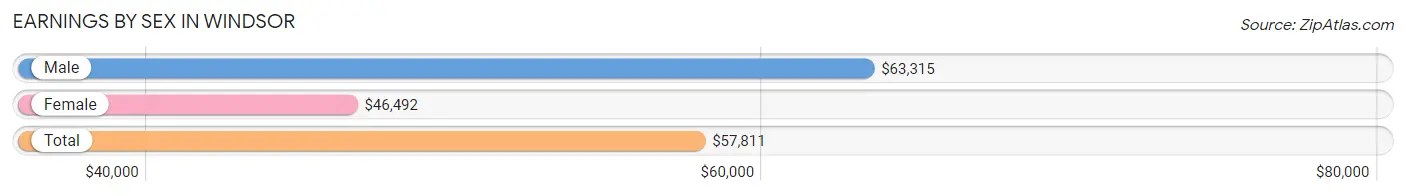
Earnings by Sex in Windsor
Average Earnings in Windsor are $57,811, $63,315 for men and $46,492 for women, a difference of 26.6%.
| Sex | Number | Average Earnings |
| Male | 2,642 (50.2%) | $63,315 |
| Female | 2,616 (49.7%) | $46,492 |
| Total | 5,258 (100.0%) | $57,811 |
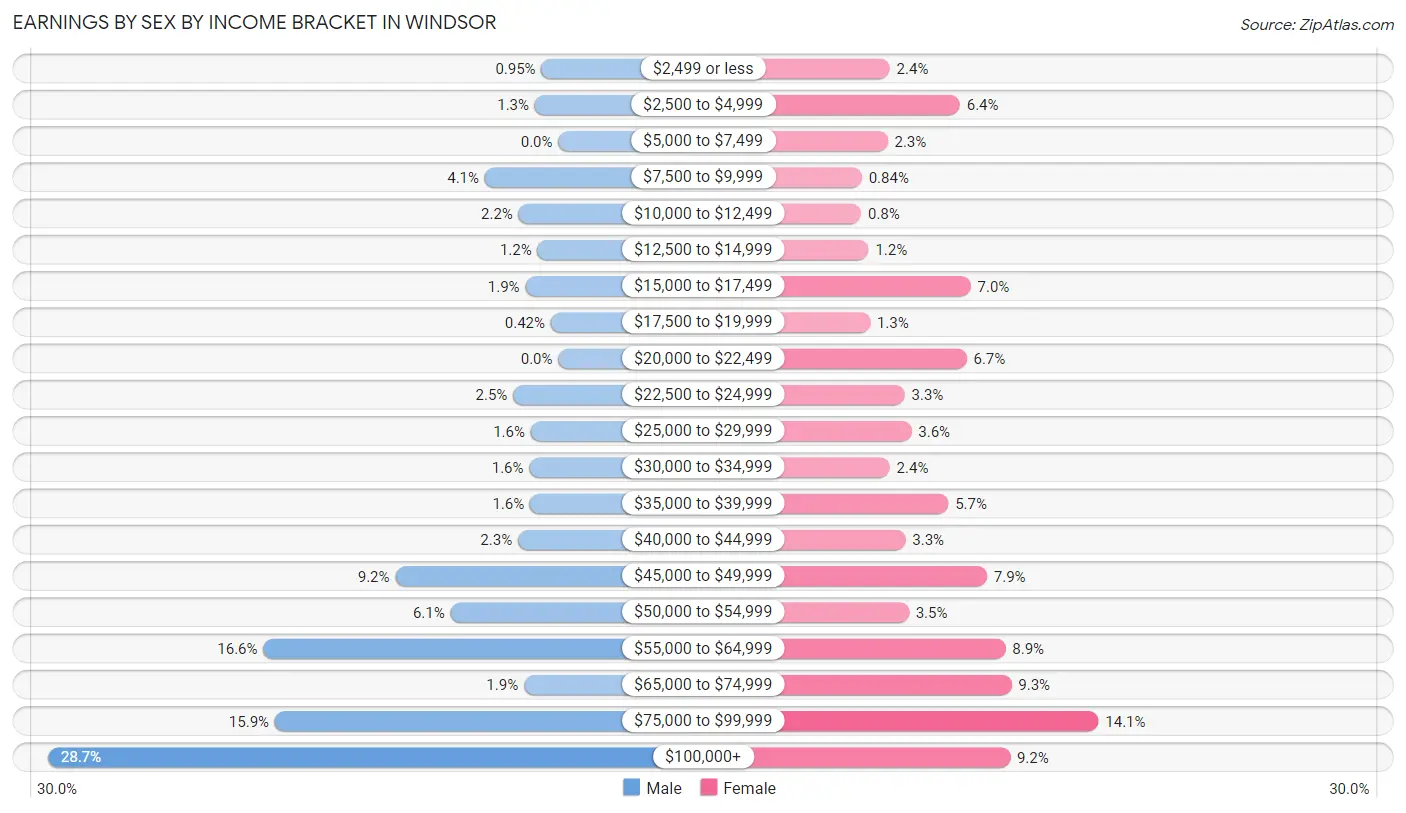
Earnings by Sex by Income Bracket in Windsor
The most common earnings brackets in Windsor are $100,000+ for men (758 | 28.7%) and $75,000 to $99,999 for women (370 | 14.1%).
| Income | Male | Female |
| $2,499 or less | 25 (0.9%) | 63 (2.4%) |
| $2,500 to $4,999 | 35 (1.3%) | 166 (6.4%) |
| $5,000 to $7,499 | 0 (0.0%) | 60 (2.3%) |
| $7,500 to $9,999 | 109 (4.1%) | 22 (0.8%) |
| $10,000 to $12,499 | 59 (2.2%) | 21 (0.8%) |
| $12,500 to $14,999 | 31 (1.2%) | 32 (1.2%) |
| $15,000 to $17,499 | 49 (1.8%) | 182 (7.0%) |
| $17,500 to $19,999 | 11 (0.4%) | 34 (1.3%) |
| $20,000 to $22,499 | 0 (0.0%) | 176 (6.7%) |
| $22,500 to $24,999 | 67 (2.5%) | 85 (3.3%) |
| $25,000 to $29,999 | 41 (1.5%) | 95 (3.6%) |
| $30,000 to $34,999 | 43 (1.6%) | 63 (2.4%) |
| $35,000 to $39,999 | 42 (1.6%) | 149 (5.7%) |
| $40,000 to $44,999 | 60 (2.3%) | 86 (3.3%) |
| $45,000 to $49,999 | 242 (9.2%) | 206 (7.9%) |
| $50,000 to $54,999 | 160 (6.1%) | 91 (3.5%) |
| $55,000 to $64,999 | 438 (16.6%) | 233 (8.9%) |
| $65,000 to $74,999 | 51 (1.9%) | 242 (9.2%) |
| $75,000 to $99,999 | 421 (15.9%) | 370 (14.1%) |
| $100,000+ | 758 (28.7%) | 240 (9.2%) |
| Total | 2,642 (100.0%) | 2,616 (100.0%) |
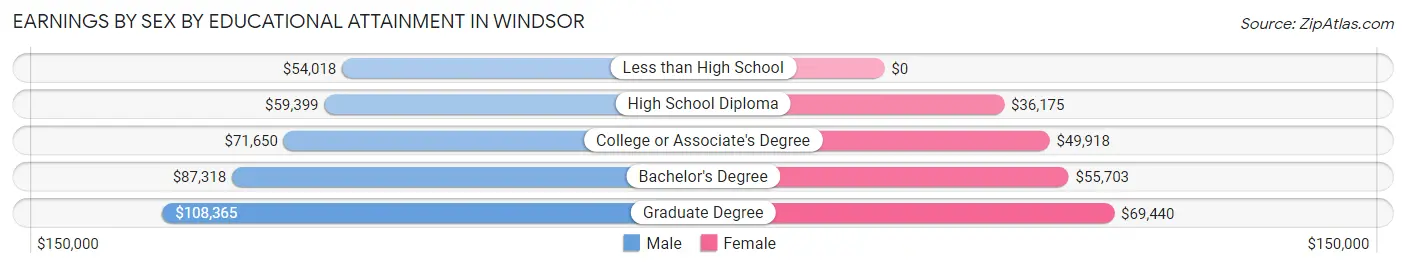
Earnings by Sex by Educational Attainment in Windsor
Average earnings in Windsor are $70,329 for men and $54,000 for women, a difference of 23.2%. Men with an educational attainment of graduate degree enjoy the highest average annual earnings of $108,365, while those with less than high school education earn the least with $54,018. Women with an educational attainment of graduate degree earn the most with the average annual earnings of $69,440, while those with high school diploma education have the smallest earnings of $36,175.
| Educational Attainment | Male Income | Female Income |
| Less than High School | $54,018 | $0 |
| High School Diploma | $59,399 | $36,175 |
| College or Associate's Degree | $71,650 | $49,918 |
| Bachelor's Degree | $87,318 | $55,703 |
| Graduate Degree | $108,365 | $69,440 |
| Total | $70,329 | $54,000 |
Family Income in Windsor
Family Income Brackets in Windsor
According to the Windsor family income data, there are 557 families falling into the $100,000 to $149,999 income range, which is the most common income bracket and makes up 24.6% of all families. Conversely, the $15,000 to $24,999 income bracket is the least frequent group with only 23 families (1.0%) belonging to this category.
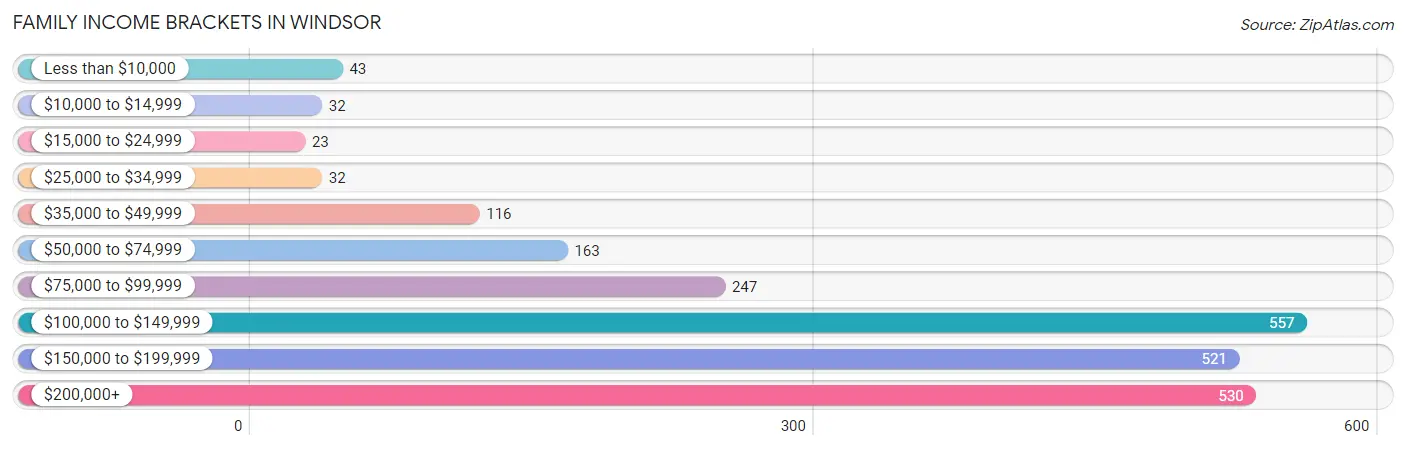
| Income Bracket | # Families | % Families |
| Less than $10,000 | 43 | 1.9% |
| $10,000 to $14,999 | 32 | 1.4% |
| $15,000 to $24,999 | 23 | 1.0% |
| $25,000 to $34,999 | 32 | 1.4% |
| $35,000 to $49,999 | 116 | 5.1% |
| $50,000 to $74,999 | 163 | 7.2% |
| $75,000 to $99,999 | 247 | 10.9% |
| $100,000 to $149,999 | 557 | 24.6% |
| $150,000 to $199,999 | 521 | 23.0% |
| $200,000+ | 530 | 23.4% |
Family Income by Famaliy Size in Windsor
5-person families (143 | 6.3%) account for the highest median family income in Windsor with $170,179 per family, while 2-person families (811 | 35.8%) have the highest median income of $56,612 per family member.
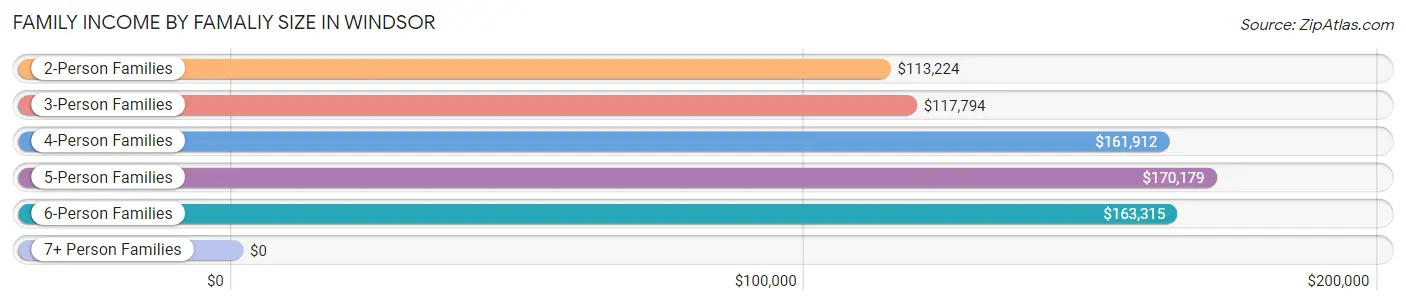
| Income Bracket | # Families | Median Income |
| 2-Person Families | 811 (35.8%) | $113,224 |
| 3-Person Families | 586 (25.9%) | $117,794 |
| 4-Person Families | 642 (28.3%) | $161,912 |
| 5-Person Families | 143 (6.3%) | $170,179 |
| 6-Person Families | 73 (3.2%) | $163,315 |
| 7+ Person Families | 10 (0.4%) | $0 |
| Total | 2,265 (100.0%) | $142,750 |
Family Income by Number of Earners in Windsor
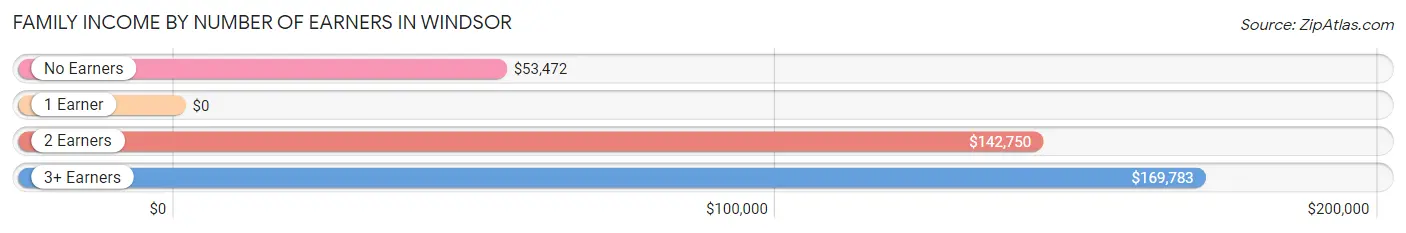
| Number of Earners | # Families | Median Income |
| No Earners | 290 (12.8%) | $53,472 |
| 1 Earner | 393 (17.3%) | $0 |
| 2 Earners | 1,054 (46.5%) | $142,750 |
| 3+ Earners | 528 (23.3%) | $169,783 |
| Total | 2,265 (100.0%) | $142,750 |
Household Income in Windsor
Household Income Brackets in Windsor
With 653 households falling in the category, the $100,000 to $149,999 income range is the most frequent in Windsor, accounting for 20.5% of all households. In contrast, only 32 households (1.0%) fall into the $10,000 to $14,999 income bracket, making it the least populous group.
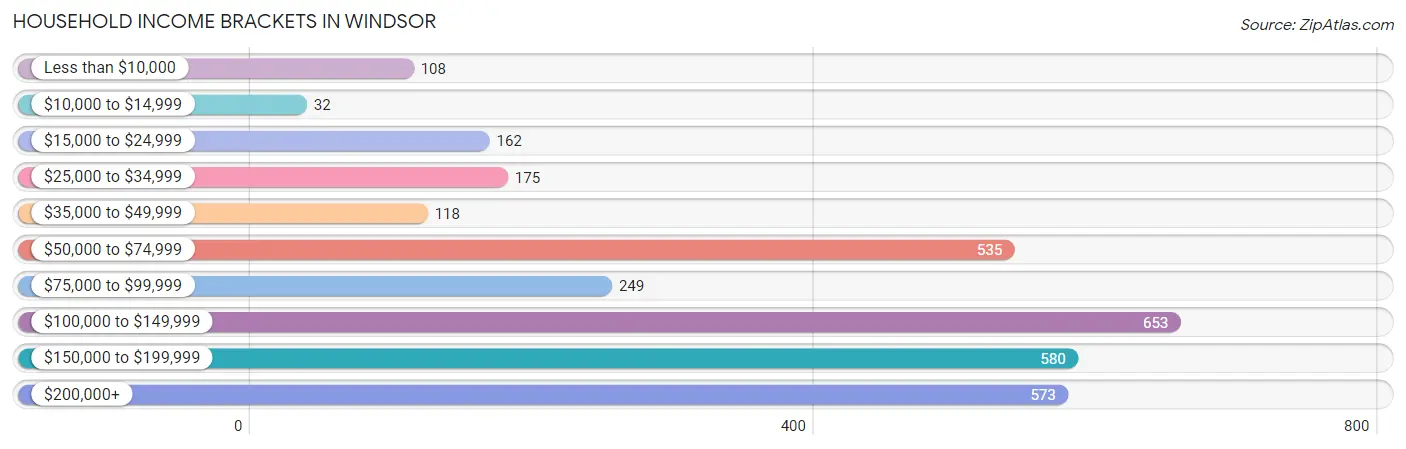
| Income Bracket | # Households | % Households |
| Less than $10,000 | 108 | 3.4% |
| $10,000 to $14,999 | 32 | 1.0% |
| $15,000 to $24,999 | 162 | 5.1% |
| $25,000 to $34,999 | 175 | 5.5% |
| $35,000 to $49,999 | 118 | 3.7% |
| $50,000 to $74,999 | 535 | 16.8% |
| $75,000 to $99,999 | 249 | 7.8% |
| $100,000 to $149,999 | 653 | 20.5% |
| $150,000 to $199,999 | 580 | 18.2% |
| $200,000+ | 573 | 18.0% |
Household Income by Householder Age in Windsor
The median household income in Windsor is $110,000, with the highest median household income of $145,625 found in the 45 to 64 years age bracket for the primary householder. A total of 1,159 households (36.4%) fall into this category. Meanwhile, the 15 to 24 years age bracket for the primary householder has the lowest median household income of $0, with 144 households (4.5%) in this group.
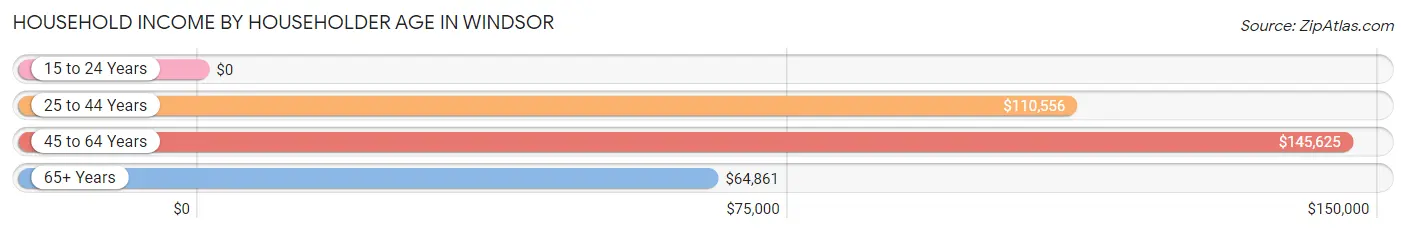
| Income Bracket | # Households | Median Income |
| 15 to 24 Years | 144 (4.5%) | $0 |
| 25 to 44 Years | 1,192 (37.4%) | $110,556 |
| 45 to 64 Years | 1,159 (36.4%) | $145,625 |
| 65+ Years | 691 (21.7%) | $64,861 |
| Total | 3,186 (100.0%) | $110,000 |
Poverty in Windsor
Income Below Poverty by Sex and Age in Windsor
With 5.6% poverty level for males and 7.4% for females among the residents of Windsor, 12 to 14 year old males and 6 to 11 year old females are the most vulnerable to poverty, with 33 males (27.1%) and 72 females (16.3%) in their respective age groups living below the poverty level.
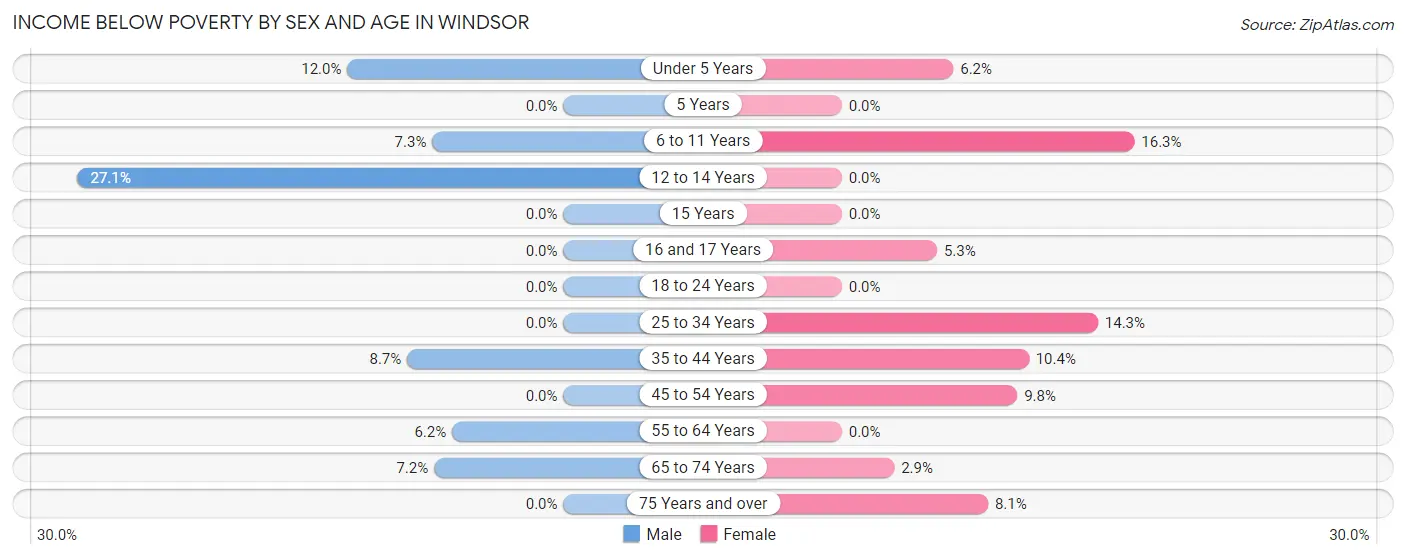
| Age Bracket | Male | Female |
| Under 5 Years | 38 (12.0%) | 21 (6.2%) |
| 5 Years | 0 (0.0%) | 0 (0.0%) |
| 6 to 11 Years | 33 (7.3%) | 72 (16.3%) |
| 12 to 14 Years | 33 (27.1%) | 0 (0.0%) |
| 15 Years | 0 (0.0%) | 0 (0.0%) |
| 16 and 17 Years | 0 (0.0%) | 7 (5.3%) |
| 18 to 24 Years | 0 (0.0%) | 0 (0.0%) |
| 25 to 34 Years | 0 (0.0%) | 85 (14.3%) |
| 35 to 44 Years | 67 (8.7%) | 79 (10.4%) |
| 45 to 54 Years | 0 (0.0%) | 39 (9.8%) |
| 55 to 64 Years | 33 (6.2%) | 0 (0.0%) |
| 65 to 74 Years | 25 (7.2%) | 11 (2.9%) |
| 75 Years and over | 0 (0.0%) | 31 (8.1%) |
| Total | 229 (5.6%) | 345 (7.4%) |
Income Above Poverty by Sex and Age in Windsor
According to the poverty statistics in Windsor, males aged 5 years and females aged 5 years are the age groups that are most secure financially, with 100.0% of males and 100.0% of females in these age groups living above the poverty line.
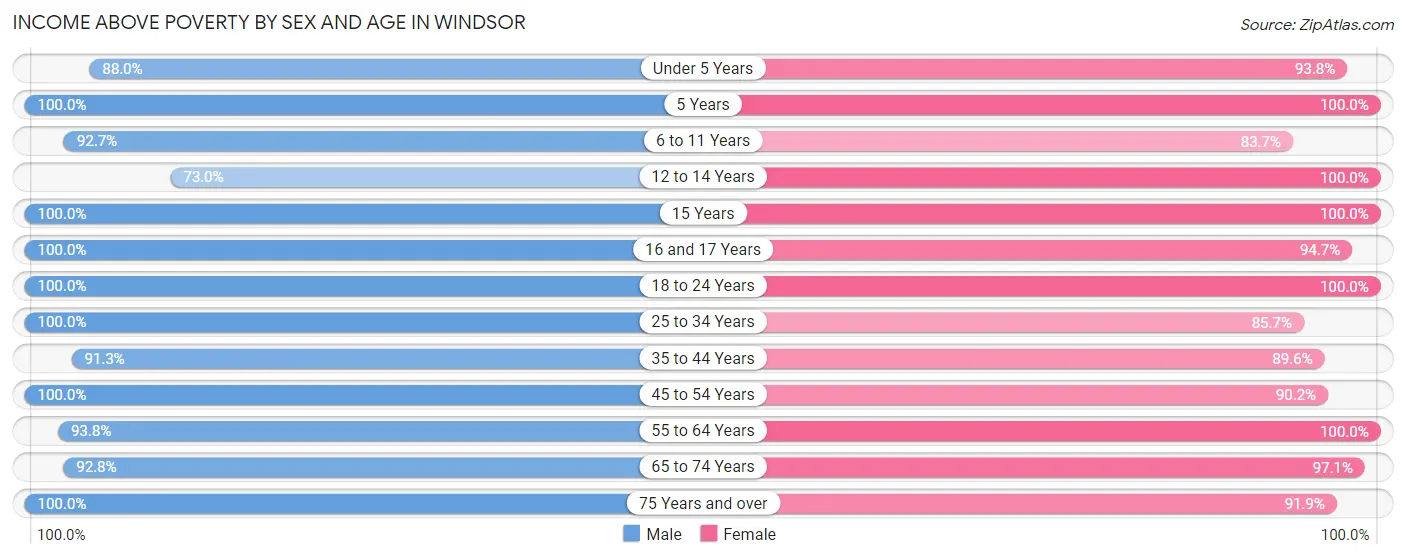
| Age Bracket | Male | Female |
| Under 5 Years | 278 (88.0%) | 317 (93.8%) |
| 5 Years | 39 (100.0%) | 66 (100.0%) |
| 6 to 11 Years | 419 (92.7%) | 370 (83.7%) |
| 12 to 14 Years | 89 (73.0%) | 120 (100.0%) |
| 15 Years | 91 (100.0%) | 39 (100.0%) |
| 16 and 17 Years | 90 (100.0%) | 125 (94.7%) |
| 18 to 24 Years | 216 (100.0%) | 352 (100.0%) |
| 25 to 34 Years | 388 (100.0%) | 511 (85.7%) |
| 35 to 44 Years | 703 (91.3%) | 680 (89.6%) |
| 45 to 54 Years | 534 (100.0%) | 360 (90.2%) |
| 55 to 64 Years | 499 (93.8%) | 628 (100.0%) |
| 65 to 74 Years | 322 (92.8%) | 366 (97.1%) |
| 75 Years and over | 230 (100.0%) | 350 (91.9%) |
| Total | 3,898 (94.5%) | 4,284 (92.5%) |
Income Below Poverty Among Married-Couple Families in Windsor
The poverty statistics for married-couple families in Windsor show that 0.6% or 11 of the total 1,926 families live below the poverty line. Families with no children have the highest poverty rate of 1.2%, comprising of 11 families. On the other hand, families with 1 or 2 children have the lowest poverty rate of 0.0%, which includes 0 families.
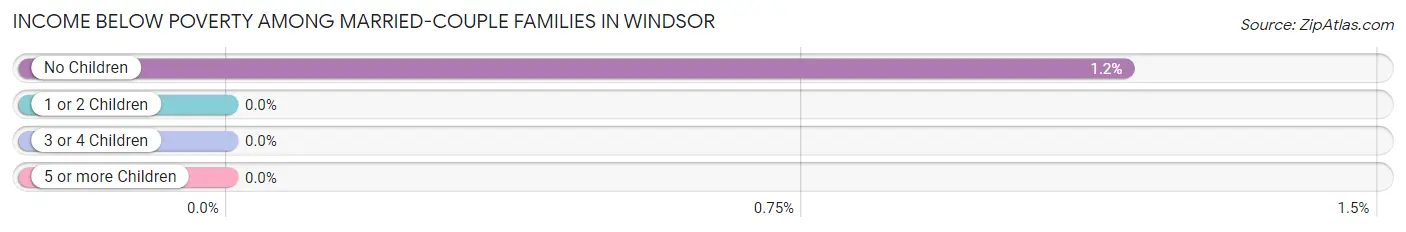
| Children | Above Poverty | Below Poverty |
| No Children | 932 (98.8%) | 11 (1.2%) |
| 1 or 2 Children | 804 (100.0%) | 0 (0.0%) |
| 3 or 4 Children | 179 (100.0%) | 0 (0.0%) |
| 5 or more Children | 0 (0.0%) | 0 (0.0%) |
| Total | 1,915 (99.4%) | 11 (0.6%) |
Income Below Poverty Among Single-Parent Households in Windsor
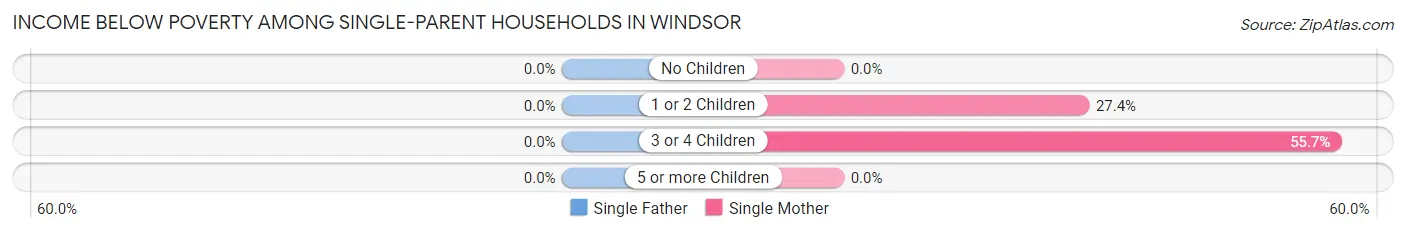
| Children | Single Father | Single Mother |
| No Children | 0 (0.0%) | 0 (0.0%) |
| 1 or 2 Children | 0 (0.0%) | 54 (27.4%) |
| 3 or 4 Children | 0 (0.0%) | 39 (55.7%) |
| 5 or more Children | 0 (0.0%) | 0 (0.0%) |
| Total | 0 (0.0%) | 93 (34.8%) |
Income Below Poverty Among Married-Couple vs Single-Parent Households in Windsor
The poverty data for Windsor shows that 11 of the married-couple family households (0.6%) and 93 of the single-parent households (27.4%) are living below the poverty level. Within the married-couple family households, those with no children have the highest poverty rate, with 11 households (1.2%) falling below the poverty line. Among the single-parent households, those with 3 or 4 children have the highest poverty rate, with 39 household (55.7%) living below poverty.
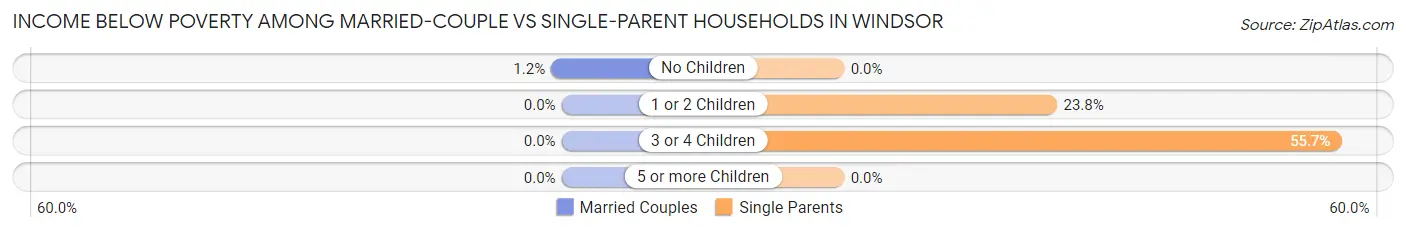
| Children | Married-Couple Families | Single-Parent Households |
| No Children | 11 (1.2%) | 0 (0.0%) |
| 1 or 2 Children | 0 (0.0%) | 54 (23.8%) |
| 3 or 4 Children | 0 (0.0%) | 39 (55.7%) |
| 5 or more Children | 0 (0.0%) | 0 (0.0%) |
| Total | 11 (0.6%) | 93 (27.4%) |
Race in Windsor
The most populous races in Windsor are White / Caucasian (8,163 | 93.2%), Hispanic or Latino (441 | 5.0%), and Two or more Races (287 | 3.3%).
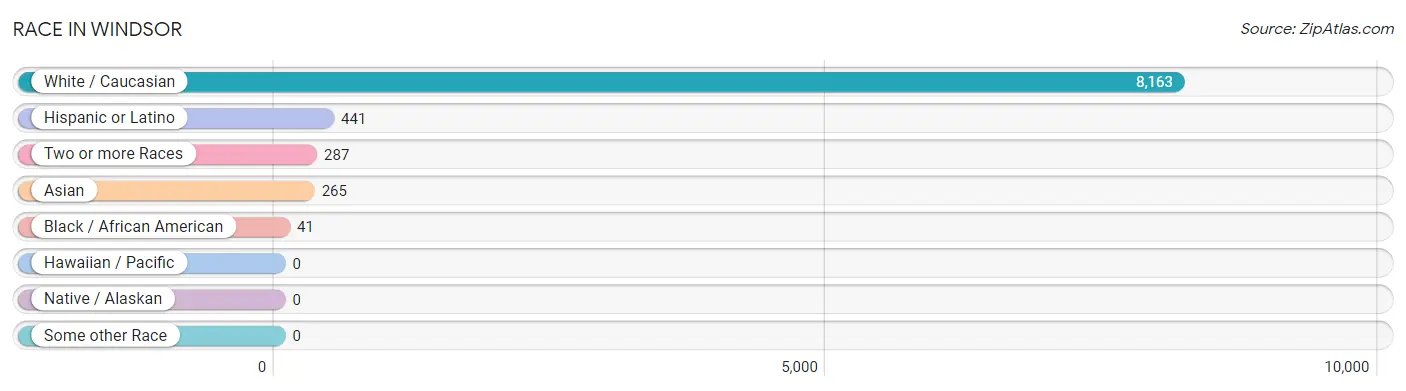
| Race | # Population | % Population |
| Asian | 265 | 3.0% |
| Black / African American | 41 | 0.5% |
| Hawaiian / Pacific | 0 | 0.0% |
| Hispanic or Latino | 441 | 5.0% |
| Native / Alaskan | 0 | 0.0% |
| White / Caucasian | 8,163 | 93.2% |
| Two or more Races | 287 | 3.3% |
| Some other Race | 0 | 0.0% |
| Total | 8,756 | 100.0% |
Ancestry in Windsor
The most populous ancestries reported in Windsor are German (3,364 | 38.4%), Irish (935 | 10.7%), Norwegian (901 | 10.3%), English (762 | 8.7%), and Polish (712 | 8.1%), together accounting for 76.2% of all Windsor residents.
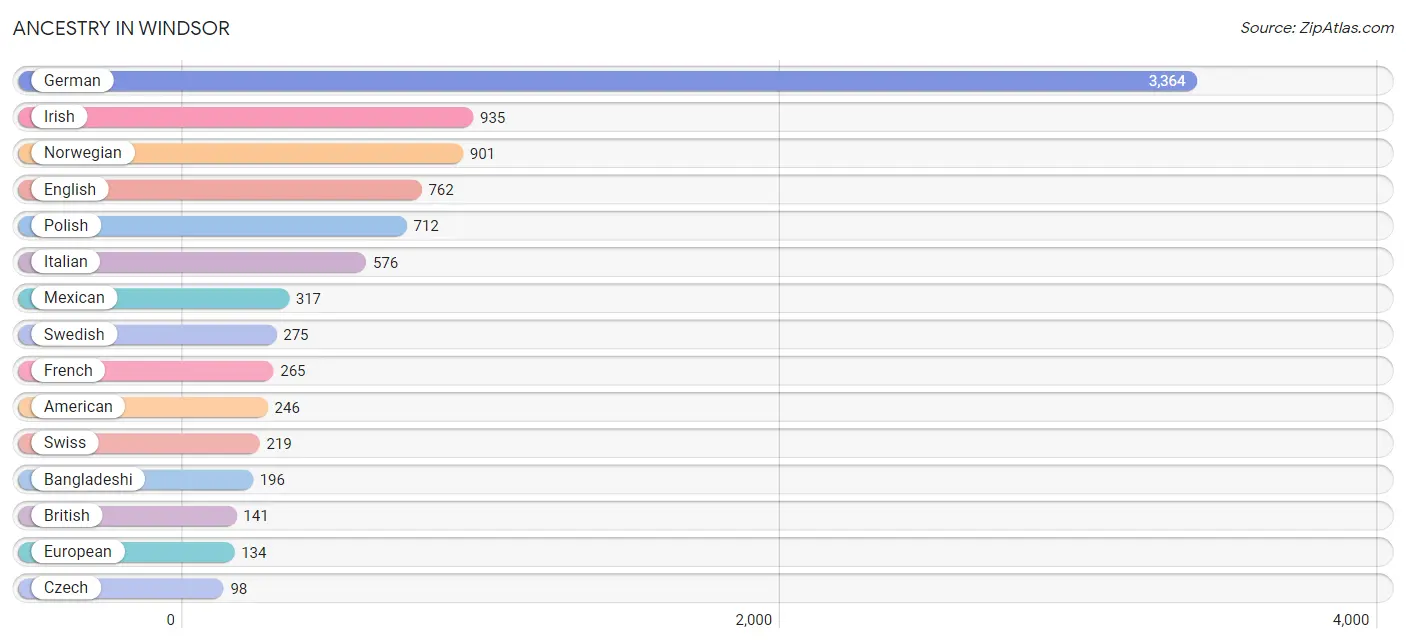
| Ancestry | # Population | % Population |
| African | 5 | 0.1% |
| American | 246 | 2.8% |
| Austrian | 17 | 0.2% |
| Bangladeshi | 196 | 2.2% |
| British | 141 | 1.6% |
| Croatian | 7 | 0.1% |
| Czech | 98 | 1.1% |
| Danish | 64 | 0.7% |
| Dutch | 94 | 1.1% |
| Eastern European | 15 | 0.2% |
| Ecuadorian | 30 | 0.3% |
| English | 762 | 8.7% |
| European | 134 | 1.5% |
| French | 265 | 3.0% |
| French Canadian | 16 | 0.2% |
| German | 3,364 | 38.4% |
| Hungarian | 88 | 1.0% |
| Irish | 935 | 10.7% |
| Iroquois | 15 | 0.2% |
| Italian | 576 | 6.6% |
| Korean | 21 | 0.2% |
| Luxembourger | 24 | 0.3% |
| Mexican | 317 | 3.6% |
| Northern European | 26 | 0.3% |
| Norwegian | 901 | 10.3% |
| Polish | 712 | 8.1% |
| Puerto Rican | 87 | 1.0% |
| Russian | 35 | 0.4% |
| Scandinavian | 30 | 0.3% |
| South American | 30 | 0.3% |
| Spaniard | 7 | 0.1% |
| Subsaharan African | 5 | 0.1% |
| Swedish | 275 | 3.1% |
| Swiss | 219 | 2.5% |
| Thai | 69 | 0.8% |
| Welsh | 48 | 0.5% | View All 36 Rows |
Immigrants in Windsor
The most numerous immigrant groups reported in Windsor came from Latin America (212 | 2.4%), Central America (182 | 2.1%), Mexico (182 | 2.1%), Asia (108 | 1.2%), and South Eastern Asia (57 | 0.6%), together accounting for 8.5% of all Windsor residents.
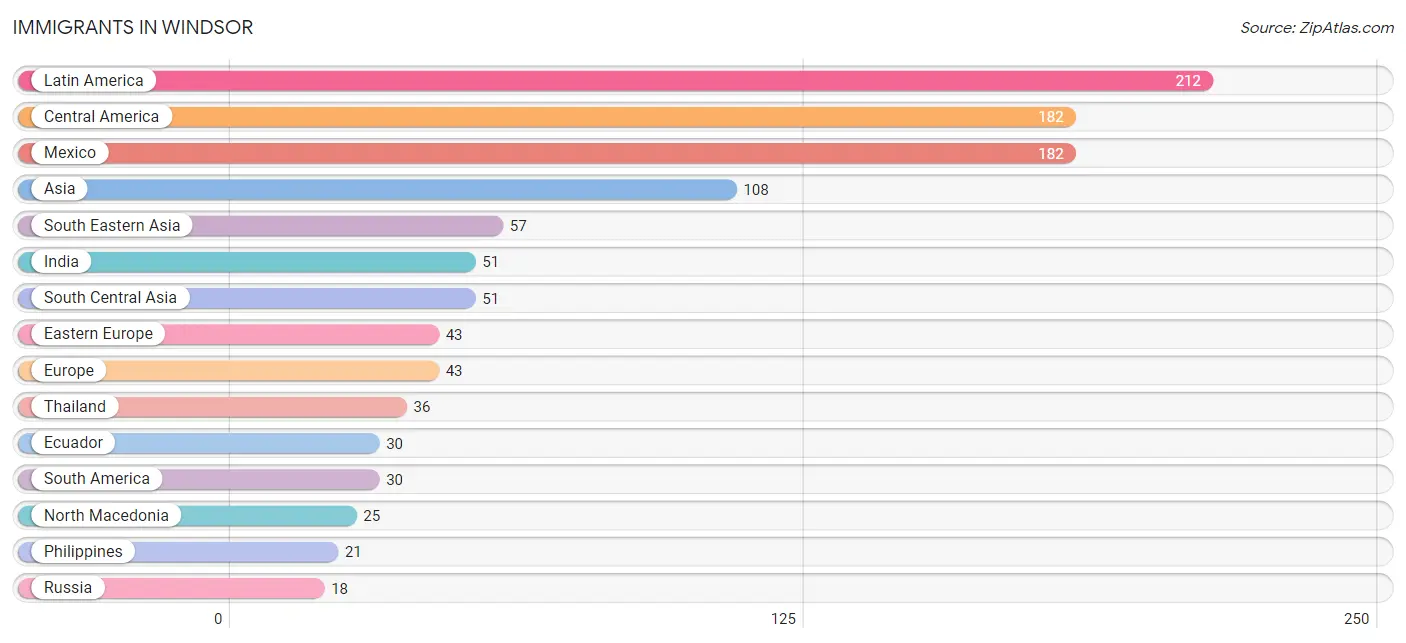
| Immigration Origin | # Population | % Population |
| Asia | 108 | 1.2% |
| Canada | 14 | 0.2% |
| Central America | 182 | 2.1% |
| Eastern Europe | 43 | 0.5% |
| Ecuador | 30 | 0.3% |
| Europe | 43 | 0.5% |
| India | 51 | 0.6% |
| Latin America | 212 | 2.4% |
| Mexico | 182 | 2.1% |
| North Macedonia | 25 | 0.3% |
| Philippines | 21 | 0.2% |
| Russia | 18 | 0.2% |
| South America | 30 | 0.3% |
| South Central Asia | 51 | 0.6% |
| South Eastern Asia | 57 | 0.6% |
| Thailand | 36 | 0.4% | View All 16 Rows |
Sex and Age in Windsor
Sex and Age in Windsor
The most populous age groups in Windsor are 40 to 44 Years (392 | 9.5%) for men and 35 to 39 Years (475 | 10.3%) for women.
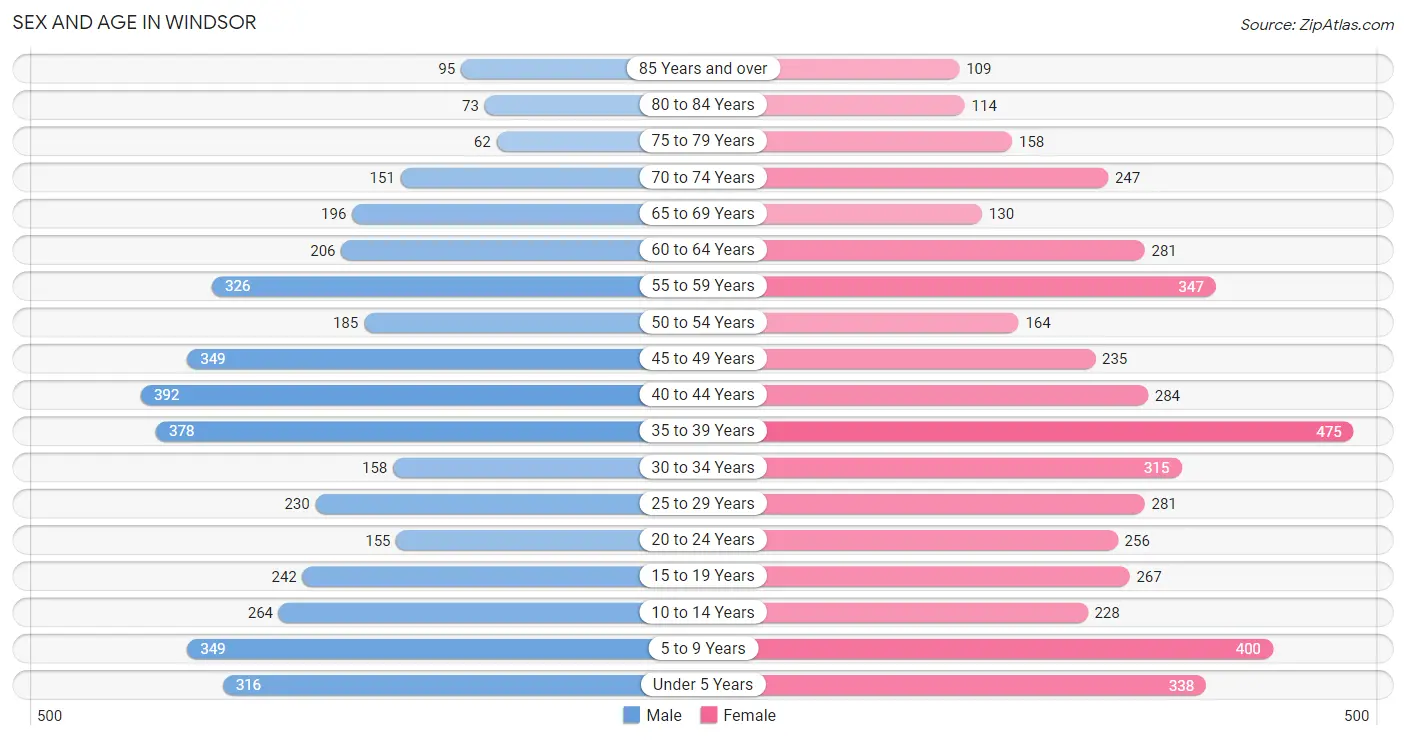
| Age Bracket | Male | Female |
| Under 5 Years | 316 (7.7%) | 338 (7.3%) |
| 5 to 9 Years | 349 (8.5%) | 400 (8.6%) |
| 10 to 14 Years | 264 (6.4%) | 228 (4.9%) |
| 15 to 19 Years | 242 (5.9%) | 267 (5.8%) |
| 20 to 24 Years | 155 (3.8%) | 256 (5.5%) |
| 25 to 29 Years | 230 (5.6%) | 281 (6.1%) |
| 30 to 34 Years | 158 (3.8%) | 315 (6.8%) |
| 35 to 39 Years | 378 (9.2%) | 475 (10.3%) |
| 40 to 44 Years | 392 (9.5%) | 284 (6.1%) |
| 45 to 49 Years | 349 (8.5%) | 235 (5.1%) |
| 50 to 54 Years | 185 (4.5%) | 164 (3.5%) |
| 55 to 59 Years | 326 (7.9%) | 347 (7.5%) |
| 60 to 64 Years | 206 (5.0%) | 281 (6.1%) |
| 65 to 69 Years | 196 (4.8%) | 130 (2.8%) |
| 70 to 74 Years | 151 (3.7%) | 247 (5.3%) |
| 75 to 79 Years | 62 (1.5%) | 158 (3.4%) |
| 80 to 84 Years | 73 (1.8%) | 114 (2.5%) |
| 85 Years and over | 95 (2.3%) | 109 (2.4%) |
| Total | 4,127 (100.0%) | 4,629 (100.0%) |
Families and Households in Windsor
Median Family Size in Windsor
The median family size in Windsor is 3.27 persons per family, with single male/father families (72 | 3.2%) accounting for the largest median family size of 3.68 persons per family. On the other hand, single female/mother families (267 | 11.8%) represent the smallest median family size with 3.03 persons per family.
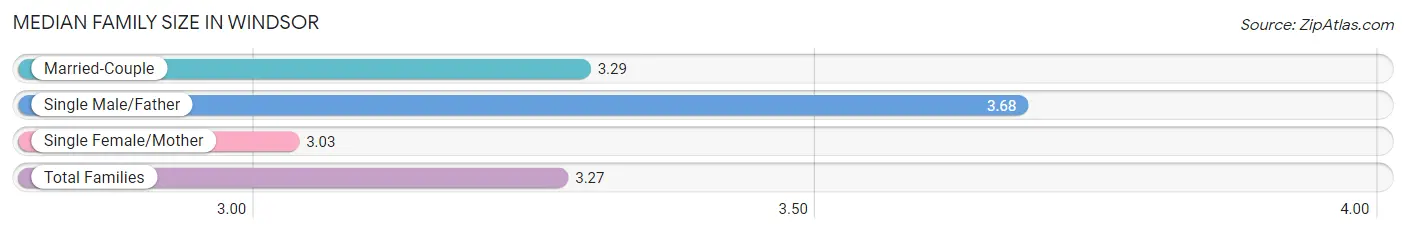
| Family Type | # Families | Family Size |
| Married-Couple | 1,926 (85.0%) | 3.29 |
| Single Male/Father | 72 (3.2%) | 3.68 |
| Single Female/Mother | 267 (11.8%) | 3.03 |
| Total Families | 2,265 (100.0%) | 3.27 |
Median Household Size in Windsor
The median household size in Windsor is 2.75 persons per household, with single male/father households (72 | 2.3%) accounting for the largest median household size of 4.06 persons per household. non-family households (921 | 28.9%) represent the smallest median household size with 1.28 persons per household.
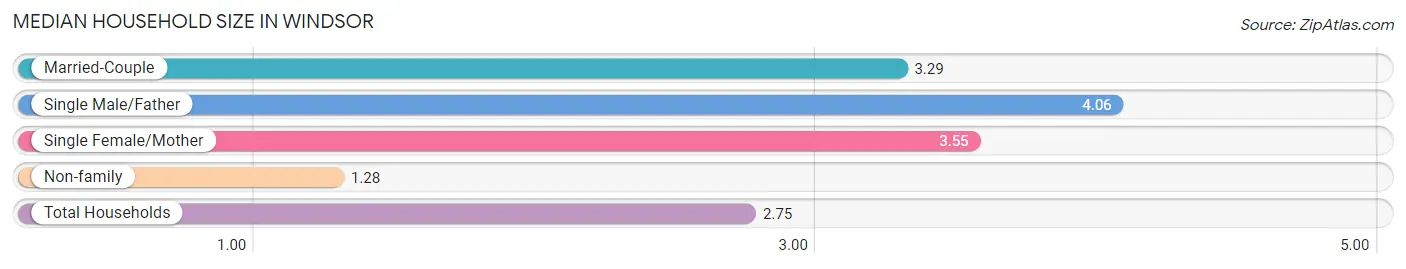
| Household Type | # Households | Household Size |
| Married-Couple | 1,926 (60.5%) | 3.29 |
| Single Male/Father | 72 (2.3%) | 4.06 |
| Single Female/Mother | 267 (8.4%) | 3.55 |
| Non-family | 921 (28.9%) | 1.28 |
| Total Households | 3,186 (100.0%) | 2.75 |
Household Size by Marriage Status in Windsor
Out of a total of 3,186 households in Windsor, 2,265 (71.1%) are family households, while 921 (28.9%) are nonfamily households. The most numerous type of family households are 2-person households, comprising 768, and the most common type of nonfamily households are 1-person households, comprising 642.
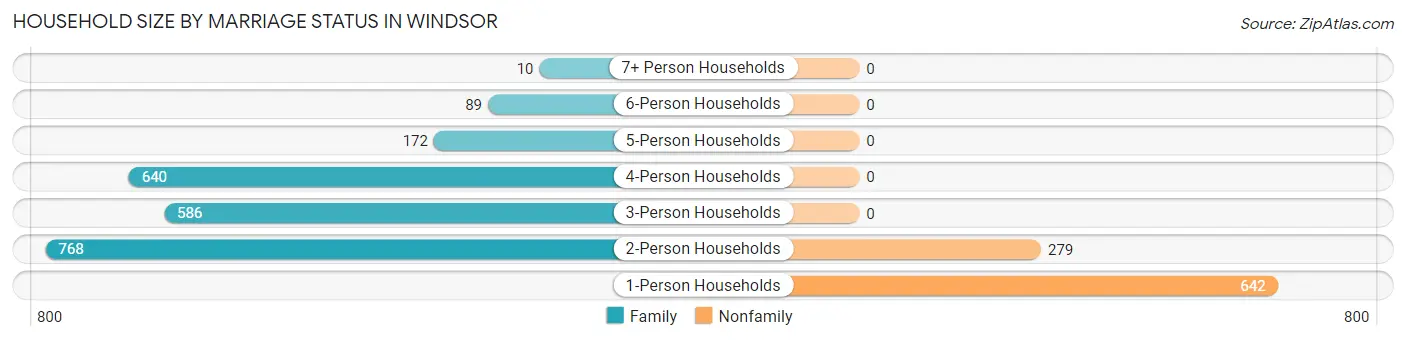
| Household Size | Family Households | Nonfamily Households |
| 1-Person Households | - | 642 (20.2%) |
| 2-Person Households | 768 (24.1%) | 279 (8.8%) |
| 3-Person Households | 586 (18.4%) | 0 (0.0%) |
| 4-Person Households | 640 (20.1%) | 0 (0.0%) |
| 5-Person Households | 172 (5.4%) | 0 (0.0%) |
| 6-Person Households | 89 (2.8%) | 0 (0.0%) |
| 7+ Person Households | 10 (0.3%) | 0 (0.0%) |
| Total | 2,265 (71.1%) | 921 (28.9%) |
Female Fertility in Windsor
Fertility by Age in Windsor
Average fertility rate in Windsor is 131.0 births per 1,000 women. Women in the age bracket of 20 to 34 years have the highest fertility rate with 271.0 births per 1,000 women. Women in the age bracket of 20 to 34 years acount for 82.8% of all women with births.
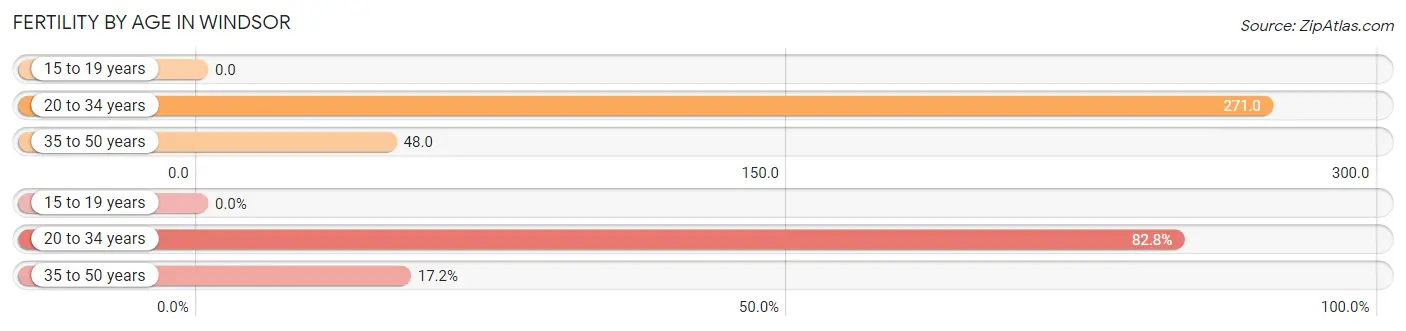
| Age Bracket | Women with Births | Births / 1,000 Women |
| 15 to 19 years | 0 (0.0%) | 0.0 |
| 20 to 34 years | 231 (82.8%) | 271.0 |
| 35 to 50 years | 48 (17.2%) | 48.0 |
| Total | 279 (100.0%) | 131.0 |
Fertility by Age by Marriage Status in Windsor
64.2% of women with births (279) in Windsor are married. The highest percentage of unmarried women with births falls into 20 to 34 years age bracket with 43.3% of them unmarried at the time of birth, while the lowest percentage of unmarried women with births belong to 35 to 50 years age bracket with 0.0% of them unmarried.
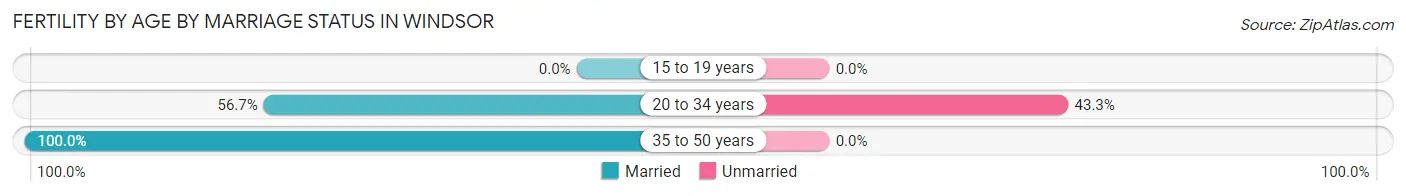
| Age Bracket | Married | Unmarried |
| 15 to 19 years | 0 (0.0%) | 0 (0.0%) |
| 20 to 34 years | 131 (56.7%) | 100 (43.3%) |
| 35 to 50 years | 48 (100.0%) | 0 (0.0%) |
| Total | 179 (64.2%) | 100 (35.8%) |
Fertility by Education in Windsor
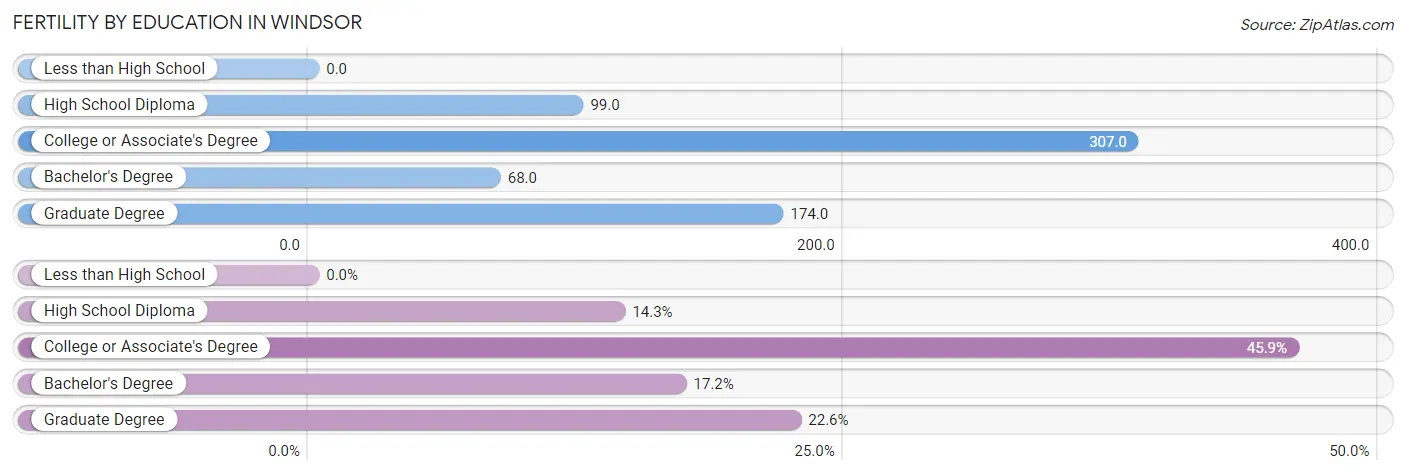
| Educational Attainment | Women with Births | Births / 1,000 Women |
| Less than High School | 0 (0.0%) | 0.0 |
| High School Diploma | 40 (14.3%) | 99.0 |
| College or Associate's Degree | 128 (45.9%) | 307.0 |
| Bachelor's Degree | 48 (17.2%) | 68.0 |
| Graduate Degree | 63 (22.6%) | 174.0 |
| Total | 279 (100.0%) | 131.0 |
Fertility by Education by Marriage Status in Windsor
35.8% of women with births in Windsor are unmarried. Women with the educational attainment of bachelor's degree are most likely to be married with 100.0% of them married at childbirth, while women with the educational attainment of college or associate's degree are least likely to be married with 60.2% of them unmarried at childbirth.
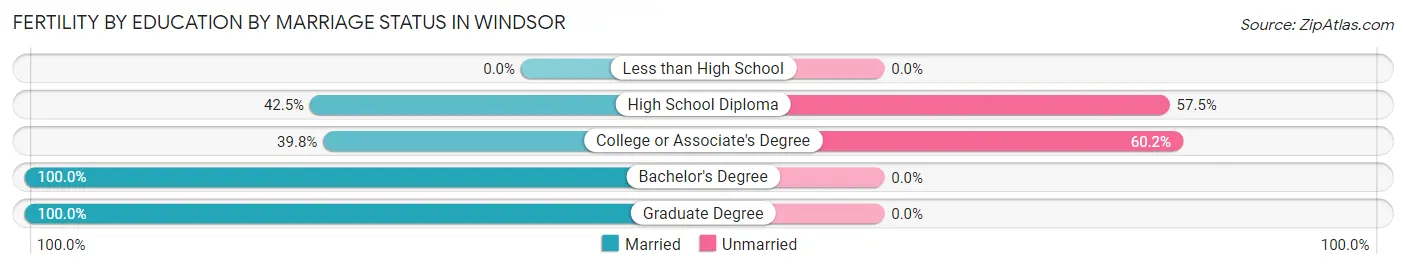
| Educational Attainment | Married | Unmarried |
| Less than High School | 0 (0.0%) | 0 (0.0%) |
| High School Diploma | 17 (42.5%) | 23 (57.5%) |
| College or Associate's Degree | 51 (39.8%) | 77 (60.2%) |
| Bachelor's Degree | 48 (100.0%) | 0 (0.0%) |
| Graduate Degree | 63 (100.0%) | 0 (0.0%) |
| Total | 179 (64.2%) | 100 (35.8%) |
Employment Characteristics in Windsor
Employment by Class of Employer in Windsor
Among the 5,068 employed individuals in Windsor, private company employees (3,600 | 71.0%), self-employed (not incorporated) (336 | 6.6%), and state government employees (317 | 6.2%) make up the most common classes of employment.
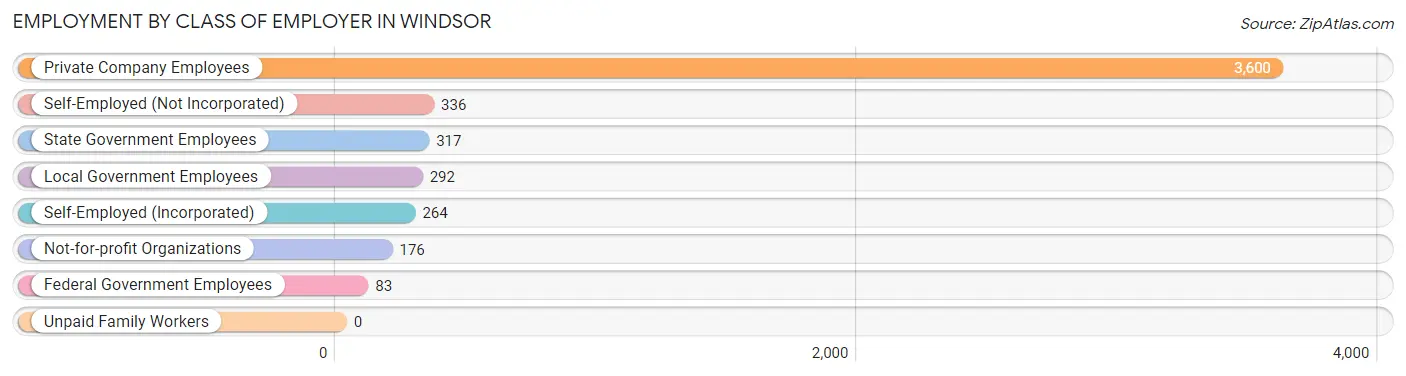
| Employer Class | # Employees | % Employees |
| Private Company Employees | 3,600 | 71.0% |
| Self-Employed (Incorporated) | 264 | 5.2% |
| Self-Employed (Not Incorporated) | 336 | 6.6% |
| Not-for-profit Organizations | 176 | 3.5% |
| Local Government Employees | 292 | 5.8% |
| State Government Employees | 317 | 6.2% |
| Federal Government Employees | 83 | 1.6% |
| Unpaid Family Workers | 0 | 0.0% |
| Total | 5,068 | 100.0% |
Employment Status by Age in Windsor
According to the labor force statistics for Windsor, out of the total population over 16 years of age (6,731), 77.0% or 5,183 individuals are in the labor force, with 2.0% or 104 of them unemployed. The age group with the highest labor force participation rate is 45 to 54 years, with 99.5% or 928 individuals in the labor force. Within the labor force, the 35 to 44 years age range has the highest percentage of unemployed individuals, with 6.3% or 90 of them being unemployed.
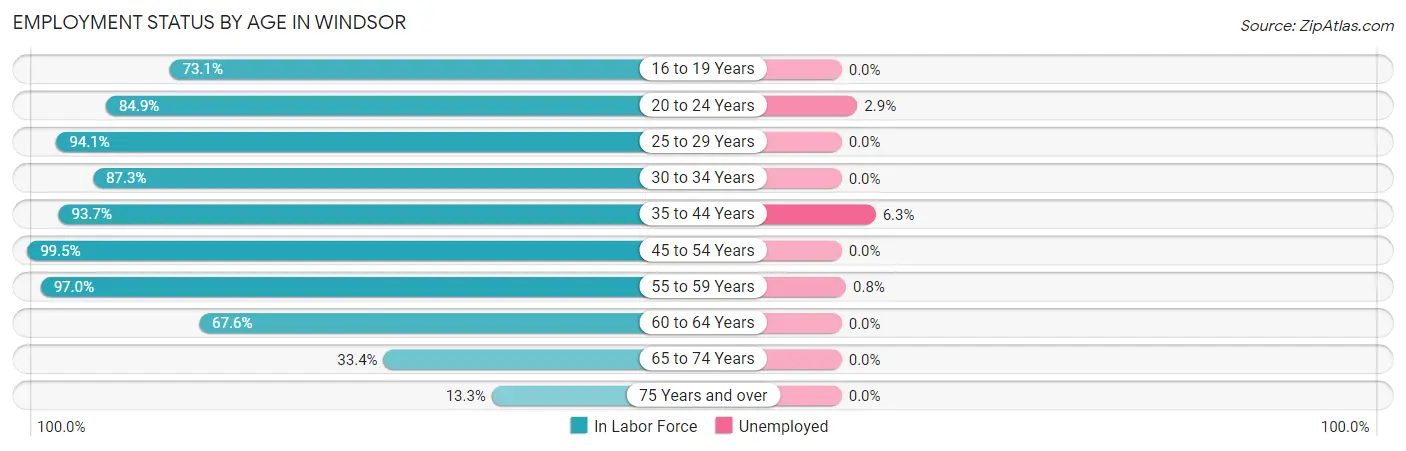
| Age Bracket | In Labor Force | Unemployed |
| 16 to 19 Years | 277 (73.1%) | 0 (0.0%) |
| 20 to 24 Years | 349 (84.9%) | 10 (2.9%) |
| 25 to 29 Years | 481 (94.1%) | 0 (0.0%) |
| 30 to 34 Years | 413 (87.3%) | 0 (0.0%) |
| 35 to 44 Years | 1,433 (93.7%) | 90 (6.3%) |
| 45 to 54 Years | 928 (99.5%) | 0 (0.0%) |
| 55 to 59 Years | 653 (97.0%) | 5 (0.8%) |
| 60 to 64 Years | 329 (67.6%) | 0 (0.0%) |
| 65 to 74 Years | 242 (33.4%) | 0 (0.0%) |
| 75 Years and over | 81 (13.3%) | 0 (0.0%) |
| Total | 5,183 (77.0%) | 104 (2.0%) |
Employment Status by Educational Attainment in Windsor
According to labor force statistics for Windsor, 92.0% of individuals (4,238) out of the total population between 25 and 64 years of age (4,606) are in the labor force, with 2.3% or 97 of them being unemployed. The group with the highest labor force participation rate are those with the educational attainment of less than high school, with 100.0% or 254 individuals in the labor force. Within the labor force, individuals with high school diploma education have the highest percentage of unemployment, with 7.2% or 72 of them being unemployed.
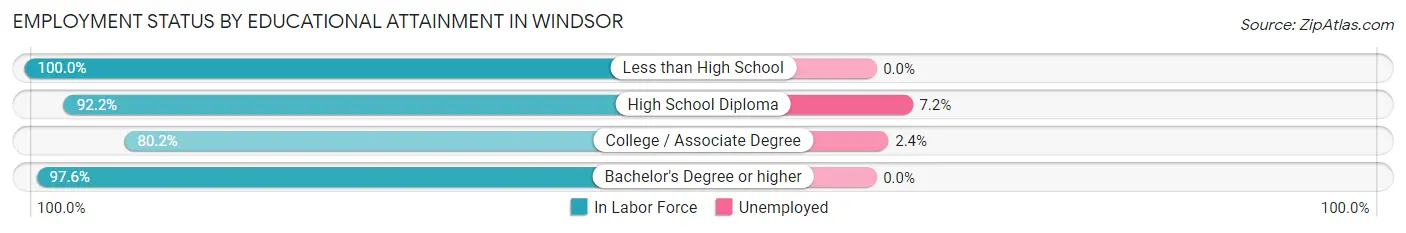
| Educational Attainment | In Labor Force | Unemployed |
| Less than High School | 254 (100.0%) | 0 (0.0%) |
| High School Diploma | 996 (92.2%) | 78 (7.2%) |
| College / Associate Degree | 954 (80.2%) | 29 (2.4%) |
| Bachelor's Degree or higher | 2,033 (97.6%) | 0 (0.0%) |
| Total | 4,238 (92.0%) | 106 (2.3%) |
Employment Occupations by Sex in Windsor
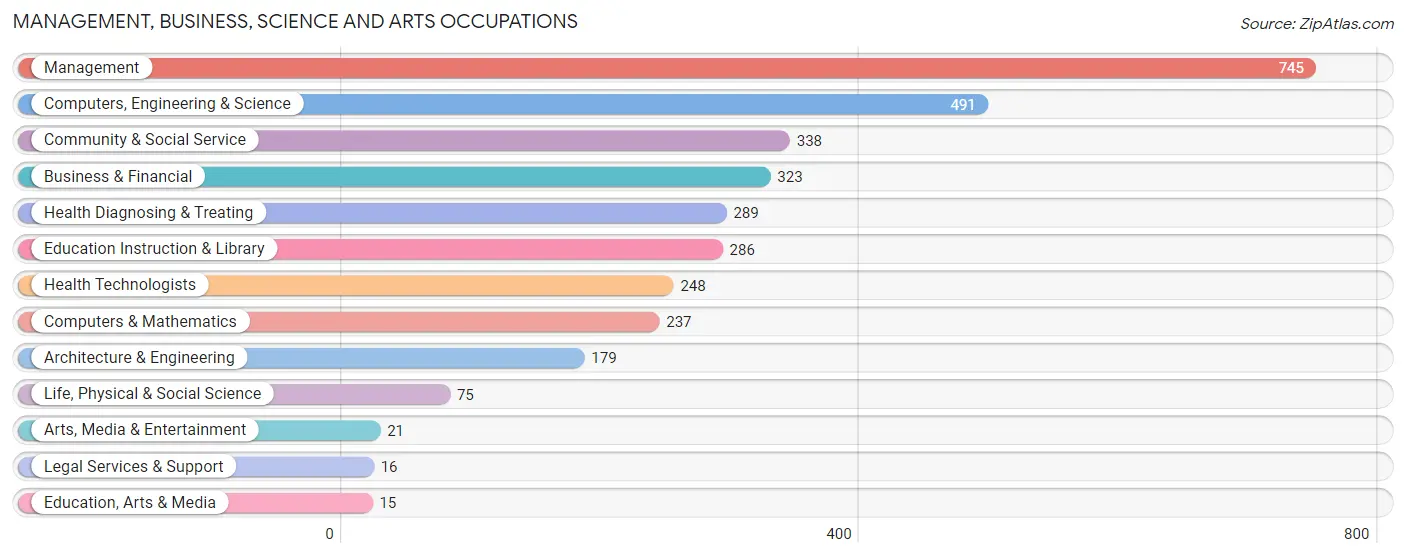
Management, Business, Science and Arts Occupations
The most common Management, Business, Science and Arts occupations in Windsor are Management (745 | 14.7%), Computers, Engineering & Science (491 | 9.7%), Community & Social Service (338 | 6.7%), Business & Financial (323 | 6.4%), and Health Diagnosing & Treating (289 | 5.7%).
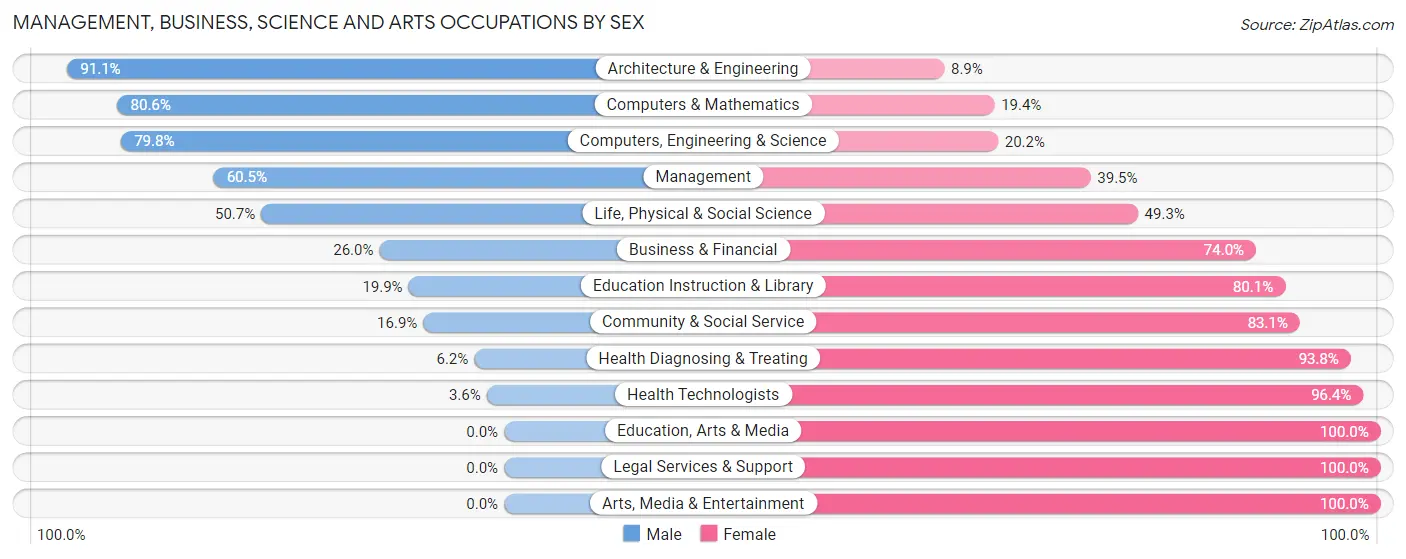
Management, Business, Science and Arts Occupations by Sex
Within the Management, Business, Science and Arts occupations in Windsor, the most male-oriented occupations are Architecture & Engineering (91.1%), Computers & Mathematics (80.6%), and Computers, Engineering & Science (79.8%), while the most female-oriented occupations are Education, Arts & Media (100.0%), Legal Services & Support (100.0%), and Arts, Media & Entertainment (100.0%).
| Occupation | Male | Female |
| Management | 451 (60.5%) | 294 (39.5%) |
| Business & Financial | 84 (26.0%) | 239 (74.0%) |
| Computers, Engineering & Science | 392 (79.8%) | 99 (20.2%) |
| Computers & Mathematics | 191 (80.6%) | 46 (19.4%) |
| Architecture & Engineering | 163 (91.1%) | 16 (8.9%) |
| Life, Physical & Social Science | 38 (50.7%) | 37 (49.3%) |
| Community & Social Service | 57 (16.9%) | 281 (83.1%) |
| Education, Arts & Media | 0 (0.0%) | 15 (100.0%) |
| Legal Services & Support | 0 (0.0%) | 16 (100.0%) |
| Education Instruction & Library | 57 (19.9%) | 229 (80.1%) |
| Arts, Media & Entertainment | 0 (0.0%) | 21 (100.0%) |
| Health Diagnosing & Treating | 18 (6.2%) | 271 (93.8%) |
| Health Technologists | 9 (3.6%) | 239 (96.4%) |
| Total (Category) | 1,002 (45.8%) | 1,184 (54.2%) |
| Total (Overall) | 2,520 (49.9%) | 2,531 (50.1%) |
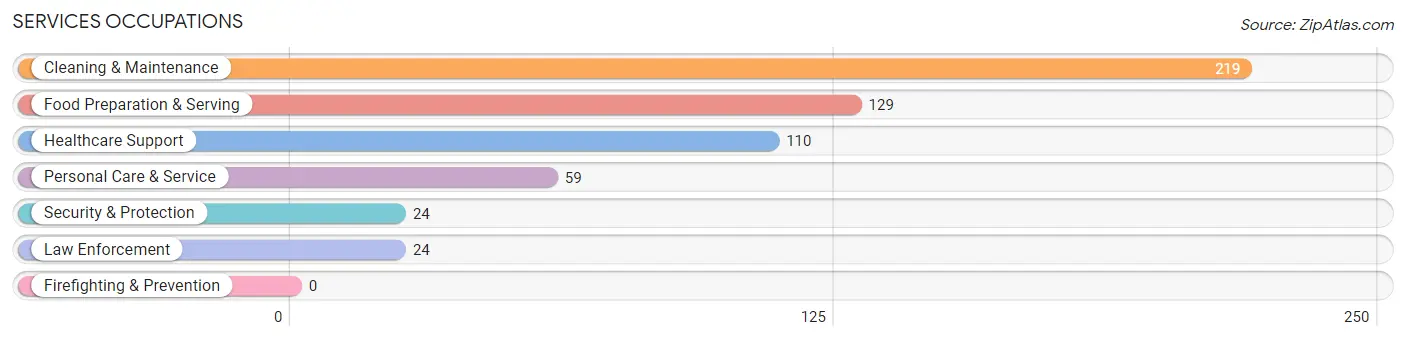
Services Occupations
The most common Services occupations in Windsor are Cleaning & Maintenance (219 | 4.3%), Food Preparation & Serving (129 | 2.5%), Healthcare Support (110 | 2.2%), Personal Care & Service (59 | 1.2%), and Security & Protection (24 | 0.5%).
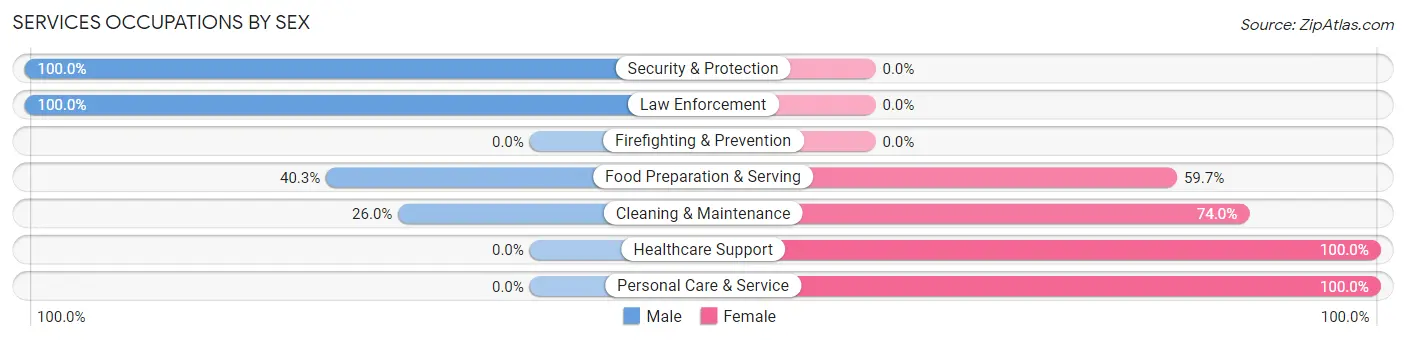
Services Occupations by Sex
Within the Services occupations in Windsor, the most male-oriented occupations are Security & Protection (100.0%), Law Enforcement (100.0%), and Food Preparation & Serving (40.3%), while the most female-oriented occupations are Healthcare Support (100.0%), Personal Care & Service (100.0%), and Cleaning & Maintenance (74.0%).
| Occupation | Male | Female |
| Healthcare Support | 0 (0.0%) | 110 (100.0%) |
| Security & Protection | 24 (100.0%) | 0 (0.0%) |
| Firefighting & Prevention | 0 (0.0%) | 0 (0.0%) |
| Law Enforcement | 24 (100.0%) | 0 (0.0%) |
| Food Preparation & Serving | 52 (40.3%) | 77 (59.7%) |
| Cleaning & Maintenance | 57 (26.0%) | 162 (74.0%) |
| Personal Care & Service | 0 (0.0%) | 59 (100.0%) |
| Total (Category) | 133 (24.6%) | 408 (75.4%) |
| Total (Overall) | 2,520 (49.9%) | 2,531 (50.1%) |
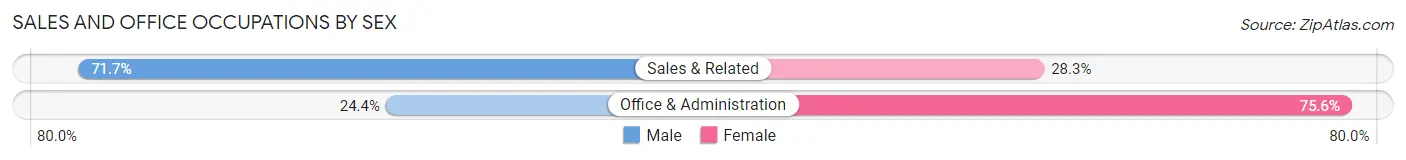
Sales and Office Occupations
The most common Sales and Office occupations in Windsor are Office & Administration (745 | 14.7%), and Sales & Related (460 | 9.1%).
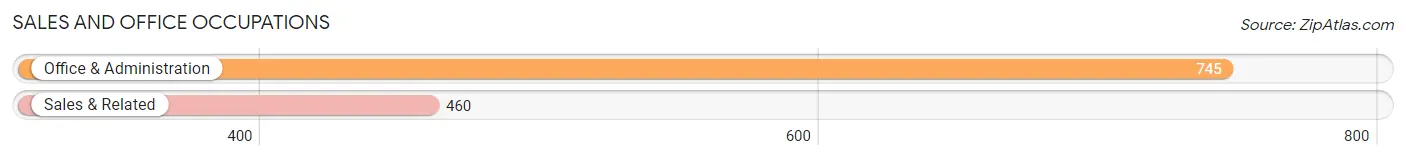
Sales and Office Occupations by Sex
| Occupation | Male | Female |
| Sales & Related | 330 (71.7%) | 130 (28.3%) |
| Office & Administration | 182 (24.4%) | 563 (75.6%) |
| Total (Category) | 512 (42.5%) | 693 (57.5%) |
| Total (Overall) | 2,520 (49.9%) | 2,531 (50.1%) |
Natural Resources, Construction and Maintenance Occupations
The most common Natural Resources, Construction and Maintenance occupations in Windsor are Construction & Extraction (342 | 6.8%), Installation, Maintenance & Repair (90 | 1.8%), and Farming, Fishing & Forestry (43 | 0.9%).
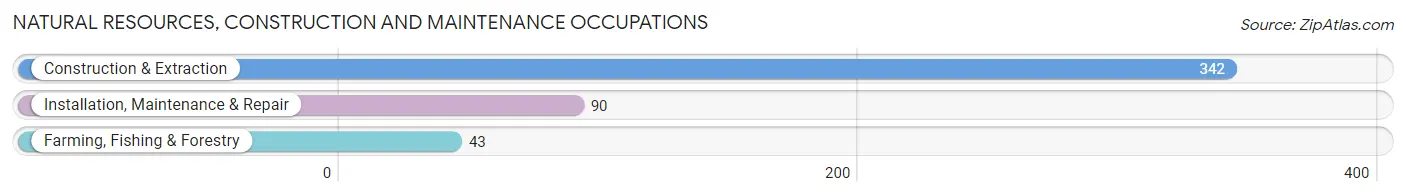
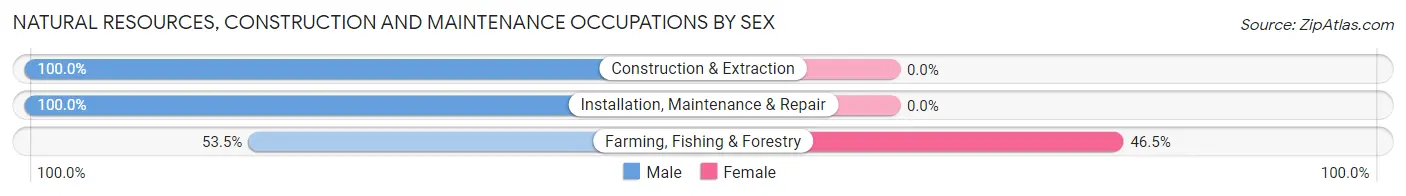
Natural Resources, Construction and Maintenance Occupations by Sex
| Occupation | Male | Female |
| Farming, Fishing & Forestry | 23 (53.5%) | 20 (46.5%) |
| Construction & Extraction | 342 (100.0%) | 0 (0.0%) |
| Installation, Maintenance & Repair | 90 (100.0%) | 0 (0.0%) |
| Total (Category) | 455 (95.8%) | 20 (4.2%) |
| Total (Overall) | 2,520 (49.9%) | 2,531 (50.1%) |
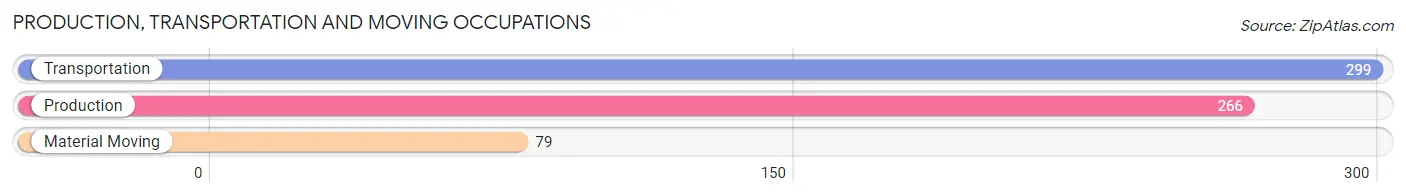
Production, Transportation and Moving Occupations
The most common Production, Transportation and Moving occupations in Windsor are Transportation (299 | 5.9%), Production (266 | 5.3%), and Material Moving (79 | 1.6%).
Production, Transportation and Moving Occupations by Sex
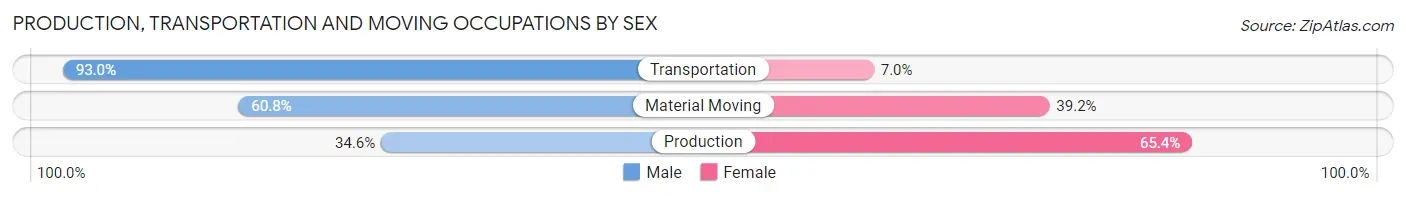
| Occupation | Male | Female |
| Production | 92 (34.6%) | 174 (65.4%) |
| Transportation | 278 (93.0%) | 21 (7.0%) |
| Material Moving | 48 (60.8%) | 31 (39.2%) |
| Total (Category) | 418 (64.9%) | 226 (35.1%) |
| Total (Overall) | 2,520 (49.9%) | 2,531 (50.1%) |
Employment Industries by Sex in Windsor
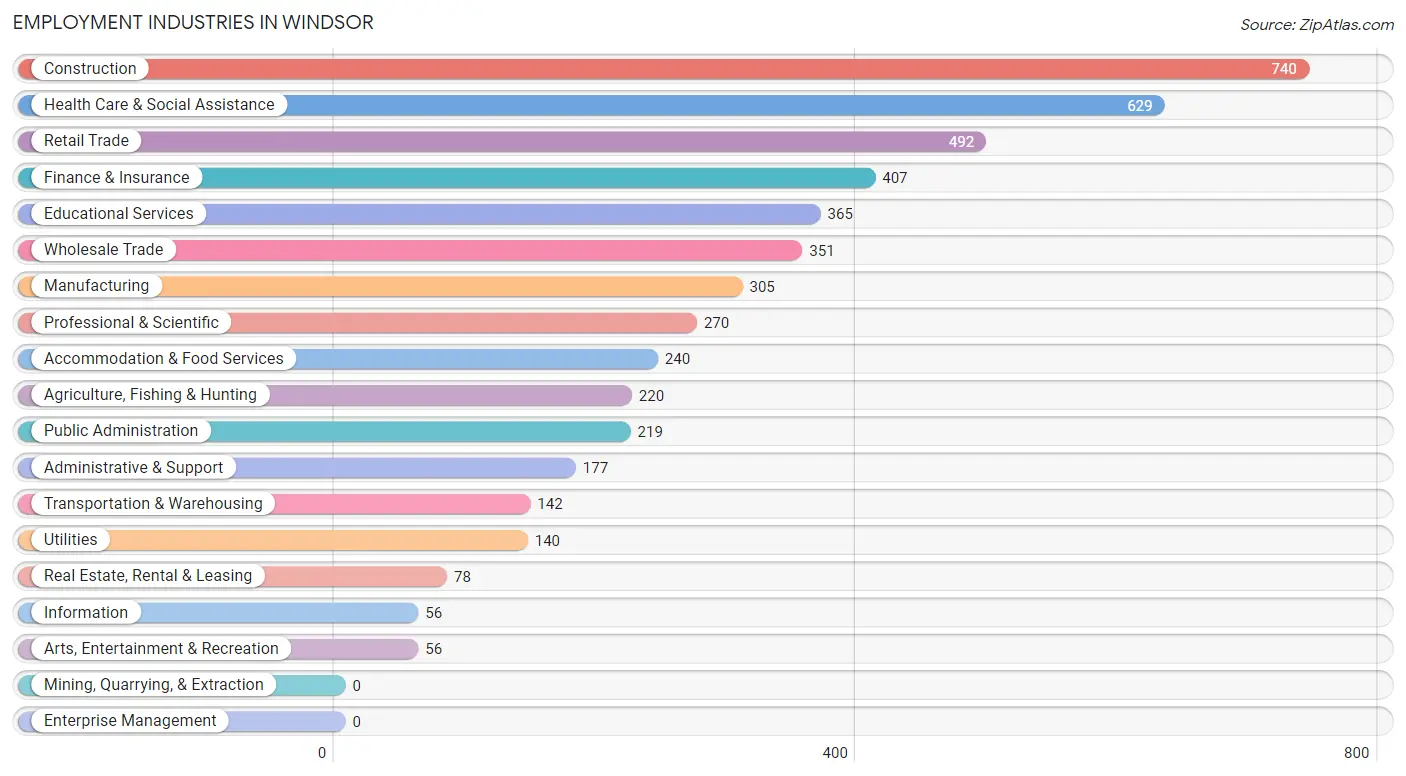
Employment Industries in Windsor
The major employment industries in Windsor include Construction (740 | 14.6%), Health Care & Social Assistance (629 | 12.4%), Retail Trade (492 | 9.7%), Finance & Insurance (407 | 8.1%), and Educational Services (365 | 7.2%).
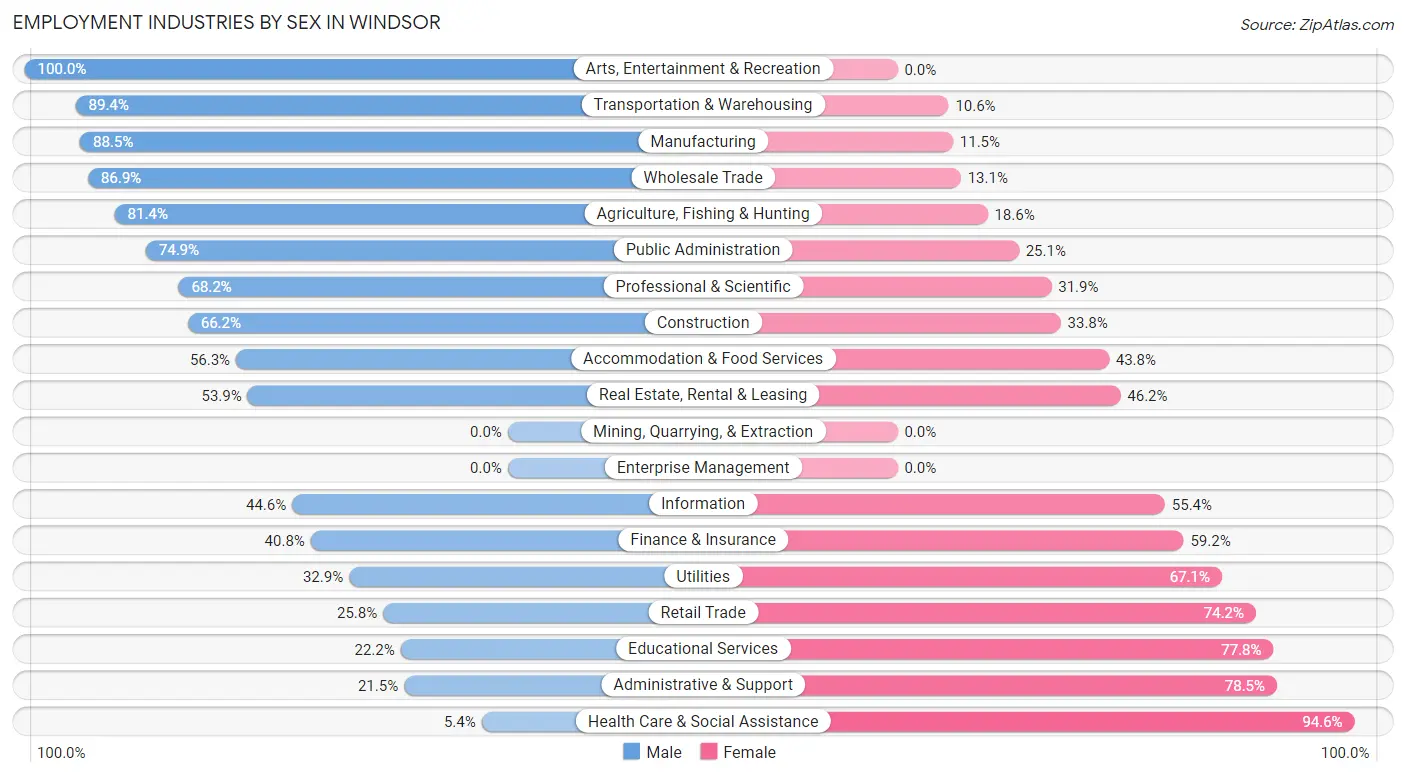
Employment Industries by Sex in Windsor
The Windsor industries that see more men than women are Arts, Entertainment & Recreation (100.0%), Transportation & Warehousing (89.4%), and Manufacturing (88.5%), whereas the industries that tend to have a higher number of women are Health Care & Social Assistance (94.6%), Administrative & Support (78.5%), and Educational Services (77.8%).
| Industry | Male | Female |
| Agriculture, Fishing & Hunting | 179 (81.4%) | 41 (18.6%) |
| Mining, Quarrying, & Extraction | 0 (0.0%) | 0 (0.0%) |
| Construction | 490 (66.2%) | 250 (33.8%) |
| Manufacturing | 270 (88.5%) | 35 (11.5%) |
| Wholesale Trade | 305 (86.9%) | 46 (13.1%) |
| Retail Trade | 127 (25.8%) | 365 (74.2%) |
| Transportation & Warehousing | 127 (89.4%) | 15 (10.6%) |
| Utilities | 46 (32.9%) | 94 (67.1%) |
| Information | 25 (44.6%) | 31 (55.4%) |
| Finance & Insurance | 166 (40.8%) | 241 (59.2%) |
| Real Estate, Rental & Leasing | 42 (53.8%) | 36 (46.2%) |
| Professional & Scientific | 184 (68.1%) | 86 (31.9%) |
| Enterprise Management | 0 (0.0%) | 0 (0.0%) |
| Administrative & Support | 38 (21.5%) | 139 (78.5%) |
| Educational Services | 81 (22.2%) | 284 (77.8%) |
| Health Care & Social Assistance | 34 (5.4%) | 595 (94.6%) |
| Arts, Entertainment & Recreation | 56 (100.0%) | 0 (0.0%) |
| Accommodation & Food Services | 135 (56.2%) | 105 (43.8%) |
| Public Administration | 164 (74.9%) | 55 (25.1%) |
| Total | 2,520 (49.9%) | 2,531 (50.1%) |
Education in Windsor
School Enrollment in Windsor
The most common levels of schooling among the 1,976 students in Windsor are elementary school (618 | 31.3%), high school (451 | 22.8%), and middle school (418 | 21.1%).
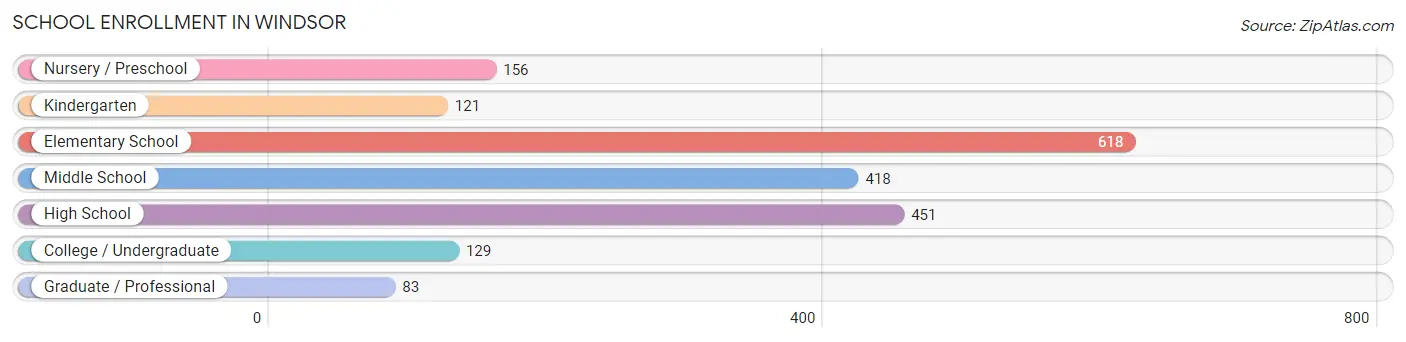
| School Level | # Students | % Students |
| Nursery / Preschool | 156 | 7.9% |
| Kindergarten | 121 | 6.1% |
| Elementary School | 618 | 31.3% |
| Middle School | 418 | 21.1% |
| High School | 451 | 22.8% |
| College / Undergraduate | 129 | 6.5% |
| Graduate / Professional | 83 | 4.2% |
| Total | 1,976 | 100.0% |
School Enrollment by Age by Funding Source in Windsor
Out of a total of 1,976 students who are enrolled in schools in Windsor, 164 (8.3%) attend a private institution, while the remaining 1,812 (91.7%) are enrolled in public schools. The age group of 3 to 4 year olds has the highest likelihood of being enrolled in private schools, with 74 (61.7% in the age bracket) enrolled. Conversely, the age group of 15 to 17 year olds has the lowest likelihood of being enrolled in a private school, with 352 (100.0% in the age bracket) attending a public institution.
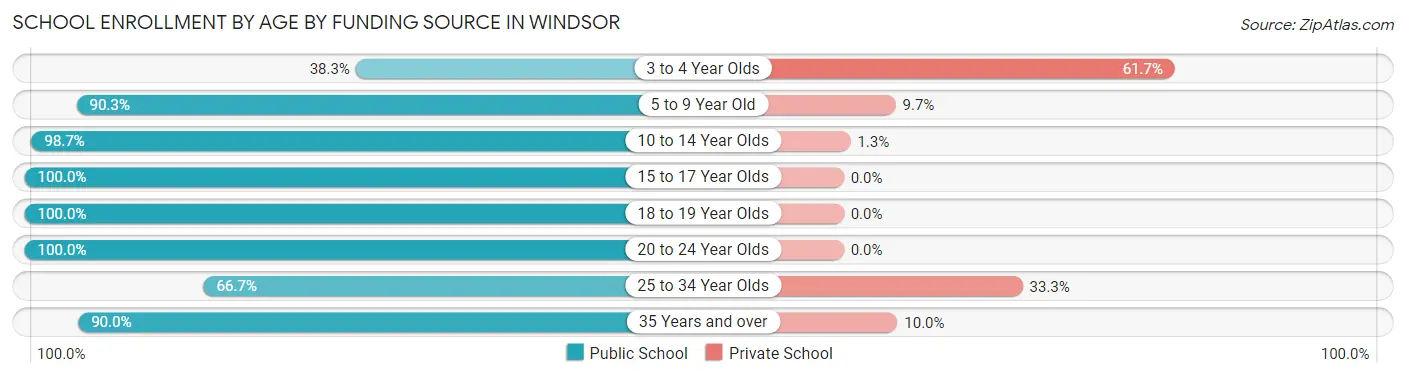
| Age Bracket | Public School | Private School |
| 3 to 4 Year Olds | 46 (38.3%) | 74 (61.7%) |
| 5 to 9 Year Old | 653 (90.3%) | 70 (9.7%) |
| 10 to 14 Year Olds | 467 (98.7%) | 6 (1.3%) |
| 15 to 17 Year Olds | 352 (100.0%) | 0 (0.0%) |
| 18 to 19 Year Olds | 109 (100.0%) | 0 (0.0%) |
| 20 to 24 Year Olds | 108 (100.0%) | 0 (0.0%) |
| 25 to 34 Year Olds | 14 (66.7%) | 7 (33.3%) |
| 35 Years and over | 63 (90.0%) | 7 (10.0%) |
| Total | 1,812 (91.7%) | 164 (8.3%) |
Educational Attainment by Field of Study in Windsor
Business (697 | 25.7%), arts & humanities (317 | 11.7%), bio, nature & agricultural (274 | 10.1%), education (263 | 9.7%), and science & technology (225 | 8.3%) are the most common fields of study among 2,715 individuals in Windsor who have obtained a bachelor's degree or higher.
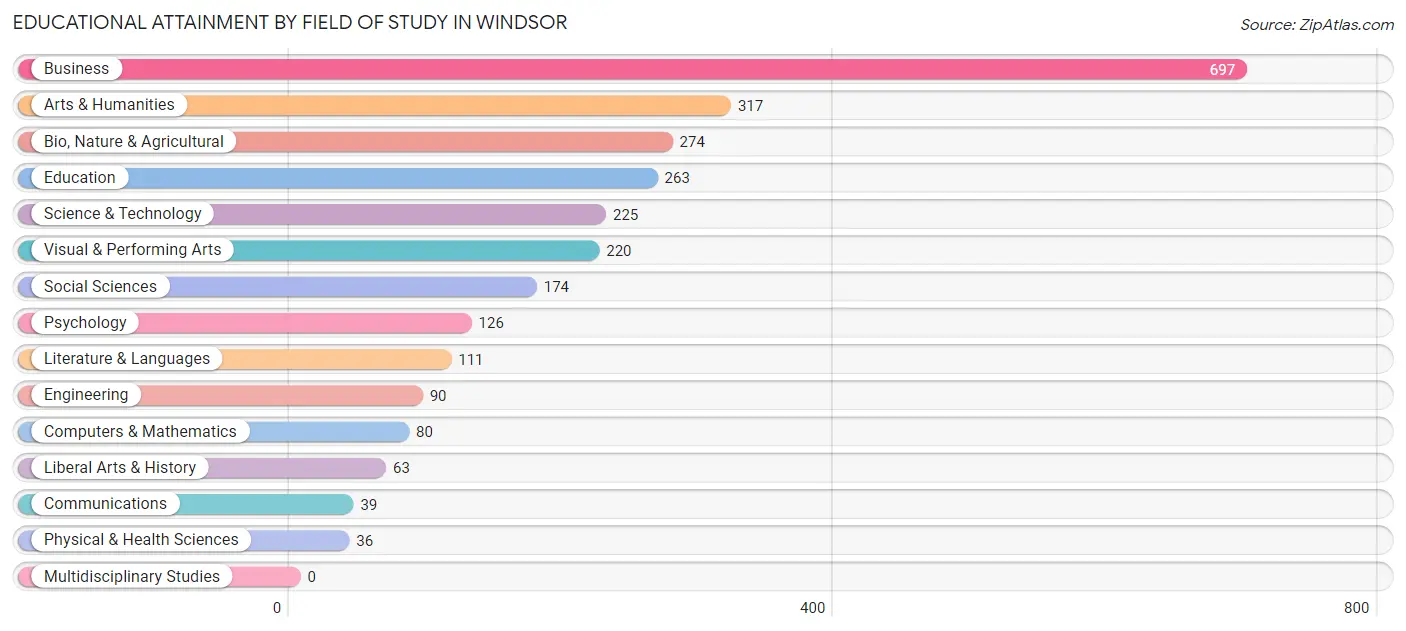
| Field of Study | # Graduates | % Graduates |
| Computers & Mathematics | 80 | 2.9% |
| Bio, Nature & Agricultural | 274 | 10.1% |
| Physical & Health Sciences | 36 | 1.3% |
| Psychology | 126 | 4.6% |
| Social Sciences | 174 | 6.4% |
| Engineering | 90 | 3.3% |
| Multidisciplinary Studies | 0 | 0.0% |
| Science & Technology | 225 | 8.3% |
| Business | 697 | 25.7% |
| Education | 263 | 9.7% |
| Literature & Languages | 111 | 4.1% |
| Liberal Arts & History | 63 | 2.3% |
| Visual & Performing Arts | 220 | 8.1% |
| Communications | 39 | 1.4% |
| Arts & Humanities | 317 | 11.7% |
| Total | 2,715 | 100.0% |
Transportation & Commute in Windsor
Vehicle Availability by Sex in Windsor
The most prevalent vehicle ownership categories in Windsor are males with 2 vehicles (1,188, accounting for 47.1%) and females with 2 vehicles (1,361, making up 46.7%).
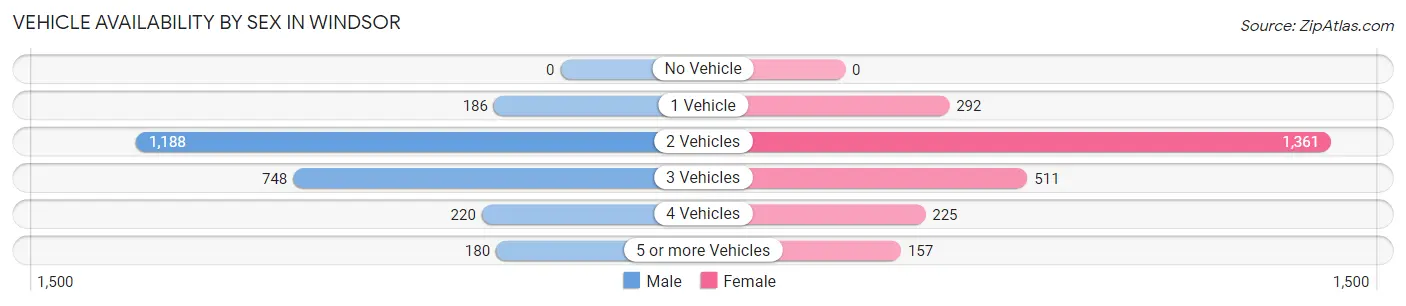
| Vehicles Available | Male | Female |
| No Vehicle | 0 (0.0%) | 0 (0.0%) |
| 1 Vehicle | 186 (7.4%) | 292 (11.5%) |
| 2 Vehicles | 1,188 (47.1%) | 1,361 (53.5%) |
| 3 Vehicles | 748 (29.7%) | 511 (20.1%) |
| 4 Vehicles | 220 (8.7%) | 225 (8.8%) |
| 5 or more Vehicles | 180 (7.1%) | 157 (6.2%) |
| Total | 2,522 (100.0%) | 2,546 (100.0%) |
Commute Time in Windsor
The most frequently occuring commute durations in Windsor are 15 to 19 minutes (710 commuters, 17.3%), 20 to 24 minutes (672 commuters, 16.4%), and 5 to 9 minutes (623 commuters, 15.1%).
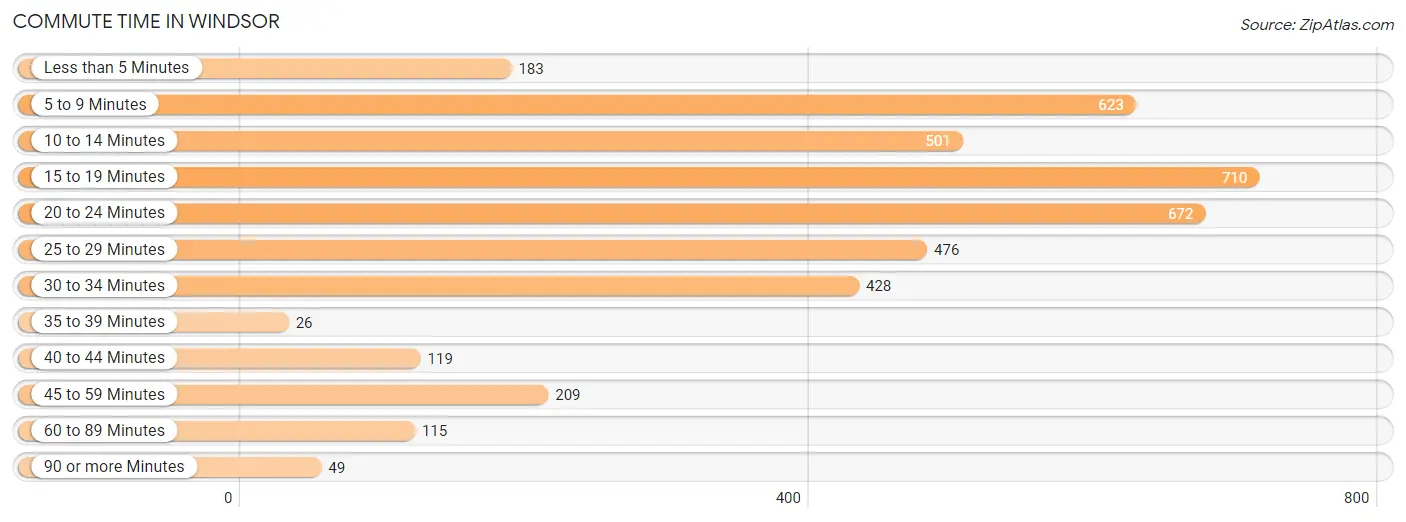
| Commute Time | # Commuters | % Commuters |
| Less than 5 Minutes | 183 | 4.4% |
| 5 to 9 Minutes | 623 | 15.1% |
| 10 to 14 Minutes | 501 | 12.2% |
| 15 to 19 Minutes | 710 | 17.3% |
| 20 to 24 Minutes | 672 | 16.4% |
| 25 to 29 Minutes | 476 | 11.6% |
| 30 to 34 Minutes | 428 | 10.4% |
| 35 to 39 Minutes | 26 | 0.6% |
| 40 to 44 Minutes | 119 | 2.9% |
| 45 to 59 Minutes | 209 | 5.1% |
| 60 to 89 Minutes | 115 | 2.8% |
| 90 or more Minutes | 49 | 1.2% |
Commute Time by Sex in Windsor
The most common commute times in Windsor are 20 to 24 minutes (464 commuters, 23.6%) for males and 15 to 19 minutes (477 commuters, 22.2%) for females.
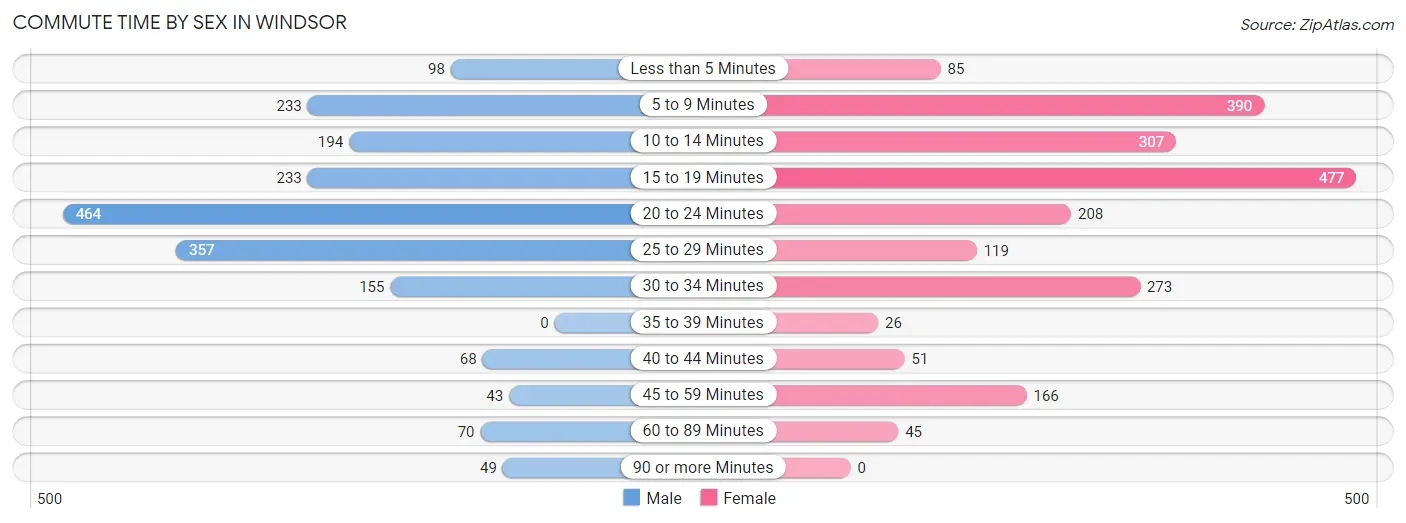
| Commute Time | Male | Female |
| Less than 5 Minutes | 98 (5.0%) | 85 (4.0%) |
| 5 to 9 Minutes | 233 (11.9%) | 390 (18.2%) |
| 10 to 14 Minutes | 194 (9.9%) | 307 (14.3%) |
| 15 to 19 Minutes | 233 (11.9%) | 477 (22.2%) |
| 20 to 24 Minutes | 464 (23.6%) | 208 (9.7%) |
| 25 to 29 Minutes | 357 (18.2%) | 119 (5.5%) |
| 30 to 34 Minutes | 155 (7.9%) | 273 (12.7%) |
| 35 to 39 Minutes | 0 (0.0%) | 26 (1.2%) |
| 40 to 44 Minutes | 68 (3.5%) | 51 (2.4%) |
| 45 to 59 Minutes | 43 (2.2%) | 166 (7.7%) |
| 60 to 89 Minutes | 70 (3.6%) | 45 (2.1%) |
| 90 or more Minutes | 49 (2.5%) | 0 (0.0%) |
Time of Departure to Work by Sex in Windsor
The most frequent times of departure to work in Windsor are 6:00 AM to 6:29 AM (379, 19.3%) for males and 7:00 AM to 7:29 AM (432, 20.1%) for females.
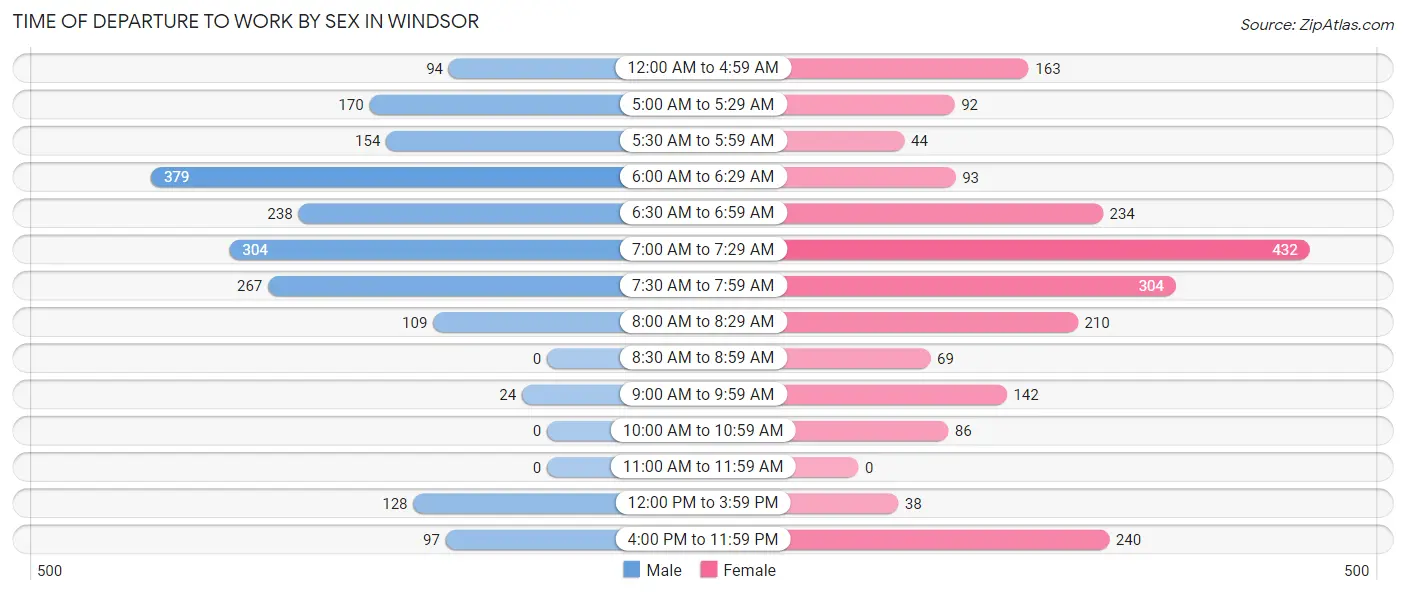
| Time of Departure | Male | Female |
| 12:00 AM to 4:59 AM | 94 (4.8%) | 163 (7.6%) |
| 5:00 AM to 5:29 AM | 170 (8.7%) | 92 (4.3%) |
| 5:30 AM to 5:59 AM | 154 (7.8%) | 44 (2.1%) |
| 6:00 AM to 6:29 AM | 379 (19.3%) | 93 (4.3%) |
| 6:30 AM to 6:59 AM | 238 (12.1%) | 234 (10.9%) |
| 7:00 AM to 7:29 AM | 304 (15.5%) | 432 (20.1%) |
| 7:30 AM to 7:59 AM | 267 (13.6%) | 304 (14.2%) |
| 8:00 AM to 8:29 AM | 109 (5.6%) | 210 (9.8%) |
| 8:30 AM to 8:59 AM | 0 (0.0%) | 69 (3.2%) |
| 9:00 AM to 9:59 AM | 24 (1.2%) | 142 (6.6%) |
| 10:00 AM to 10:59 AM | 0 (0.0%) | 86 (4.0%) |
| 11:00 AM to 11:59 AM | 0 (0.0%) | 0 (0.0%) |
| 12:00 PM to 3:59 PM | 128 (6.5%) | 38 (1.8%) |
| 4:00 PM to 11:59 PM | 97 (4.9%) | 240 (11.2%) |
| Total | 1,964 (100.0%) | 2,147 (100.0%) |
Housing Occupancy in Windsor
Occupancy by Ownership in Windsor
Of the total 3,186 dwellings in Windsor, owner-occupied units account for 2,353 (73.9%), while renter-occupied units make up 833 (26.2%).
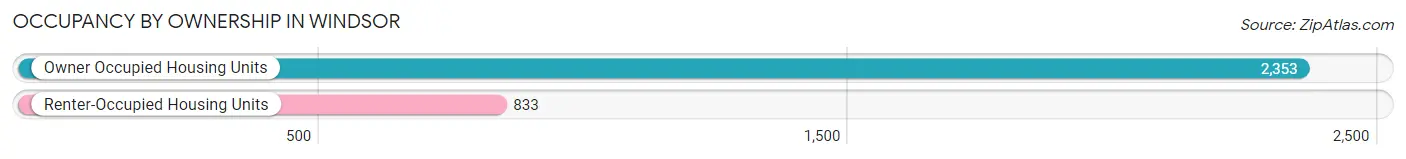
| Occupancy | # Housing Units | % Housing Units |
| Owner Occupied Housing Units | 2,353 | 73.9% |
| Renter-Occupied Housing Units | 833 | 26.2% |
| Total Occupied Housing Units | 3,186 | 100.0% |
Occupancy by Household Size in Windsor
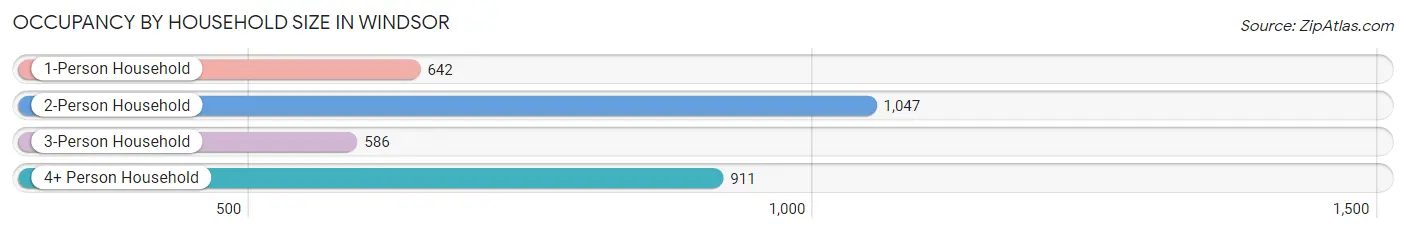
| Household Size | # Housing Units | % Housing Units |
| 1-Person Household | 642 | 20.2% |
| 2-Person Household | 1,047 | 32.9% |
| 3-Person Household | 586 | 18.4% |
| 4+ Person Household | 911 | 28.6% |
| Total Housing Units | 3,186 | 100.0% |
Occupancy by Ownership by Household Size in Windsor
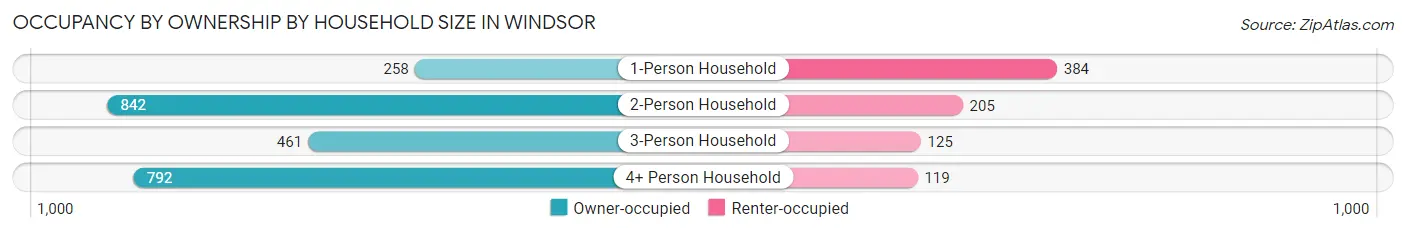
| Household Size | Owner-occupied | Renter-occupied |
| 1-Person Household | 258 (40.2%) | 384 (59.8%) |
| 2-Person Household | 842 (80.4%) | 205 (19.6%) |
| 3-Person Household | 461 (78.7%) | 125 (21.3%) |
| 4+ Person Household | 792 (86.9%) | 119 (13.1%) |
| Total Housing Units | 2,353 (73.9%) | 833 (26.2%) |
Occupancy by Educational Attainment in Windsor
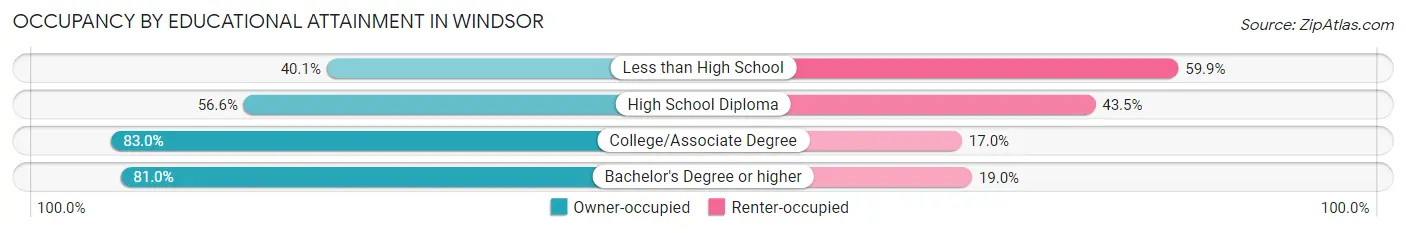
| Household Size | Owner-occupied | Renter-occupied |
| Less than High School | 81 (40.1%) | 121 (59.9%) |
| High School Diploma | 384 (56.6%) | 295 (43.4%) |
| College/Associate Degree | 864 (83.0%) | 177 (17.0%) |
| Bachelor's Degree or higher | 1,024 (81.0%) | 240 (19.0%) |
Occupancy by Age of Householder in Windsor
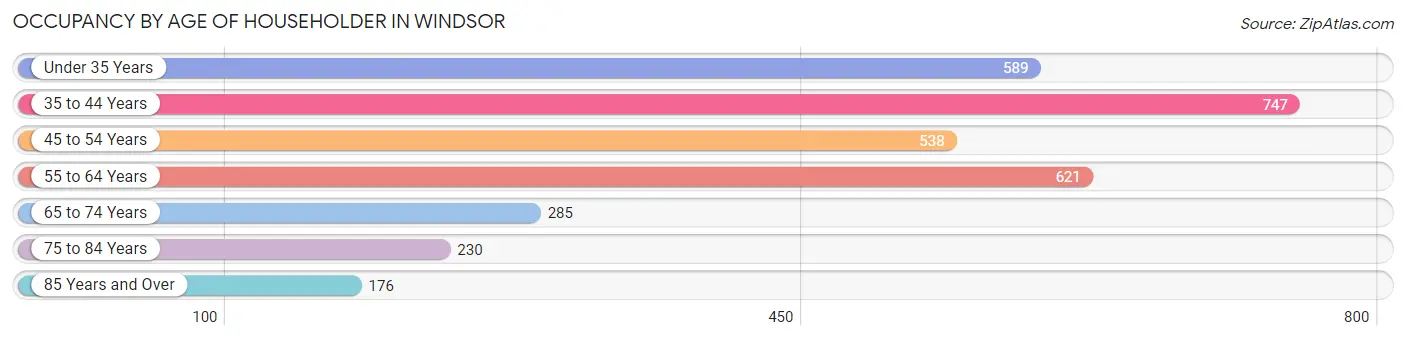
| Age Bracket | # Households | % Households |
| Under 35 Years | 589 | 18.5% |
| 35 to 44 Years | 747 | 23.4% |
| 45 to 54 Years | 538 | 16.9% |
| 55 to 64 Years | 621 | 19.5% |
| 65 to 74 Years | 285 | 8.9% |
| 75 to 84 Years | 230 | 7.2% |
| 85 Years and Over | 176 | 5.5% |
| Total | 3,186 | 100.0% |
Housing Finances in Windsor
Median Income by Occupancy in Windsor
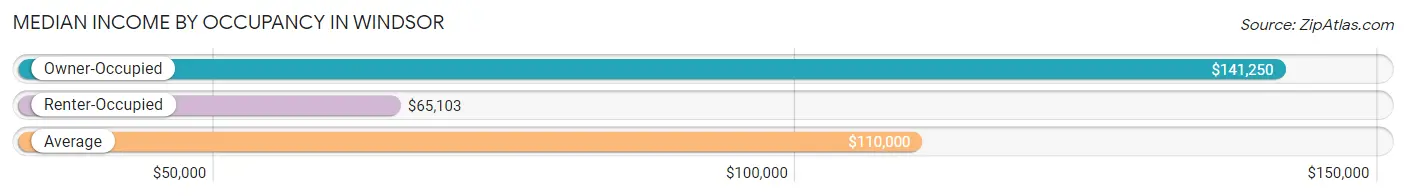
| Occupancy Type | # Households | Median Income |
| Owner-Occupied | 2,353 (73.9%) | $141,250 |
| Renter-Occupied | 833 (26.2%) | $65,103 |
| Average | 3,186 (100.0%) | $110,000 |
Occupancy by Householder Income Bracket in Windsor
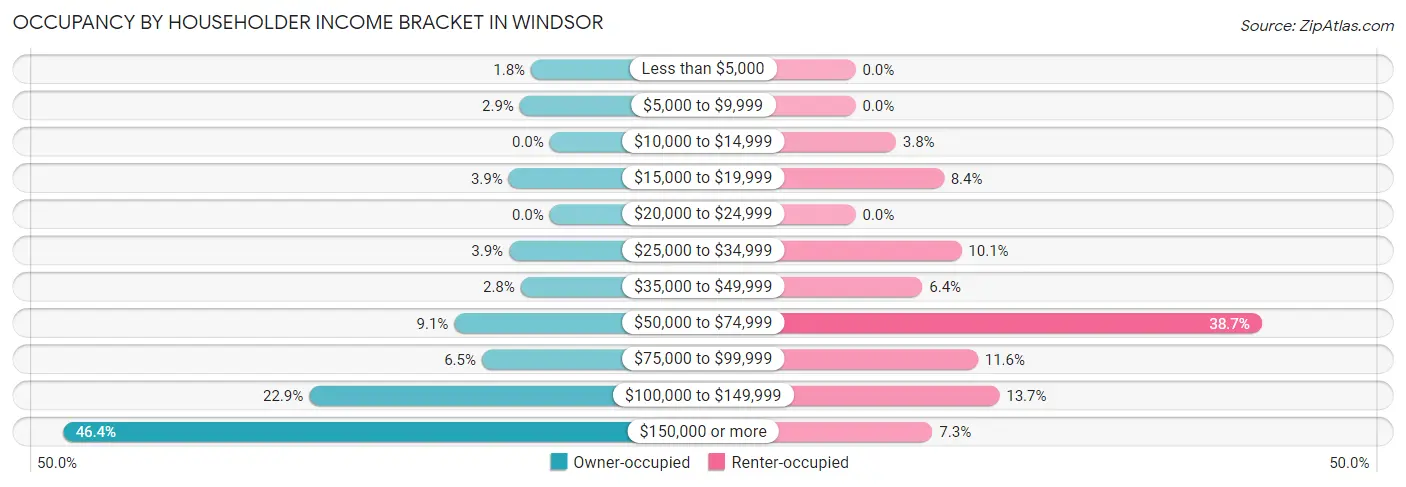
| Income Bracket | Owner-occupied | Renter-occupied |
| Less than $5,000 | 42 (1.8%) | 0 (0.0%) |
| $5,000 to $9,999 | 67 (2.9%) | 0 (0.0%) |
| $10,000 to $14,999 | 0 (0.0%) | 32 (3.8%) |
| $15,000 to $19,999 | 92 (3.9%) | 70 (8.4%) |
| $20,000 to $24,999 | 0 (0.0%) | 0 (0.0%) |
| $25,000 to $34,999 | 91 (3.9%) | 84 (10.1%) |
| $35,000 to $49,999 | 65 (2.8%) | 53 (6.4%) |
| $50,000 to $74,999 | 214 (9.1%) | 322 (38.7%) |
| $75,000 to $99,999 | 152 (6.5%) | 97 (11.6%) |
| $100,000 to $149,999 | 539 (22.9%) | 114 (13.7%) |
| $150,000 or more | 1,091 (46.4%) | 61 (7.3%) |
| Total | 2,353 (100.0%) | 833 (100.0%) |
Monthly Housing Cost Tiers in Windsor
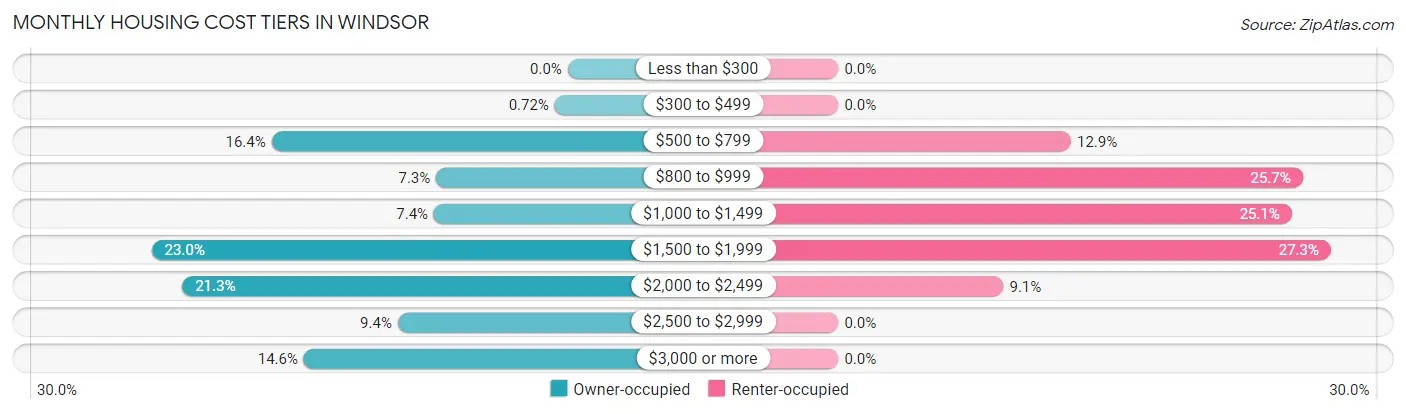
| Monthly Cost | Owner-occupied | Renter-occupied |
| Less than $300 | 0 (0.0%) | 0 (0.0%) |
| $300 to $499 | 17 (0.7%) | 0 (0.0%) |
| $500 to $799 | 385 (16.4%) | 107 (12.9%) |
| $800 to $999 | 171 (7.3%) | 214 (25.7%) |
| $1,000 to $1,499 | 174 (7.4%) | 209 (25.1%) |
| $1,500 to $1,999 | 541 (23.0%) | 227 (27.3%) |
| $2,000 to $2,499 | 501 (21.3%) | 76 (9.1%) |
| $2,500 to $2,999 | 221 (9.4%) | 0 (0.0%) |
| $3,000 or more | 343 (14.6%) | 0 (0.0%) |
| Total | 2,353 (100.0%) | 833 (100.0%) |
Physical Housing Characteristics in Windsor
Housing Structures in Windsor
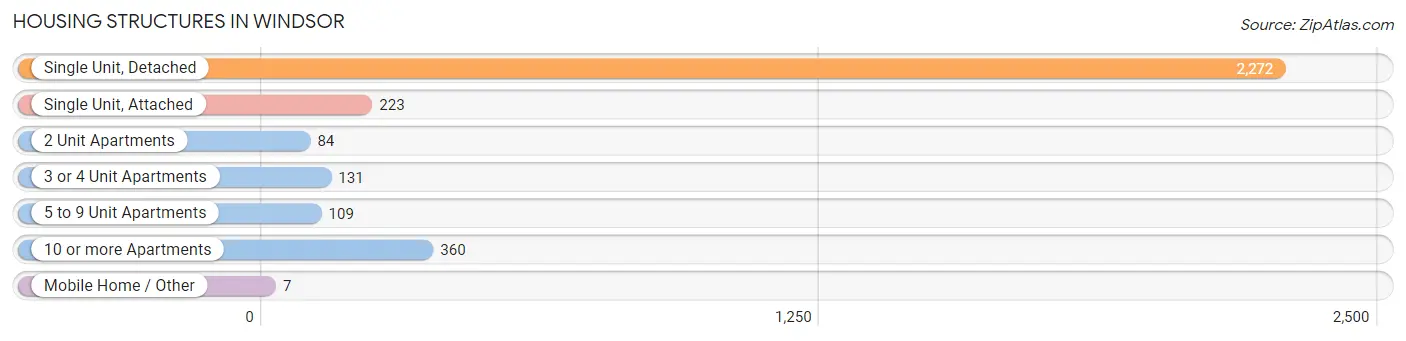
| Structure Type | # Housing Units | % Housing Units |
| Single Unit, Detached | 2,272 | 71.3% |
| Single Unit, Attached | 223 | 7.0% |
| 2 Unit Apartments | 84 | 2.6% |
| 3 or 4 Unit Apartments | 131 | 4.1% |
| 5 to 9 Unit Apartments | 109 | 3.4% |
| 10 or more Apartments | 360 | 11.3% |
| Mobile Home / Other | 7 | 0.2% |
| Total | 3,186 | 100.0% |
Housing Structures by Occupancy in Windsor
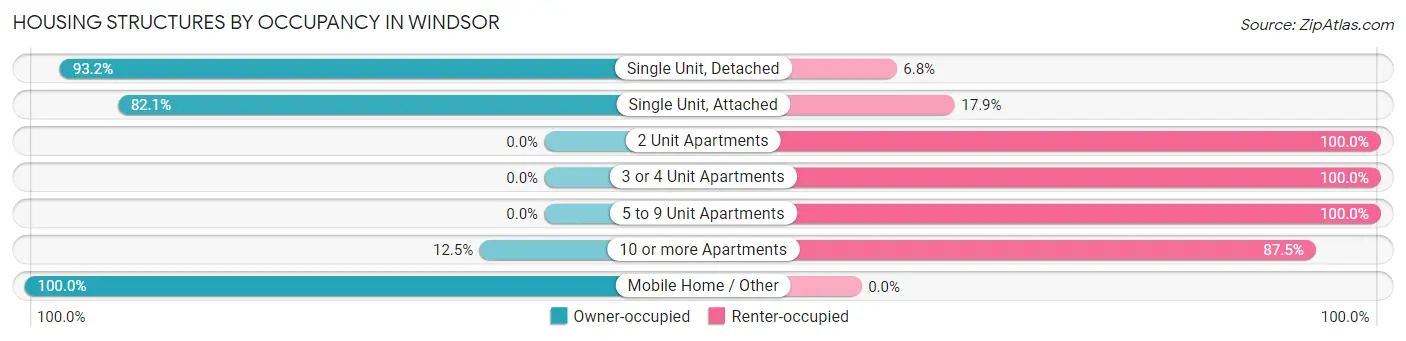
| Structure Type | Owner-occupied | Renter-occupied |
| Single Unit, Detached | 2,118 (93.2%) | 154 (6.8%) |
| Single Unit, Attached | 183 (82.1%) | 40 (17.9%) |
| 2 Unit Apartments | 0 (0.0%) | 84 (100.0%) |
| 3 or 4 Unit Apartments | 0 (0.0%) | 131 (100.0%) |
| 5 to 9 Unit Apartments | 0 (0.0%) | 109 (100.0%) |
| 10 or more Apartments | 45 (12.5%) | 315 (87.5%) |
| Mobile Home / Other | 7 (100.0%) | 0 (0.0%) |
| Total | 2,353 (73.9%) | 833 (26.2%) |
Housing Structures by Number of Rooms in Windsor
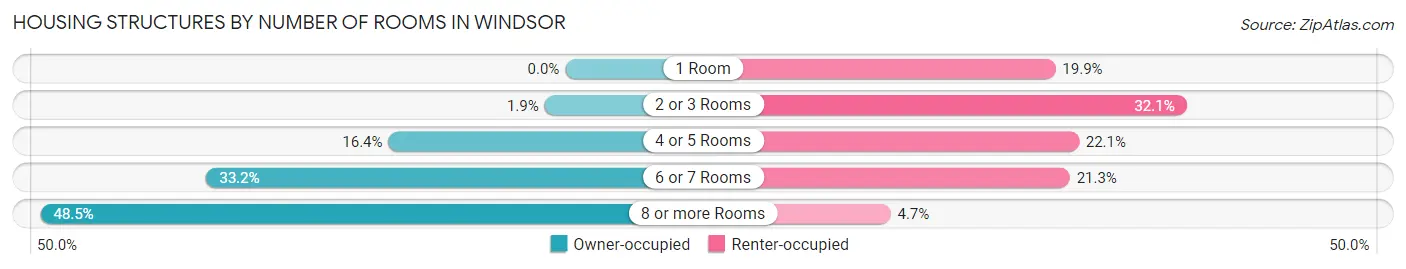
| Number of Rooms | Owner-occupied | Renter-occupied |
| 1 Room | 0 (0.0%) | 166 (19.9%) |
| 2 or 3 Rooms | 45 (1.9%) | 267 (32.1%) |
| 4 or 5 Rooms | 385 (16.4%) | 184 (22.1%) |
| 6 or 7 Rooms | 781 (33.2%) | 177 (21.2%) |
| 8 or more Rooms | 1,142 (48.5%) | 39 (4.7%) |
| Total | 2,353 (100.0%) | 833 (100.0%) |
Housing Structure by Heating Type in Windsor
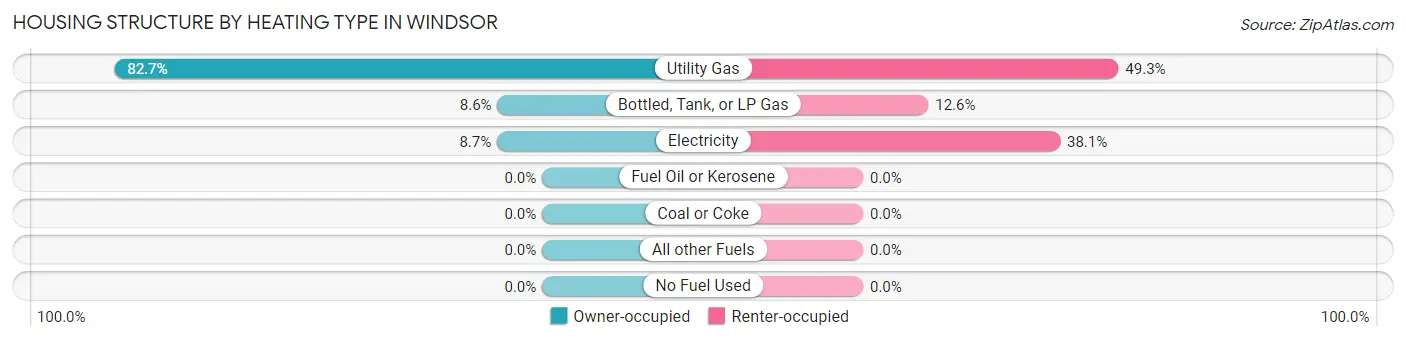
| Heating Type | Owner-occupied | Renter-occupied |
| Utility Gas | 1,945 (82.7%) | 411 (49.3%) |
| Bottled, Tank, or LP Gas | 203 (8.6%) | 105 (12.6%) |
| Electricity | 205 (8.7%) | 317 (38.1%) |
| Fuel Oil or Kerosene | 0 (0.0%) | 0 (0.0%) |
| Coal or Coke | 0 (0.0%) | 0 (0.0%) |
| All other Fuels | 0 (0.0%) | 0 (0.0%) |
| No Fuel Used | 0 (0.0%) | 0 (0.0%) |
| Total | 2,353 (100.0%) | 833 (100.0%) |
Household Vehicle Usage in Windsor
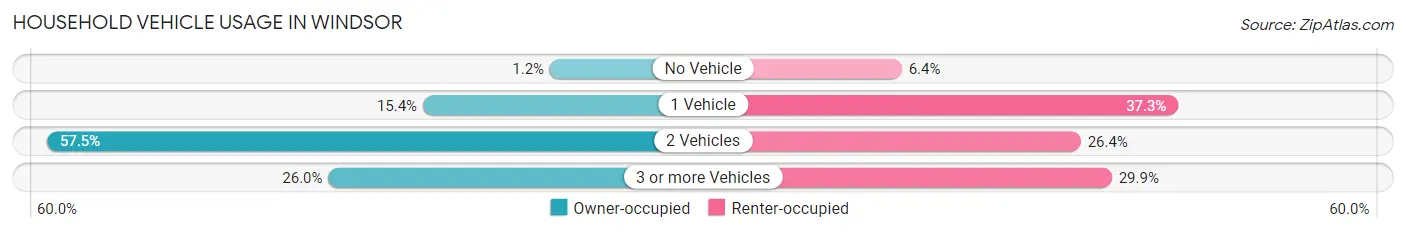
| Vehicles per Household | Owner-occupied | Renter-occupied |
| No Vehicle | 27 (1.1%) | 53 (6.4%) |
| 1 Vehicle | 362 (15.4%) | 311 (37.3%) |
| 2 Vehicles | 1,353 (57.5%) | 220 (26.4%) |
| 3 or more Vehicles | 611 (26.0%) | 249 (29.9%) |
| Total | 2,353 (100.0%) | 833 (100.0%) |
Real Estate & Mortgages in Windsor
Real Estate and Mortgage Overview in Windsor
| Characteristic | Without Mortgage | With Mortgage |
| Housing Units | 677 | 1,676 |
| Median Property Value | $297,800 | $396,300 |
| Median Household Income | $62,054 | $935 |
| Monthly Housing Costs | $737 | $343 |
| Real Estate Taxes | $5,646 | $0 |
Property Value by Mortgage Status in Windsor
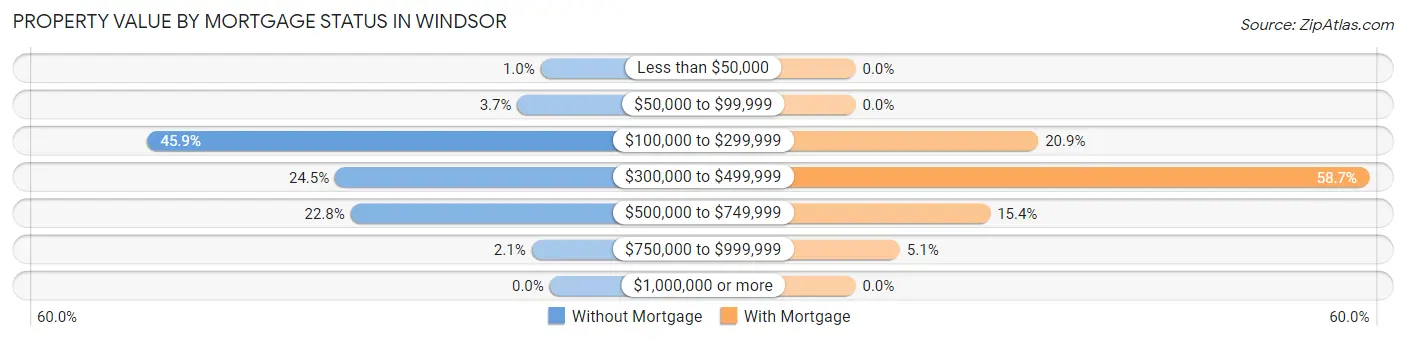
| Property Value | Without Mortgage | With Mortgage |
| Less than $50,000 | 7 (1.0%) | 0 (0.0%) |
| $50,000 to $99,999 | 25 (3.7%) | 0 (0.0%) |
| $100,000 to $299,999 | 311 (45.9%) | 350 (20.9%) |
| $300,000 to $499,999 | 166 (24.5%) | 983 (58.7%) |
| $500,000 to $749,999 | 154 (22.8%) | 258 (15.4%) |
| $750,000 to $999,999 | 14 (2.1%) | 85 (5.1%) |
| $1,000,000 or more | 0 (0.0%) | 0 (0.0%) |
| Total | 677 (100.0%) | 1,676 (100.0%) |
Household Income by Mortgage Status in Windsor
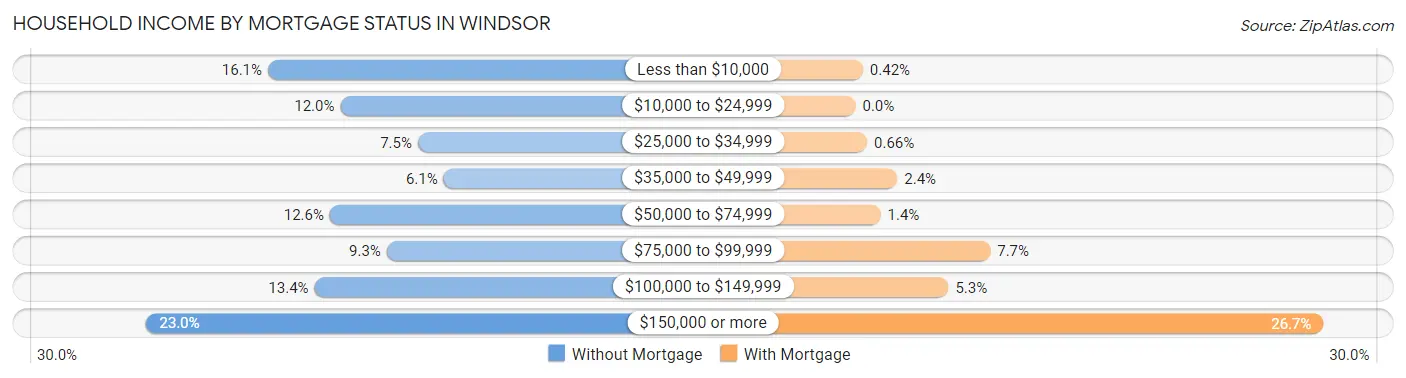
| Household Income | Without Mortgage | With Mortgage |
| Less than $10,000 | 109 (16.1%) | 7 (0.4%) |
| $10,000 to $24,999 | 81 (12.0%) | 0 (0.0%) |
| $25,000 to $34,999 | 51 (7.5%) | 11 (0.7%) |
| $35,000 to $49,999 | 41 (6.1%) | 40 (2.4%) |
| $50,000 to $74,999 | 85 (12.6%) | 24 (1.4%) |
| $75,000 to $99,999 | 63 (9.3%) | 129 (7.7%) |
| $100,000 to $149,999 | 91 (13.4%) | 89 (5.3%) |
| $150,000 or more | 156 (23.0%) | 448 (26.7%) |
| Total | 677 (100.0%) | 1,676 (100.0%) |
Property Value to Household Income Ratio in Windsor
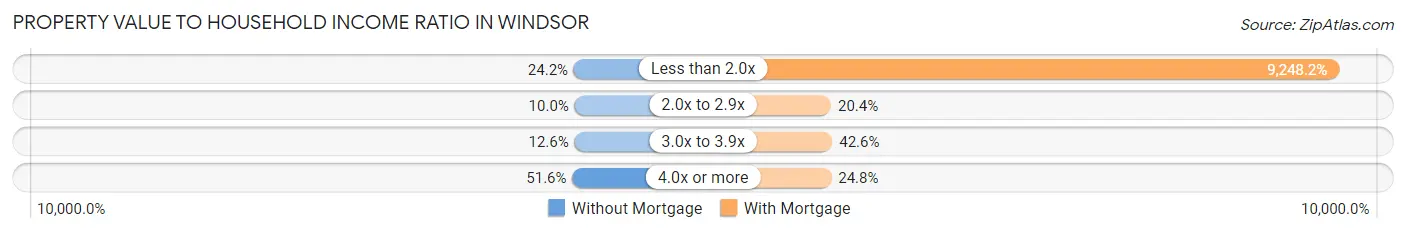
| Value-to-Income Ratio | Without Mortgage | With Mortgage |
| Less than 2.0x | 164 (24.2%) | 155,000 (9,248.2%) |
| 2.0x to 2.9x | 68 (10.0%) | 342 (20.4%) |
| 3.0x to 3.9x | 85 (12.6%) | 714 (42.6%) |
| 4.0x or more | 349 (51.5%) | 415 (24.8%) |
| Total | 677 (100.0%) | 1,676 (100.0%) |
Real Estate Taxes by Mortgage Status in Windsor
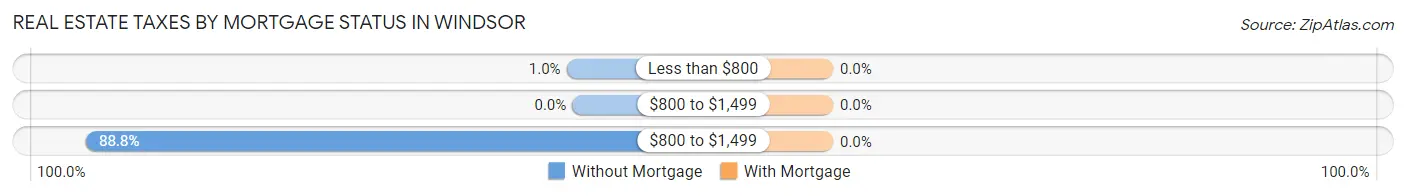
| Property Taxes | Without Mortgage | With Mortgage |
| Less than $800 | 7 (1.0%) | 0 (0.0%) |
| $800 to $1,499 | 0 (0.0%) | 0 (0.0%) |
| $800 to $1,499 | 601 (88.8%) | 0 (0.0%) |
| Total | 677 (100.0%) | 1,676 (100.0%) |
Health & Disability in Windsor
Health Insurance Coverage by Age in Windsor
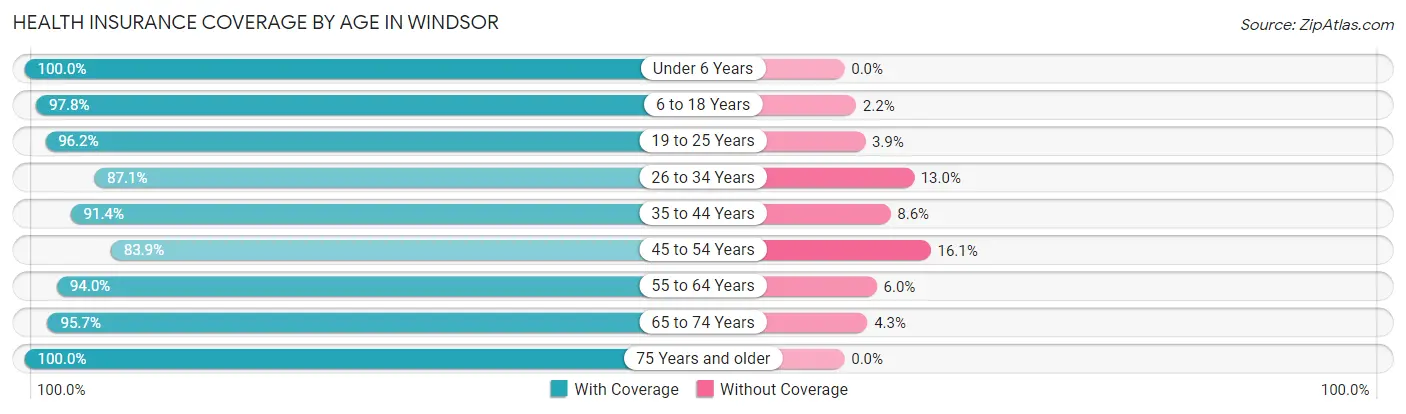
| Age Bracket | With Coverage | Without Coverage |
| Under 6 Years | 759 (100.0%) | 0 (0.0%) |
| 6 to 18 Years | 1,585 (97.8%) | 35 (2.2%) |
| 19 to 25 Years | 475 (96.2%) | 19 (3.8%) |
| 26 to 34 Years | 793 (87.1%) | 118 (13.0%) |
| 35 to 44 Years | 1,384 (91.4%) | 130 (8.6%) |
| 45 to 54 Years | 783 (83.9%) | 150 (16.1%) |
| 55 to 64 Years | 1,090 (94.0%) | 70 (6.0%) |
| 65 to 74 Years | 693 (95.7%) | 31 (4.3%) |
| 75 Years and older | 611 (100.0%) | 0 (0.0%) |
| Total | 8,173 (93.7%) | 553 (6.3%) |
Health Insurance Coverage by Citizenship Status in Windsor
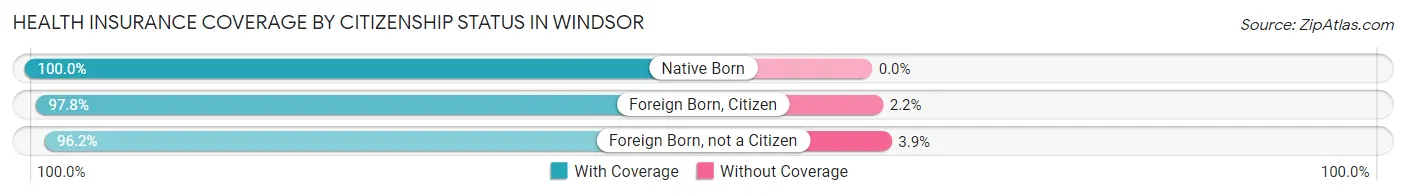
| Citizenship Status | With Coverage | Without Coverage |
| Native Born | 759 (100.0%) | 0 (0.0%) |
| Foreign Born, Citizen | 1,585 (97.8%) | 35 (2.2%) |
| Foreign Born, not a Citizen | 475 (96.2%) | 19 (3.8%) |
Health Insurance Coverage by Household Income in Windsor
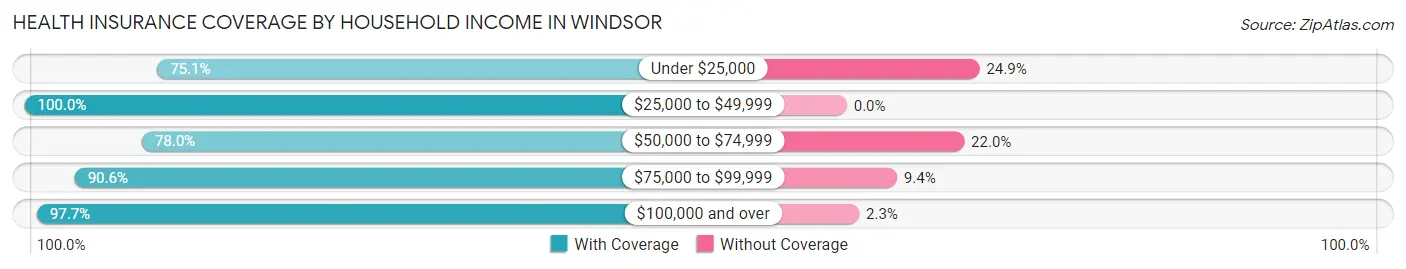
| Household Income | With Coverage | Without Coverage |
| Under $25,000 | 414 (75.1%) | 137 (24.9%) |
| $25,000 to $49,999 | 440 (100.0%) | 0 (0.0%) |
| $50,000 to $74,999 | 720 (78.0%) | 203 (22.0%) |
| $75,000 to $99,999 | 714 (90.6%) | 74 (9.4%) |
| $100,000 and over | 5,885 (97.7%) | 139 (2.3%) |
Public vs Private Health Insurance Coverage by Age in Windsor
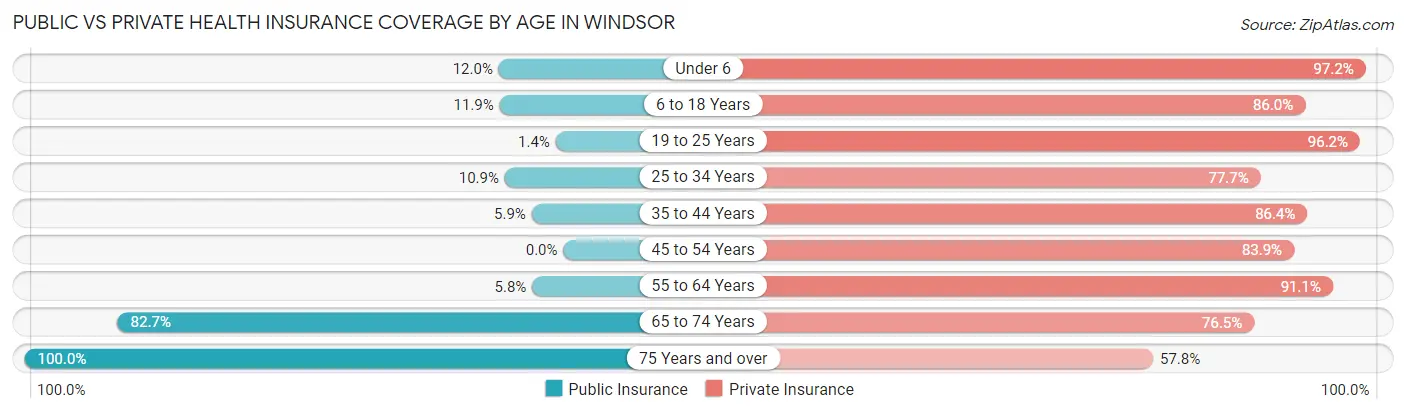
| Age Bracket | Public Insurance | Private Insurance |
| Under 6 | 91 (12.0%) | 738 (97.2%) |
| 6 to 18 Years | 192 (11.8%) | 1,393 (86.0%) |
| 19 to 25 Years | 7 (1.4%) | 475 (96.2%) |
| 25 to 34 Years | 99 (10.9%) | 708 (77.7%) |
| 35 to 44 Years | 89 (5.9%) | 1,308 (86.4%) |
| 45 to 54 Years | 0 (0.0%) | 783 (83.9%) |
| 55 to 64 Years | 67 (5.8%) | 1,057 (91.1%) |
| 65 to 74 Years | 599 (82.7%) | 554 (76.5%) |
| 75 Years and over | 611 (100.0%) | 353 (57.8%) |
| Total | 1,755 (20.1%) | 7,369 (84.5%) |
Disability Status by Sex by Age in Windsor
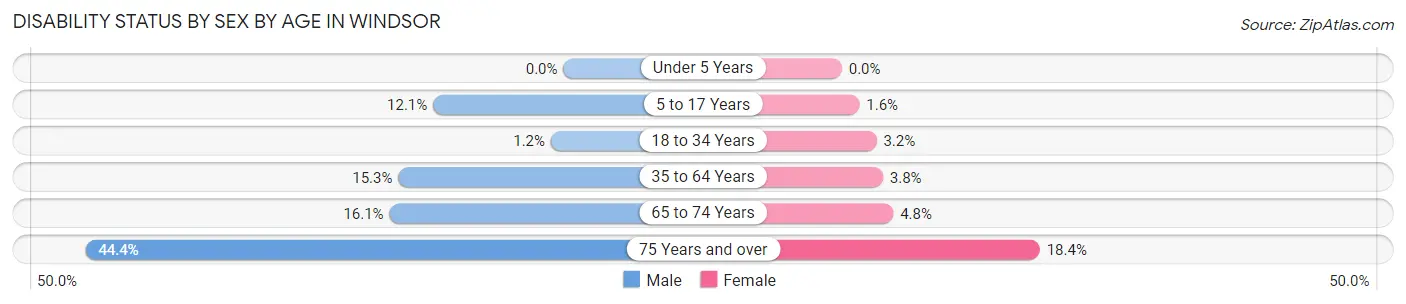
| Age Bracket | Male | Female |
| Under 5 Years | 0 (0.0%) | 0 (0.0%) |
| 5 to 17 Years | 96 (12.1%) | 13 (1.6%) |
| 18 to 34 Years | 7 (1.2%) | 30 (3.2%) |
| 35 to 64 Years | 279 (15.3%) | 68 (3.8%) |
| 65 to 74 Years | 56 (16.1%) | 18 (4.8%) |
| 75 Years and over | 102 (44.4%) | 70 (18.4%) |
Disability Class by Sex by Age in Windsor
Disability Class: Hearing Difficulty
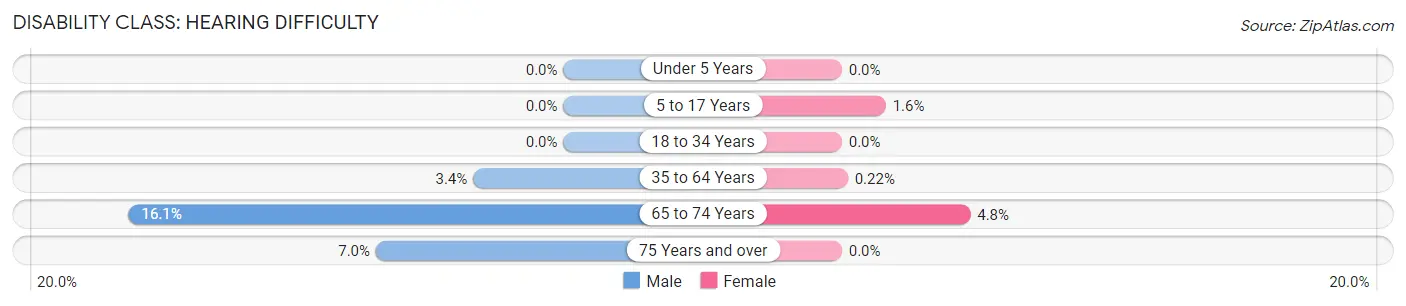
| Age Bracket | Male | Female |
| Under 5 Years | 0 (0.0%) | 0 (0.0%) |
| 5 to 17 Years | 0 (0.0%) | 13 (1.6%) |
| 18 to 34 Years | 0 (0.0%) | 0 (0.0%) |
| 35 to 64 Years | 61 (3.4%) | 4 (0.2%) |
| 65 to 74 Years | 56 (16.1%) | 18 (4.8%) |
| 75 Years and over | 16 (7.0%) | 0 (0.0%) |
Disability Class: Vision Difficulty
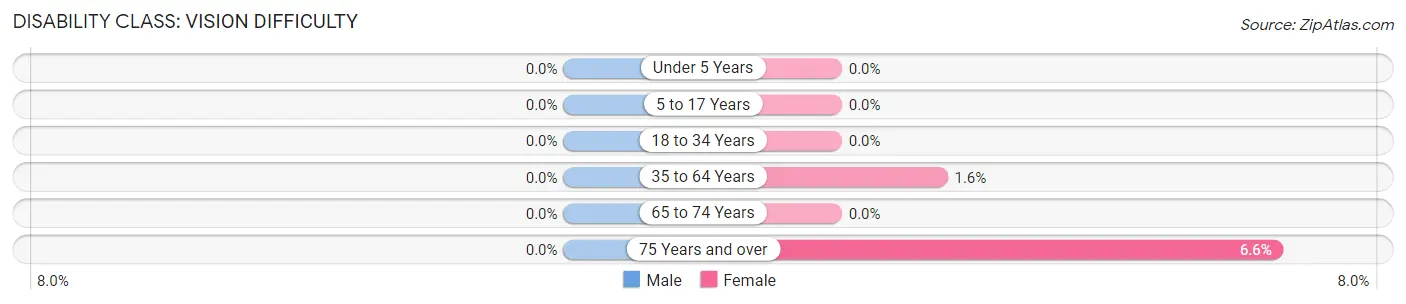
| Age Bracket | Male | Female |
| Under 5 Years | 0 (0.0%) | 0 (0.0%) |
| 5 to 17 Years | 0 (0.0%) | 0 (0.0%) |
| 18 to 34 Years | 0 (0.0%) | 0 (0.0%) |
| 35 to 64 Years | 0 (0.0%) | 28 (1.6%) |
| 65 to 74 Years | 0 (0.0%) | 0 (0.0%) |
| 75 Years and over | 0 (0.0%) | 25 (6.6%) |
Disability Class: Cognitive Difficulty
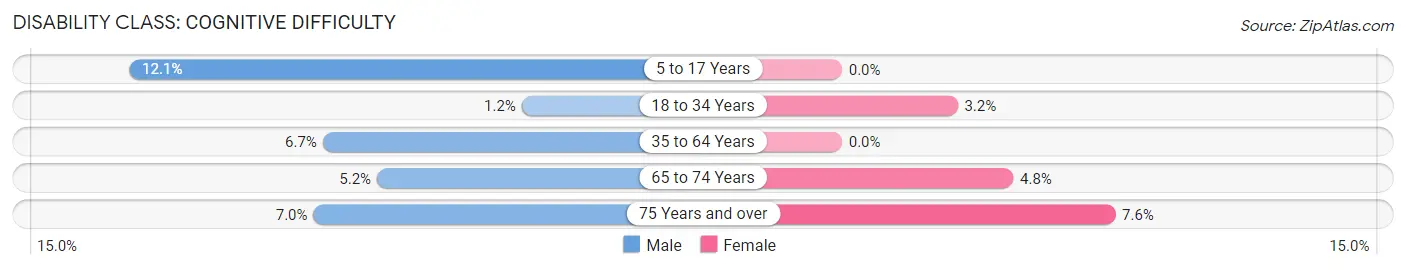
| Age Bracket | Male | Female |
| 5 to 17 Years | 96 (12.1%) | 0 (0.0%) |
| 18 to 34 Years | 7 (1.2%) | 30 (3.2%) |
| 35 to 64 Years | 122 (6.7%) | 0 (0.0%) |
| 65 to 74 Years | 18 (5.2%) | 18 (4.8%) |
| 75 Years and over | 16 (7.0%) | 29 (7.6%) |
Disability Class: Ambulatory Difficulty
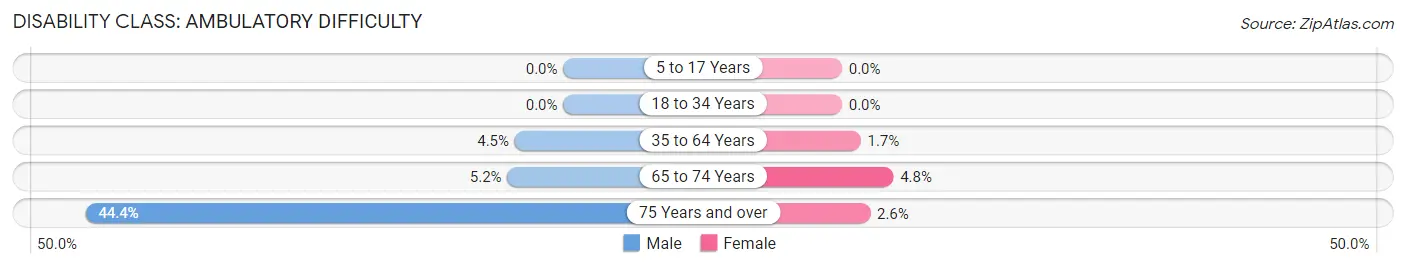
| Age Bracket | Male | Female |
| 5 to 17 Years | 0 (0.0%) | 0 (0.0%) |
| 18 to 34 Years | 0 (0.0%) | 0 (0.0%) |
| 35 to 64 Years | 82 (4.5%) | 31 (1.7%) |
| 65 to 74 Years | 18 (5.2%) | 18 (4.8%) |
| 75 Years and over | 102 (44.4%) | 10 (2.6%) |
Disability Class: Self-Care Difficulty
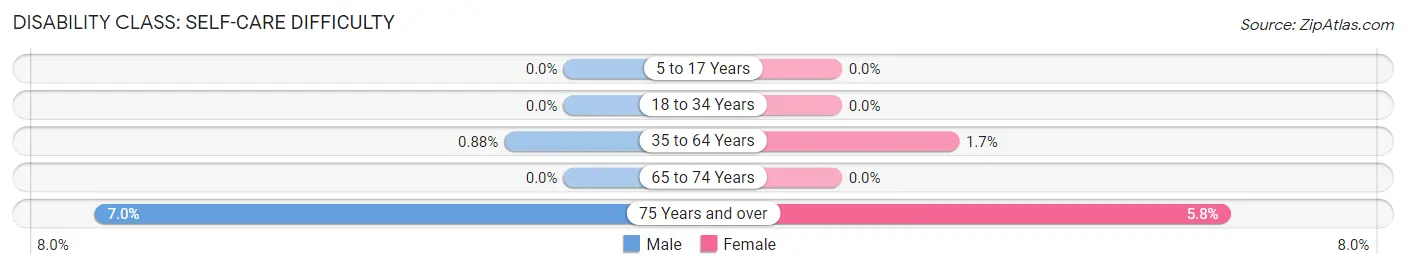
| Age Bracket | Male | Female |
| 5 to 17 Years | 0 (0.0%) | 0 (0.0%) |
| 18 to 34 Years | 0 (0.0%) | 0 (0.0%) |
| 35 to 64 Years | 16 (0.9%) | 31 (1.7%) |
| 65 to 74 Years | 0 (0.0%) | 0 (0.0%) |
| 75 Years and over | 16 (7.0%) | 22 (5.8%) |
Technology Access in Windsor
Computing Device Access in Windsor
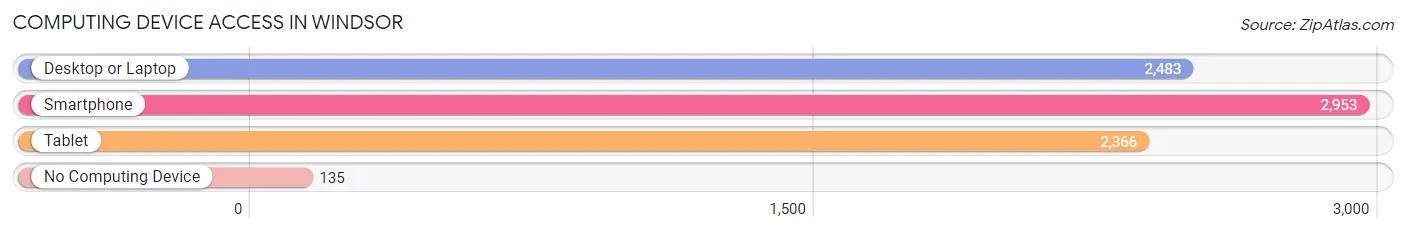
| Device Type | # Households | % Households |
| Desktop or Laptop | 2,483 | 77.9% |
| Smartphone | 2,953 | 92.7% |
| Tablet | 2,366 | 74.3% |
| No Computing Device | 135 | 4.2% |
| Total | 3,186 | 100.0% |
Internet Access in Windsor
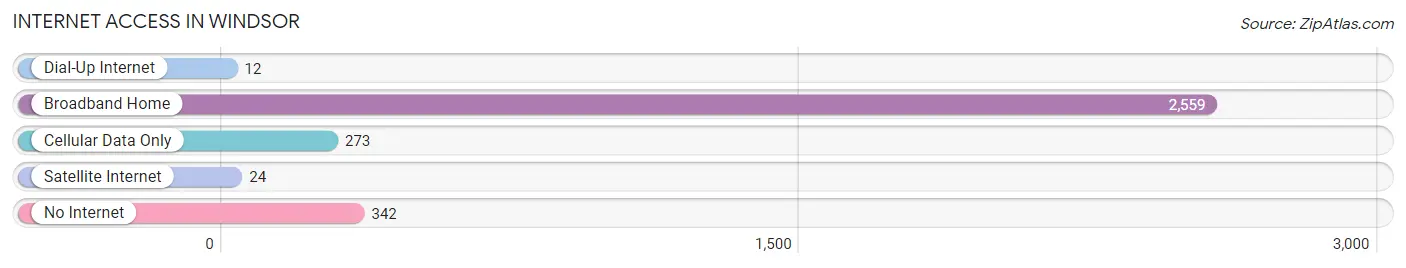
| Internet Type | # Households | % Households |
| Dial-Up Internet | 12 | 0.4% |
| Broadband Home | 2,559 | 80.3% |
| Cellular Data Only | 273 | 8.6% |
| Satellite Internet | 24 | 0.7% |
| No Internet | 342 | 10.7% |
| Total | 3,186 | 100.0% |
Windsor Summary
Windsor, Wisconsin is a small town located in the southeastern corner of the state, just north of the Illinois border. It is part of the Madison Metropolitan Statistical Area and is home to a population of approximately 4,000 people. The town was founded in 1848 and has a rich history of farming, industry, and commerce.
Geography
Windsor is located in the southeastern corner of Wisconsin, just north of the Illinois border. It is part of the Madison Metropolitan Statistical Area and is bordered by the towns of DeForest, Sun Prairie, and Marshall. The town is situated on the banks of the Crawfish River, which flows through the center of town. The terrain is mostly flat, with some rolling hills in the northern part of the town. The town is located in the Central Plain region of Wisconsin, which is characterized by flat terrain and fertile soils.
Economy
Windsor’s economy is largely based on agriculture and manufacturing. The town is home to several large farms, which produce a variety of crops, including corn, soybeans, and wheat. The town is also home to several manufacturing companies, including a paper mill, a plastics factory, and a metal fabrication plant. In addition, the town is home to several small businesses, including restaurants, retail stores, and service providers.
Demographics
As of the 2010 census, Windsor had a population of 4,000 people. The racial makeup of the town was 94.2% White, 0.7% African American, 0.3% Native American, 0.7% Asian, 0.1% Pacific Islander, and 3.9% from other races. The median household income was $50,000, and the median family income was $60,000. The town’s population is largely made up of families, with the majority of households having children under the age of 18.
History
Windsor was founded in 1848 by a group of settlers from New York. The town was originally named “Windsorville” after the town of Windsor, New York. The town was incorporated in 1856 and was named after the Duke of Windsor. The town quickly grew and became a center of commerce and industry. The town was home to several mills, including a paper mill, a flour mill, and a sawmill. The town also had a large agricultural industry, with several large farms producing a variety of crops.
In the late 19th century, the town was home to several large factories, including a shoe factory, a furniture factory, and a canning factory. The town also had a large railroad industry, with several lines running through the town. The town was also home to several banks, stores, and other businesses.
In the early 20th century, the town’s economy shifted from agriculture and industry to tourism. The town was home to several resorts, including the Windsor Hotel and the Windsor Beach Resort. The town also had several amusement parks, including the Windsor Amusement Park and the Windsor Water Park.
Today, Windsor is a small town with a population of approximately 4,000 people. The town is still home to several farms and manufacturing companies, but the economy is largely based on tourism. The town is home to several restaurants, retail stores, and service providers. The town is also home to several parks and recreational areas, including the Crawfish River Park and the Windsor Nature Preserve.
Common Questions
What is Per Capita Income in Windsor?
Per Capita income in Windsor is $48,087.
What is the Median Family Income in Windsor?
Median Family Income in Windsor is $142,750.
What is the Median Household income in Windsor?
Median Household Income in Windsor is $110,000.
What is Income or Wage Gap in Windsor?
Income or Wage Gap in Windsor is 26.6%.
Women in Windsor earn 73.4 cents for every dollar earned by a man.
What is Inequality or Gini Index in Windsor?
Inequality or Gini Index in Windsor is 0.39.
What is the Total Population of Windsor?
Total Population of Windsor is 8,756.
What is the Total Male Population of Windsor?
Total Male Population of Windsor is 4,127.
What is the Total Female Population of Windsor?
Total Female Population of Windsor is 4,629.
What is the Ratio of Males per 100 Females in Windsor?
There are 89.16 Males per 100 Females in Windsor.
What is the Ratio of Females per 100 Males in Windsor?
There are 112.16 Females per 100 Males in Windsor.
What is the Median Population Age in Windsor?
Median Population Age in Windsor is 38.5 Years.
What is the Average Family Size in Windsor
Average Family Size in Windsor is 3.3 People.
What is the Average Household Size in Windsor
Average Household Size in Windsor is 2.8 People.
How Large is the Labor Force in Windsor?
There are 5,183 People in the Labor Forcein in Windsor.
What is the Percentage of People in the Labor Force in Windsor?
77.0% of People are in the Labor Force in Windsor.
What is the Unemployment Rate in Windsor?
Unemployment Rate in Windsor is 2.0%.