Baraboo, WI Map & Demographics
Baraboo Map
Baraboo Overview
$35,847
PER CAPITA INCOME
$85,819
AVG FAMILY INCOME
$66,592
AVG HOUSEHOLD INCOME
16.5%
WAGE / INCOME GAP [ % ]
83.5¢/ $1
WAGE / INCOME GAP [ $ ]
$10,030
FAMILY INCOME DEFICIT
0.38
INEQUALITY / GINI INDEX
12,541
TOTAL POPULATION
6,187
MALE POPULATION
6,354
FEMALE POPULATION
97.37
MALES / 100 FEMALES
102.70
FEMALES / 100 MALES
40.6
MEDIAN AGE
2.7
AVG FAMILY SIZE
2.1
AVG HOUSEHOLD SIZE
6,974
LABOR FORCE [ PEOPLE ]
66.2%
PERCENT IN LABOR FORCE
5.7%
UNEMPLOYMENT RATE
Baraboo Zip Codes
Baraboo Area Codes
Income in Baraboo
Income Overview in Baraboo
Per Capita Income in Baraboo is $35,847, while median incomes of families and households are $85,819 and $66,592 respectively.
| Characteristic | Number | Measure |
| Per Capita Income | 12,541 | $35,847 |
| Median Family Income | 3,283 | $85,819 |
| Mean Family Income | 3,283 | $95,690 |
| Median Household Income | 5,727 | $66,592 |
| Mean Household Income | 5,727 | $78,120 |
| Income Deficit | 3,283 | $10,030 |
| Wage / Income Gap (%) | 12,541 | 16.54% |
| Wage / Income Gap ($) | 12,541 | 83.46¢ per $1 |
| Gini / Inequality Index | 12,541 | 0.38 |
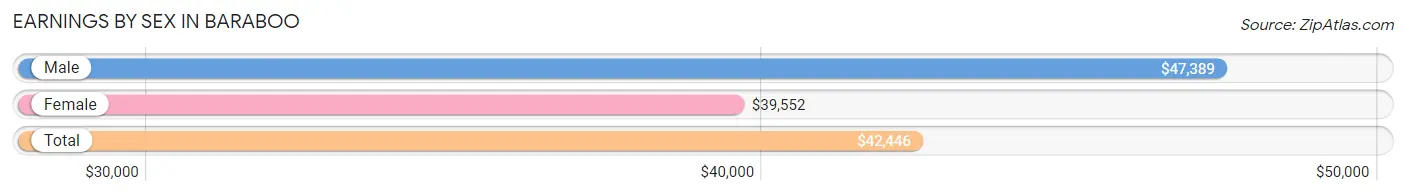
Earnings by Sex in Baraboo
Average Earnings in Baraboo are $42,446, $47,389 for men and $39,552 for women, a difference of 16.5%.
| Sex | Number | Average Earnings |
| Male | 4,001 (54.4%) | $47,389 |
| Female | 3,351 (45.6%) | $39,552 |
| Total | 7,352 (100.0%) | $42,446 |
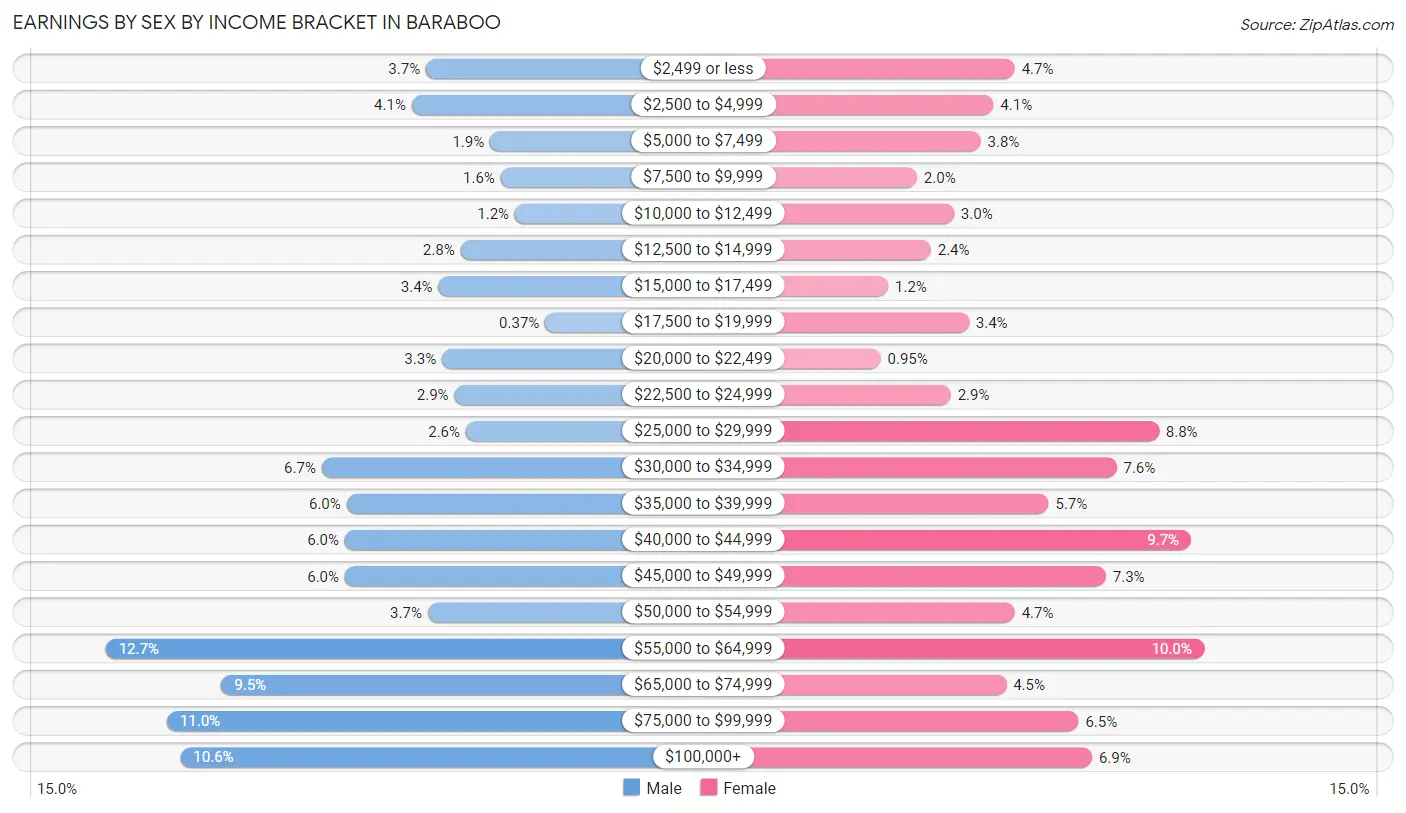
Earnings by Sex by Income Bracket in Baraboo
The most common earnings brackets in Baraboo are $55,000 to $64,999 for men (509 | 12.7%) and $55,000 to $64,999 for women (336 | 10.0%).
| Income | Male | Female |
| $2,499 or less | 149 (3.7%) | 158 (4.7%) |
| $2,500 to $4,999 | 165 (4.1%) | 138 (4.1%) |
| $5,000 to $7,499 | 77 (1.9%) | 126 (3.8%) |
| $7,500 to $9,999 | 65 (1.6%) | 66 (2.0%) |
| $10,000 to $12,499 | 49 (1.2%) | 101 (3.0%) |
| $12,500 to $14,999 | 110 (2.8%) | 79 (2.4%) |
| $15,000 to $17,499 | 135 (3.4%) | 39 (1.2%) |
| $17,500 to $19,999 | 15 (0.4%) | 115 (3.4%) |
| $20,000 to $22,499 | 131 (3.3%) | 32 (0.9%) |
| $22,500 to $24,999 | 117 (2.9%) | 98 (2.9%) |
| $25,000 to $29,999 | 104 (2.6%) | 294 (8.8%) |
| $30,000 to $34,999 | 266 (6.7%) | 254 (7.6%) |
| $35,000 to $39,999 | 238 (5.9%) | 190 (5.7%) |
| $40,000 to $44,999 | 240 (6.0%) | 324 (9.7%) |
| $45,000 to $49,999 | 240 (6.0%) | 244 (7.3%) |
| $50,000 to $54,999 | 147 (3.7%) | 158 (4.7%) |
| $55,000 to $64,999 | 509 (12.7%) | 336 (10.0%) |
| $65,000 to $74,999 | 379 (9.5%) | 150 (4.5%) |
| $75,000 to $99,999 | 440 (11.0%) | 218 (6.5%) |
| $100,000+ | 425 (10.6%) | 231 (6.9%) |
| Total | 4,001 (100.0%) | 3,351 (100.0%) |
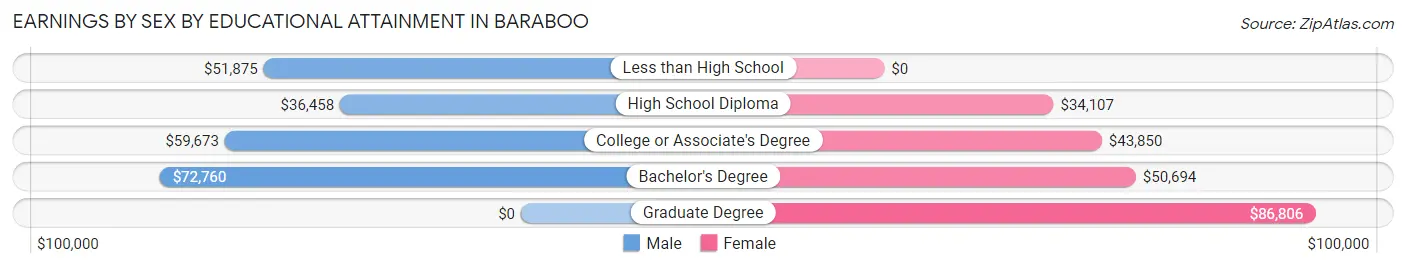
Earnings by Sex by Educational Attainment in Baraboo
Average earnings in Baraboo are $55,514 for men and $42,827 for women, a difference of 22.9%. Men with an educational attainment of bachelor's degree enjoy the highest average annual earnings of $72,760, while those with high school diploma education earn the least with $36,458. Women with an educational attainment of graduate degree earn the most with the average annual earnings of $86,806, while those with high school diploma education have the smallest earnings of $34,107.
| Educational Attainment | Male Income | Female Income |
| Less than High School | $51,875 | $0 |
| High School Diploma | $36,458 | $34,107 |
| College or Associate's Degree | $59,673 | $43,850 |
| Bachelor's Degree | $72,760 | $50,694 |
| Graduate Degree | - | - |
| Total | $55,514 | $42,827 |
Family Income in Baraboo
Family Income Brackets in Baraboo
According to the Baraboo family income data, there are 903 families falling into the $100,000 to $149,999 income range, which is the most common income bracket and makes up 27.5% of all families. Conversely, the $10,000 to $14,999 income bracket is the least frequent group with only 36 families (1.1%) belonging to this category.
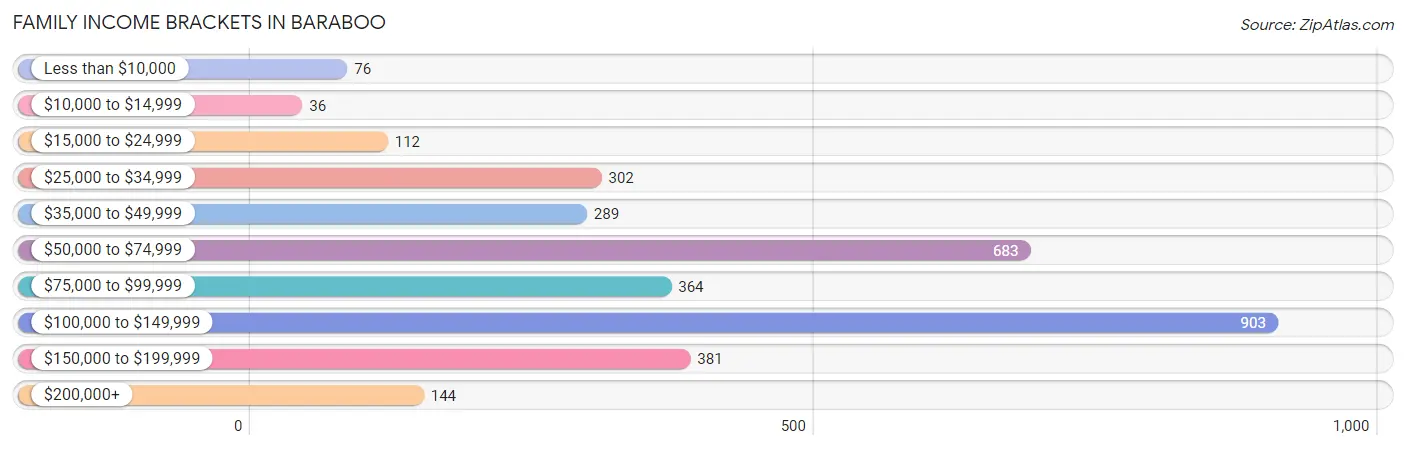
| Income Bracket | # Families | % Families |
| Less than $10,000 | 76 | 2.3% |
| $10,000 to $14,999 | 36 | 1.1% |
| $15,000 to $24,999 | 112 | 3.4% |
| $25,000 to $34,999 | 302 | 9.2% |
| $35,000 to $49,999 | 289 | 8.8% |
| $50,000 to $74,999 | 683 | 20.8% |
| $75,000 to $99,999 | 364 | 11.1% |
| $100,000 to $149,999 | 903 | 27.5% |
| $150,000 to $199,999 | 381 | 11.6% |
| $200,000+ | 144 | 4.4% |
Family Income by Famaliy Size in Baraboo
4-person families (439 | 13.4%) account for the highest median family income in Baraboo with $113,477 per family, while 3-person families (816 | 24.9%) have the highest median income of $35,964 per family member.
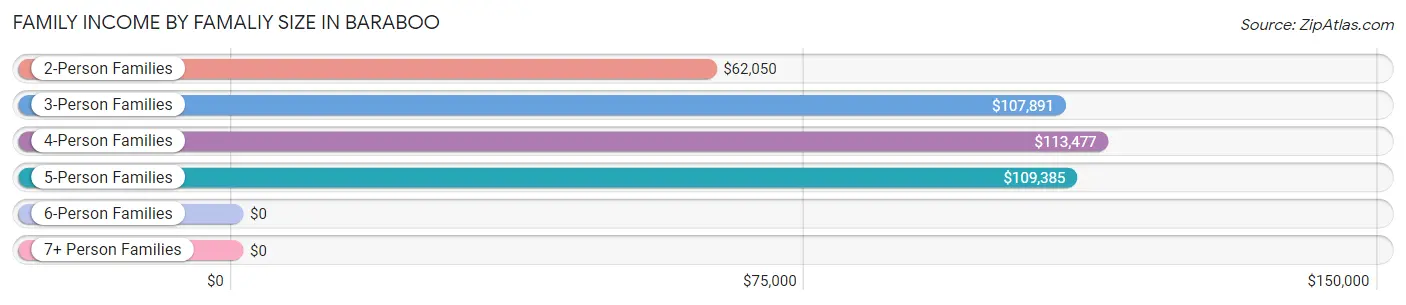
| Income Bracket | # Families | Median Income |
| 2-Person Families | 1,805 (55.0%) | $62,050 |
| 3-Person Families | 816 (24.9%) | $107,891 |
| 4-Person Families | 439 (13.4%) | $113,477 |
| 5-Person Families | 193 (5.9%) | $109,385 |
| 6-Person Families | 30 (0.9%) | $0 |
| 7+ Person Families | 0 (0.0%) | $0 |
| Total | 3,283 (100.0%) | $85,819 |
Family Income by Number of Earners in Baraboo
The median family income in Baraboo is $85,819, with families comprising 3+ earners (317) having the highest median family income of $164,432, while families with 1 earner (1,116) have the lowest median family income of $53,657, accounting for 9.7% and 34.0% of families, respectively.
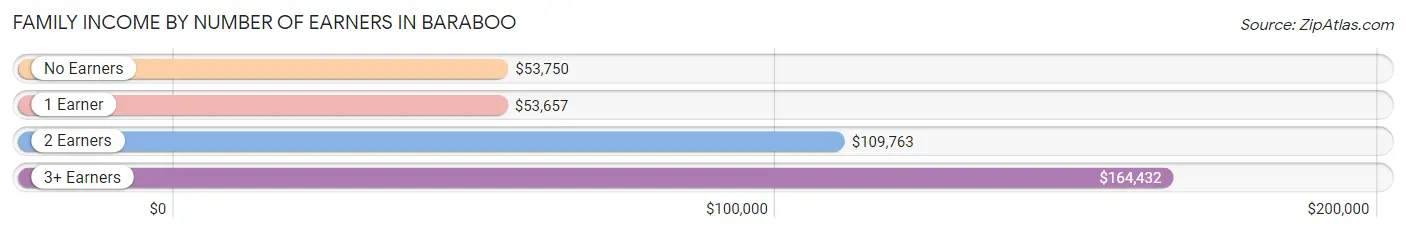
| Number of Earners | # Families | Median Income |
| No Earners | 409 (12.5%) | $53,750 |
| 1 Earner | 1,116 (34.0%) | $53,657 |
| 2 Earners | 1,441 (43.9%) | $109,763 |
| 3+ Earners | 317 (9.7%) | $164,432 |
| Total | 3,283 (100.0%) | $85,819 |
Household Income in Baraboo
Household Income Brackets in Baraboo
With 1,357 households falling in the category, the $50,000 to $74,999 income range is the most frequent in Baraboo, accounting for 23.7% of all households. In contrast, only 143 households (2.5%) fall into the less than $10,000 income bracket, making it the least populous group.

| Income Bracket | # Households | % Households |
| Less than $10,000 | 143 | 2.5% |
| $10,000 to $14,999 | 241 | 4.2% |
| $15,000 to $24,999 | 527 | 9.2% |
| $25,000 to $34,999 | 458 | 8.0% |
| $35,000 to $49,999 | 716 | 12.5% |
| $50,000 to $74,999 | 1,357 | 23.7% |
| $75,000 to $99,999 | 538 | 9.4% |
| $100,000 to $149,999 | 1,145 | 20.0% |
| $150,000 to $199,999 | 441 | 7.7% |
| $200,000+ | 160 | 2.8% |
Household Income by Householder Age in Baraboo
The median household income in Baraboo is $66,592, with the highest median household income of $83,152 found in the 45 to 64 years age bracket for the primary householder. A total of 1,908 households (33.3%) fall into this category. Meanwhile, the 15 to 24 years age bracket for the primary householder has the lowest median household income of $26,741, with 227 households (4.0%) in this group.
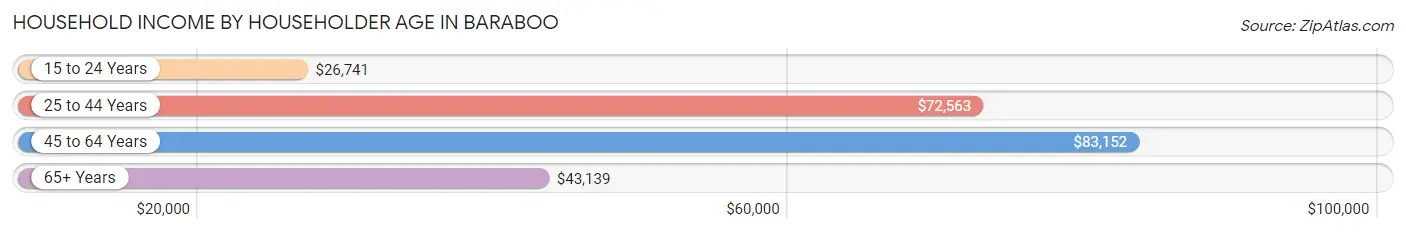
| Income Bracket | # Households | Median Income |
| 15 to 24 Years | 227 (4.0%) | $26,741 |
| 25 to 44 Years | 2,003 (35.0%) | $72,563 |
| 45 to 64 Years | 1,908 (33.3%) | $83,152 |
| 65+ Years | 1,589 (27.8%) | $43,139 |
| Total | 5,727 (100.0%) | $66,592 |
Poverty in Baraboo
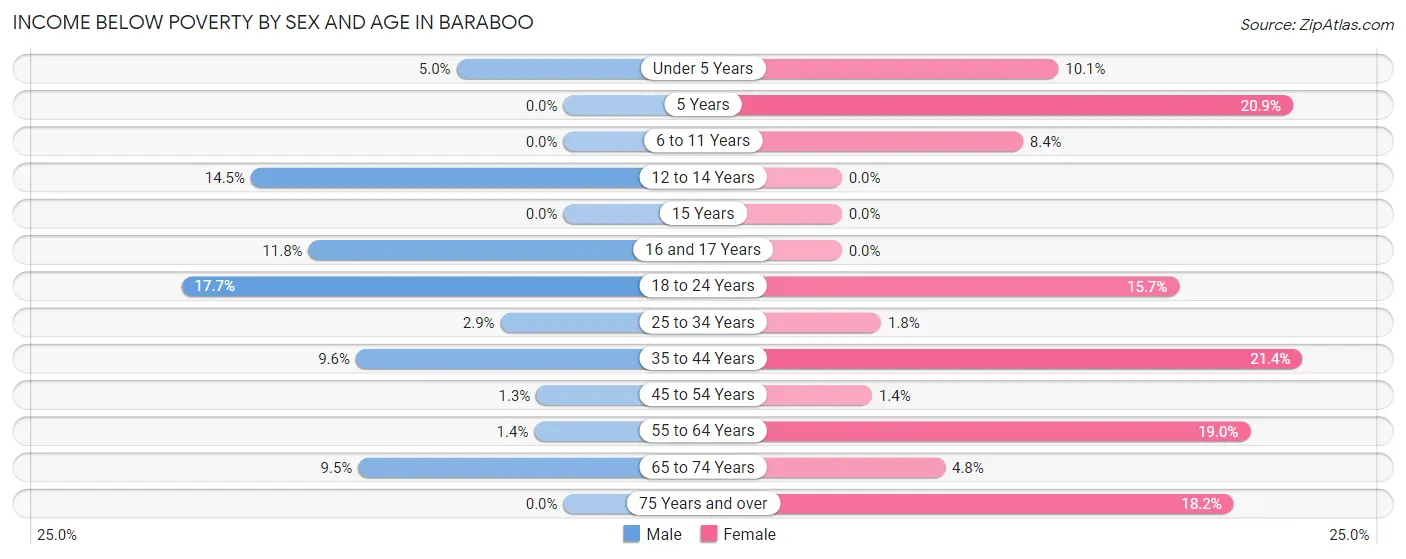
Income Below Poverty by Sex and Age in Baraboo
With 6.2% poverty level for males and 11.2% for females among the residents of Baraboo, 18 to 24 year old males and 35 to 44 year old females are the most vulnerable to poverty, with 96 males (17.7%) and 215 females (21.4%) in their respective age groups living below the poverty level.
| Age Bracket | Male | Female |
| Under 5 Years | 19 (5.0%) | 22 (10.1%) |
| 5 Years | 0 (0.0%) | 18 (20.9%) |
| 6 to 11 Years | 0 (0.0%) | 42 (8.4%) |
| 12 to 14 Years | 39 (14.5%) | 0 (0.0%) |
| 15 Years | 0 (0.0%) | 0 (0.0%) |
| 16 and 17 Years | 22 (11.8%) | 0 (0.0%) |
| 18 to 24 Years | 96 (17.7%) | 77 (15.7%) |
| 25 to 34 Years | 28 (2.9%) | 14 (1.8%) |
| 35 to 44 Years | 83 (9.6%) | 215 (21.4%) |
| 45 to 54 Years | 10 (1.3%) | 10 (1.4%) |
| 55 to 64 Years | 11 (1.3%) | 151 (19.0%) |
| 65 to 74 Years | 61 (9.5%) | 27 (4.8%) |
| 75 Years and over | 0 (0.0%) | 126 (18.2%) |
| Total | 369 (6.2%) | 702 (11.2%) |
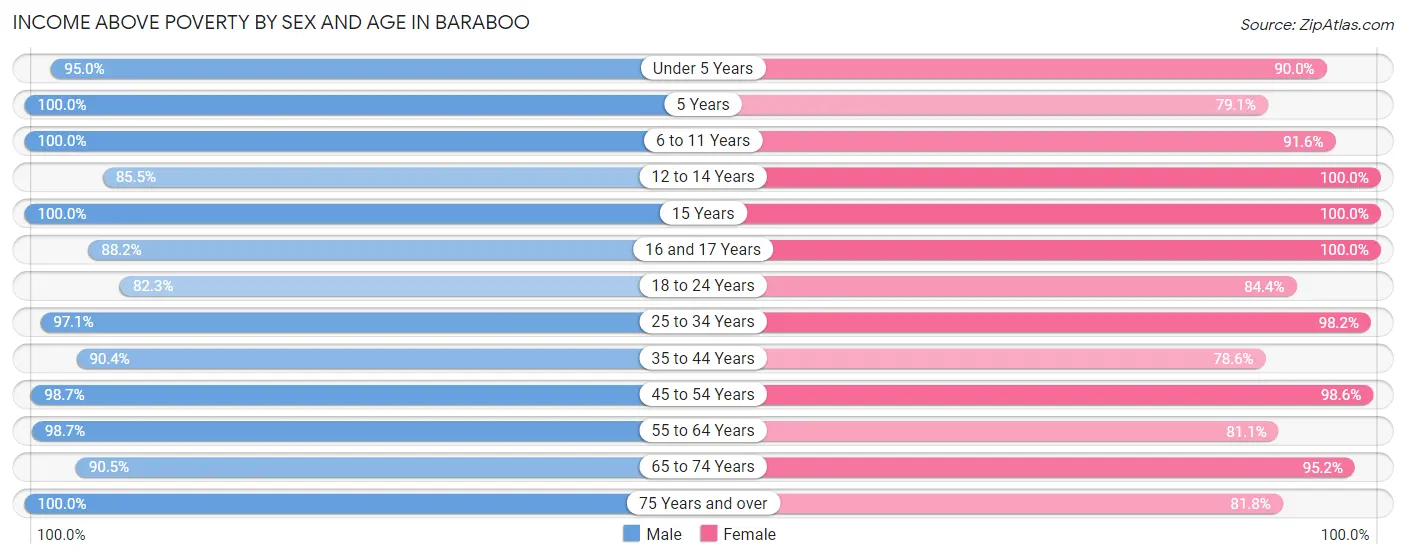
Income Above Poverty by Sex and Age in Baraboo
According to the poverty statistics in Baraboo, males aged 5 years and females aged 12 to 14 years are the age groups that are most secure financially, with 100.0% of males and 100.0% of females in these age groups living above the poverty line.
| Age Bracket | Male | Female |
| Under 5 Years | 364 (95.0%) | 197 (89.9%) |
| 5 Years | 13 (100.0%) | 68 (79.1%) |
| 6 to 11 Years | 178 (100.0%) | 458 (91.6%) |
| 12 to 14 Years | 230 (85.5%) | 203 (100.0%) |
| 15 Years | 16 (100.0%) | 127 (100.0%) |
| 16 and 17 Years | 164 (88.2%) | 84 (100.0%) |
| 18 to 24 Years | 446 (82.3%) | 415 (84.4%) |
| 25 to 34 Years | 931 (97.1%) | 755 (98.2%) |
| 35 to 44 Years | 779 (90.4%) | 791 (78.6%) |
| 45 to 54 Years | 782 (98.7%) | 703 (98.6%) |
| 55 to 64 Years | 804 (98.7%) | 646 (81.0%) |
| 65 to 74 Years | 580 (90.5%) | 537 (95.2%) |
| 75 Years and over | 334 (100.0%) | 567 (81.8%) |
| Total | 5,621 (93.8%) | 5,551 (88.8%) |
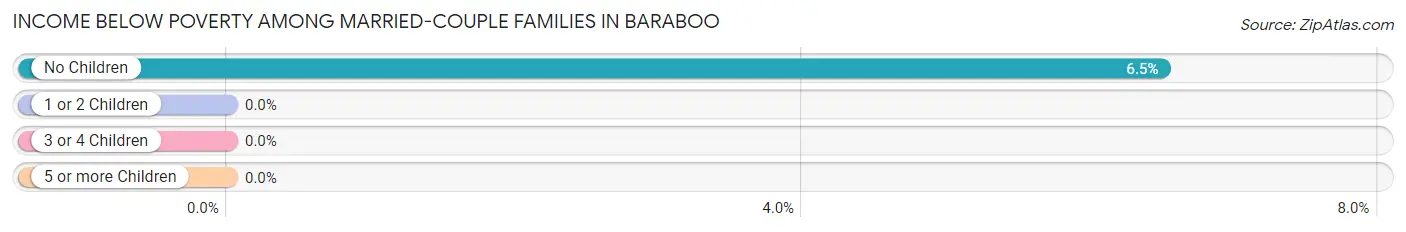
Income Below Poverty Among Married-Couple Families in Baraboo
The poverty statistics for married-couple families in Baraboo show that 4.1% or 92 of the total 2,244 families live below the poverty line. Families with no children have the highest poverty rate of 6.5%, comprising of 92 families. On the other hand, families with 1 or 2 children have the lowest poverty rate of 0.0%, which includes 0 families.
| Children | Above Poverty | Below Poverty |
| No Children | 1,325 (93.5%) | 92 (6.5%) |
| 1 or 2 Children | 666 (100.0%) | 0 (0.0%) |
| 3 or 4 Children | 161 (100.0%) | 0 (0.0%) |
| 5 or more Children | 0 (0.0%) | 0 (0.0%) |
| Total | 2,152 (95.9%) | 92 (4.1%) |
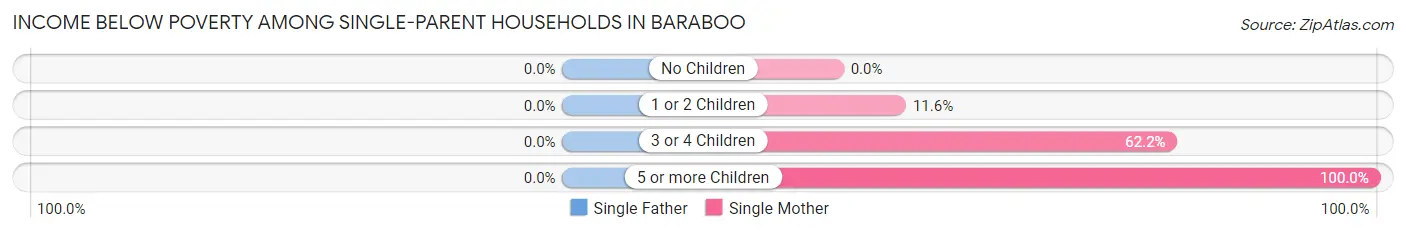
Income Below Poverty Among Single-Parent Households in Baraboo
| Children | Single Father | Single Mother |
| No Children | 0 (0.0%) | 0 (0.0%) |
| 1 or 2 Children | 0 (0.0%) | 31 (11.6%) |
| 3 or 4 Children | 0 (0.0%) | 23 (62.2%) |
| 5 or more Children | 0 (0.0%) | 15 (100.0%) |
| Total | 0 (0.0%) | 69 (12.0%) |
Income Below Poverty Among Married-Couple vs Single-Parent Households in Baraboo
The poverty data for Baraboo shows that 92 of the married-couple family households (4.1%) and 69 of the single-parent households (6.6%) are living below the poverty level. Within the married-couple family households, those with no children have the highest poverty rate, with 92 households (6.5%) falling below the poverty line. Among the single-parent households, those with 5 or more children have the highest poverty rate, with 15 household (100.0%) living below poverty.
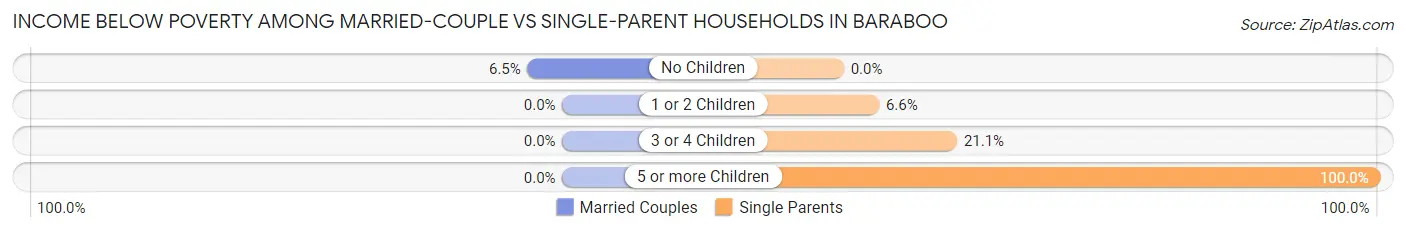
| Children | Married-Couple Families | Single-Parent Households |
| No Children | 92 (6.5%) | 0 (0.0%) |
| 1 or 2 Children | 0 (0.0%) | 31 (6.6%) |
| 3 or 4 Children | 0 (0.0%) | 23 (21.1%) |
| 5 or more Children | 0 (0.0%) | 15 (100.0%) |
| Total | 92 (4.1%) | 69 (6.6%) |
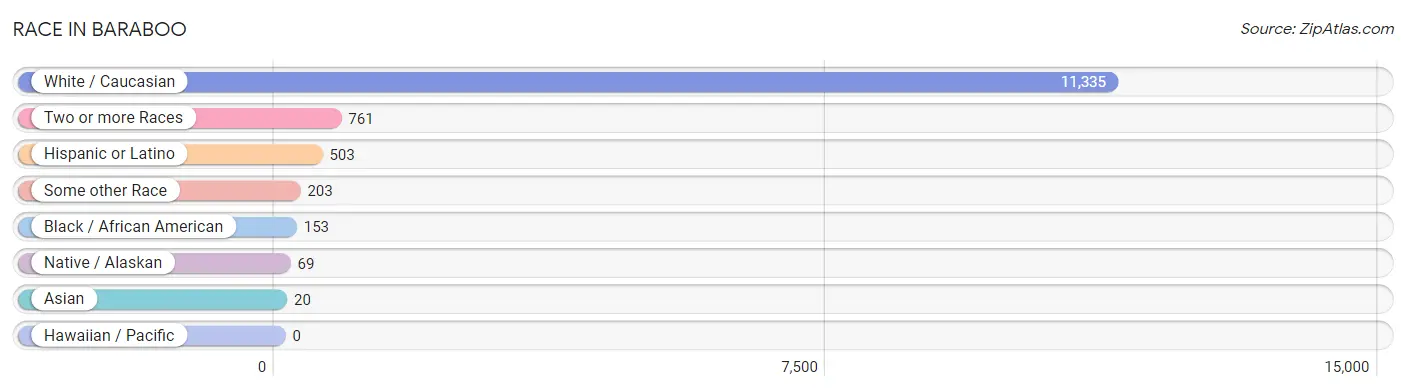
Race in Baraboo
The most populous races in Baraboo are White / Caucasian (11,335 | 90.4%), Two or more Races (761 | 6.1%), and Hispanic or Latino (503 | 4.0%).
| Race | # Population | % Population |
| Asian | 20 | 0.2% |
| Black / African American | 153 | 1.2% |
| Hawaiian / Pacific | 0 | 0.0% |
| Hispanic or Latino | 503 | 4.0% |
| Native / Alaskan | 69 | 0.5% |
| White / Caucasian | 11,335 | 90.4% |
| Two or more Races | 761 | 6.1% |
| Some other Race | 203 | 1.6% |
| Total | 12,541 | 100.0% |
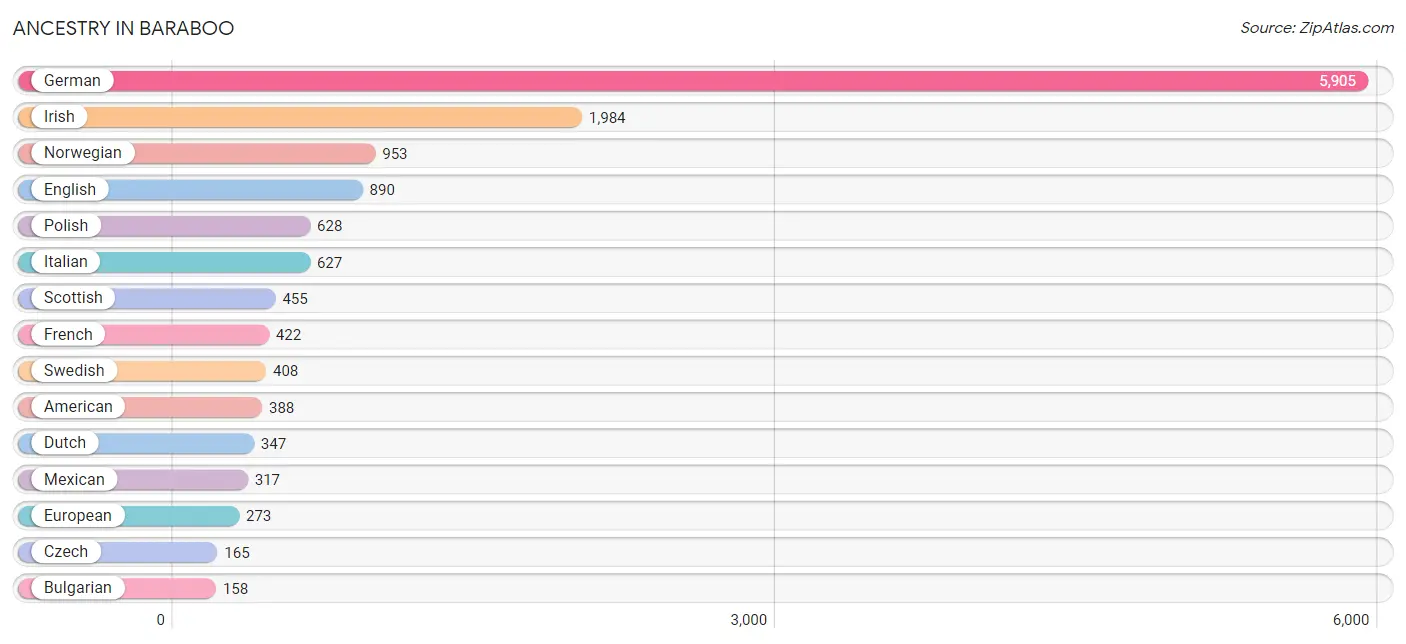
Ancestry in Baraboo
The most populous ancestries reported in Baraboo are German (5,905 | 47.1%), Irish (1,984 | 15.8%), Norwegian (953 | 7.6%), English (890 | 7.1%), and Polish (628 | 5.0%), together accounting for 82.6% of all Baraboo residents.
| Ancestry | # Population | % Population |
| Alaska Native | 7 | 0.1% |
| American | 388 | 3.1% |
| Austrian | 15 | 0.1% |
| Belgian | 112 | 0.9% |
| Bhutanese | 136 | 1.1% |
| British | 87 | 0.7% |
| Bulgarian | 158 | 1.3% |
| Burmese | 29 | 0.2% |
| Canadian | 11 | 0.1% |
| Central American | 12 | 0.1% |
| Chippewa | 24 | 0.2% |
| Colombian | 58 | 0.5% |
| Czech | 165 | 1.3% |
| Czechoslovakian | 99 | 0.8% |
| Danish | 88 | 0.7% |
| Dutch | 347 | 2.8% |
| English | 890 | 7.1% |
| European | 273 | 2.2% |
| Finnish | 30 | 0.2% |
| French | 422 | 3.4% |
| French Canadian | 16 | 0.1% |
| German | 5,905 | 47.1% |
| German Russian | 41 | 0.3% |
| Greek | 80 | 0.6% |
| Guatemalan | 12 | 0.1% |
| Haitian | 36 | 0.3% |
| Hungarian | 10 | 0.1% |
| Indian (Asian) | 20 | 0.2% |
| Irish | 1,984 | 15.8% |
| Iroquois | 4 | 0.0% |
| Italian | 627 | 5.0% |
| Jamaican | 20 | 0.2% |
| Korean | 19 | 0.2% |
| Mexican | 317 | 2.5% |
| Norwegian | 953 | 7.6% |
| Pennsylvania German | 16 | 0.1% |
| Polish | 628 | 5.0% |
| Puerto Rican | 116 | 0.9% |
| Russian | 61 | 0.5% |
| Scandinavian | 28 | 0.2% |
| Scotch-Irish | 102 | 0.8% |
| Scottish | 455 | 3.6% |
| Slavic | 1 | 0.0% |
| Slovak | 56 | 0.4% |
| Slovene | 74 | 0.6% |
| South American | 58 | 0.5% |
| Swedish | 408 | 3.3% |
| Swiss | 106 | 0.9% |
| Thai | 25 | 0.2% |
| Turkish | 5 | 0.0% |
| Ukrainian | 21 | 0.2% |
| Welsh | 46 | 0.4% | View All 52 Rows |
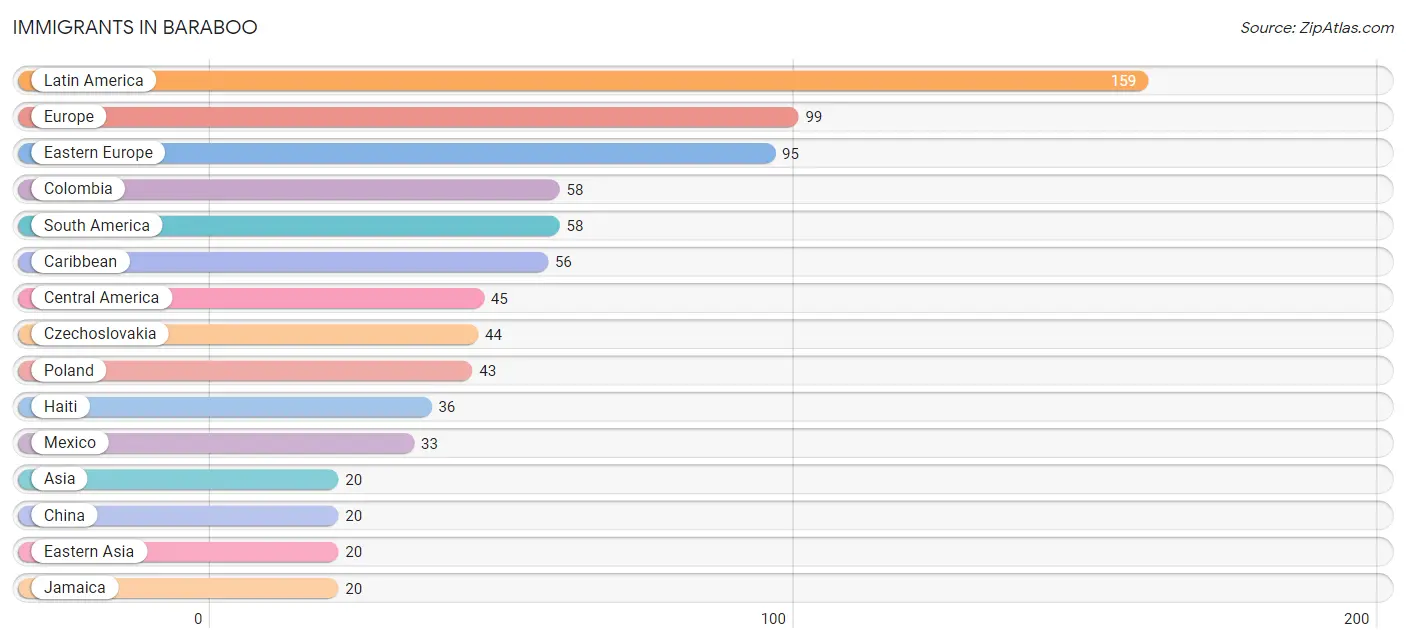
Immigrants in Baraboo
The most numerous immigrant groups reported in Baraboo came from Latin America (159 | 1.3%), Europe (99 | 0.8%), Eastern Europe (95 | 0.8%), Colombia (58 | 0.5%), and South America (58 | 0.5%), together accounting for 3.7% of all Baraboo residents.
| Immigration Origin | # Population | % Population |
| Africa | 9 | 0.1% |
| Asia | 20 | 0.2% |
| Caribbean | 56 | 0.4% |
| Central America | 45 | 0.4% |
| China | 20 | 0.2% |
| Colombia | 58 | 0.5% |
| Czechoslovakia | 44 | 0.4% |
| Eastern Asia | 20 | 0.2% |
| Eastern Europe | 95 | 0.8% |
| Europe | 99 | 0.8% |
| Germany | 4 | 0.0% |
| Guatemala | 12 | 0.1% |
| Haiti | 36 | 0.3% |
| Jamaica | 20 | 0.2% |
| Latin America | 159 | 1.3% |
| Mexico | 33 | 0.3% |
| Poland | 43 | 0.3% |
| Russia | 8 | 0.1% |
| South America | 58 | 0.5% |
| Western Europe | 4 | 0.0% | View All 20 Rows |
Sex and Age in Baraboo
Sex and Age in Baraboo
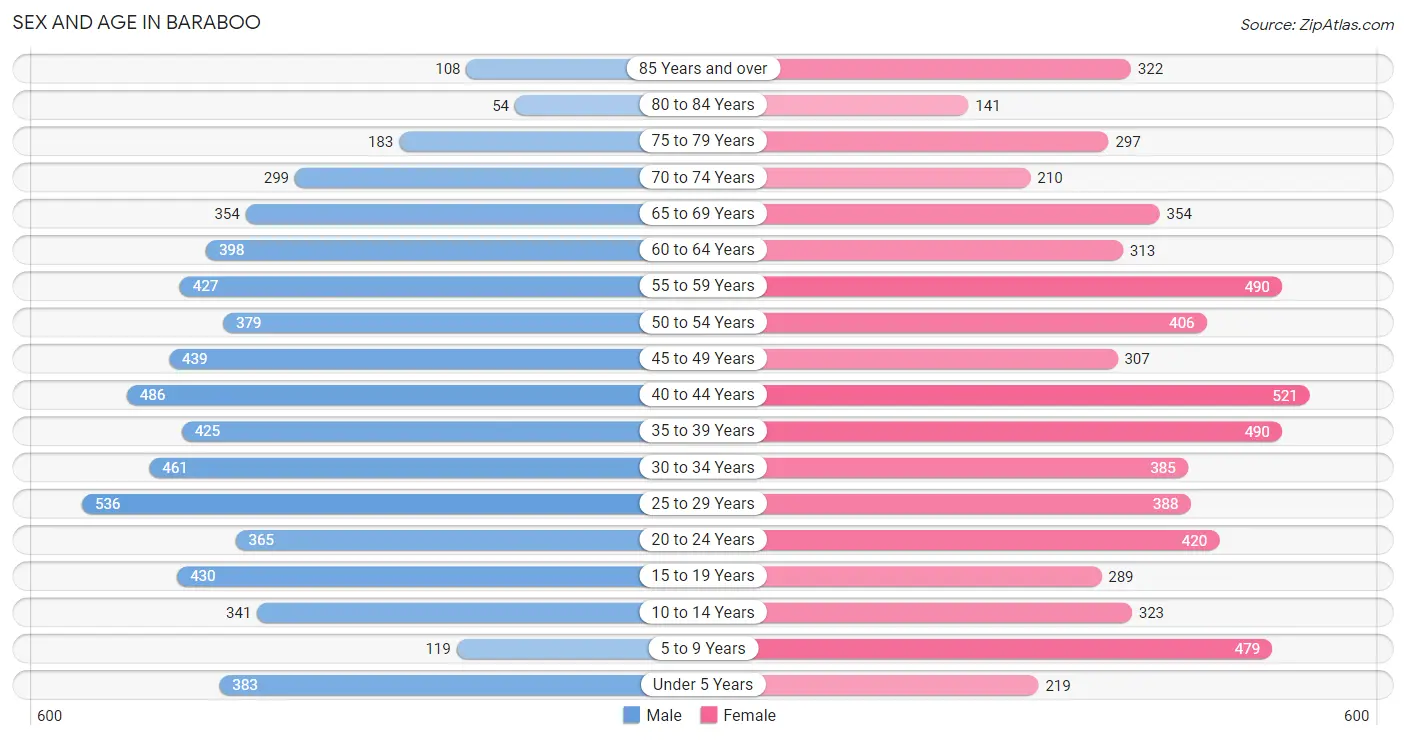
The most populous age groups in Baraboo are 25 to 29 Years (536 | 8.7%) for men and 40 to 44 Years (521 | 8.2%) for women.
| Age Bracket | Male | Female |
| Under 5 Years | 383 (6.2%) | 219 (3.5%) |
| 5 to 9 Years | 119 (1.9%) | 479 (7.5%) |
| 10 to 14 Years | 341 (5.5%) | 323 (5.1%) |
| 15 to 19 Years | 430 (7.0%) | 289 (4.5%) |
| 20 to 24 Years | 365 (5.9%) | 420 (6.6%) |
| 25 to 29 Years | 536 (8.7%) | 388 (6.1%) |
| 30 to 34 Years | 461 (7.4%) | 385 (6.1%) |
| 35 to 39 Years | 425 (6.9%) | 490 (7.7%) |
| 40 to 44 Years | 486 (7.9%) | 521 (8.2%) |
| 45 to 49 Years | 439 (7.1%) | 307 (4.8%) |
| 50 to 54 Years | 379 (6.1%) | 406 (6.4%) |
| 55 to 59 Years | 427 (6.9%) | 490 (7.7%) |
| 60 to 64 Years | 398 (6.4%) | 313 (4.9%) |
| 65 to 69 Years | 354 (5.7%) | 354 (5.6%) |
| 70 to 74 Years | 299 (4.8%) | 210 (3.3%) |
| 75 to 79 Years | 183 (3.0%) | 297 (4.7%) |
| 80 to 84 Years | 54 (0.9%) | 141 (2.2%) |
| 85 Years and over | 108 (1.8%) | 322 (5.1%) |
| Total | 6,187 (100.0%) | 6,354 (100.0%) |
Families and Households in Baraboo
Median Family Size in Baraboo
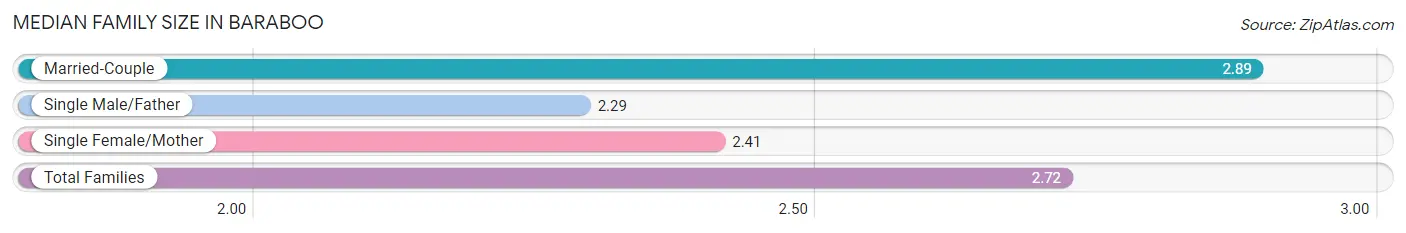
The median family size in Baraboo is 2.72 persons per family, with married-couple families (2,244 | 68.3%) accounting for the largest median family size of 2.89 persons per family. On the other hand, single male/father families (465 | 14.2%) represent the smallest median family size with 2.29 persons per family.
| Family Type | # Families | Family Size |
| Married-Couple | 2,244 (68.3%) | 2.89 |
| Single Male/Father | 465 (14.2%) | 2.29 |
| Single Female/Mother | 574 (17.5%) | 2.41 |
| Total Families | 3,283 (100.0%) | 2.72 |
Median Household Size in Baraboo
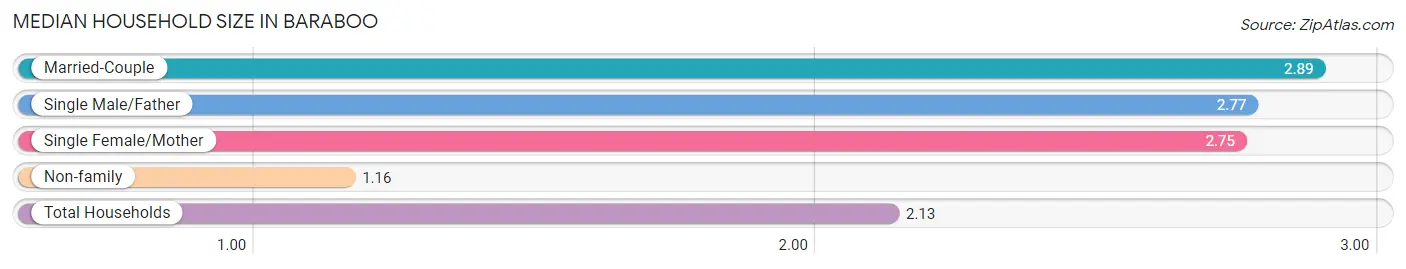
The median household size in Baraboo is 2.13 persons per household, with married-couple households (2,244 | 39.2%) accounting for the largest median household size of 2.89 persons per household. non-family households (2,444 | 42.7%) represent the smallest median household size with 1.16 persons per household.
| Household Type | # Households | Household Size |
| Married-Couple | 2,244 (39.2%) | 2.89 |
| Single Male/Father | 465 (8.1%) | 2.77 |
| Single Female/Mother | 574 (10.0%) | 2.75 |
| Non-family | 2,444 (42.7%) | 1.16 |
| Total Households | 5,727 (100.0%) | 2.13 |
Household Size by Marriage Status in Baraboo
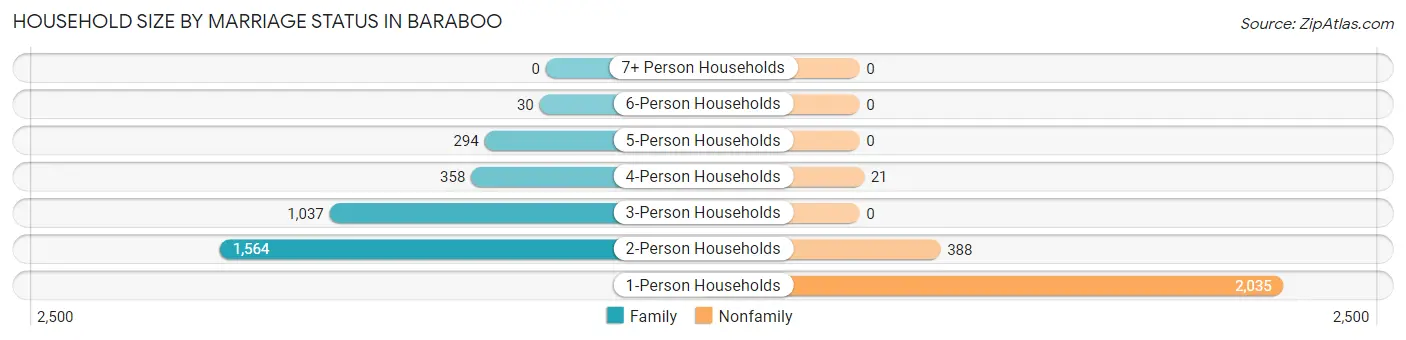
Out of a total of 5,727 households in Baraboo, 3,283 (57.3%) are family households, while 2,444 (42.7%) are nonfamily households. The most numerous type of family households are 2-person households, comprising 1,564, and the most common type of nonfamily households are 1-person households, comprising 2,035.
| Household Size | Family Households | Nonfamily Households |
| 1-Person Households | - | 2,035 (35.5%) |
| 2-Person Households | 1,564 (27.3%) | 388 (6.8%) |
| 3-Person Households | 1,037 (18.1%) | 0 (0.0%) |
| 4-Person Households | 358 (6.2%) | 21 (0.4%) |
| 5-Person Households | 294 (5.1%) | 0 (0.0%) |
| 6-Person Households | 30 (0.5%) | 0 (0.0%) |
| 7+ Person Households | 0 (0.0%) | 0 (0.0%) |
| Total | 3,283 (57.3%) | 2,444 (42.7%) |
Female Fertility in Baraboo
Fertility by Age in Baraboo
Average fertility rate in Baraboo is 113.0 births per 1,000 women. Women in the age bracket of 35 to 50 years have the highest fertility rate with 134.0 births per 1,000 women. Women in the age bracket of 35 to 50 years acount for 56.7% of all women with births.
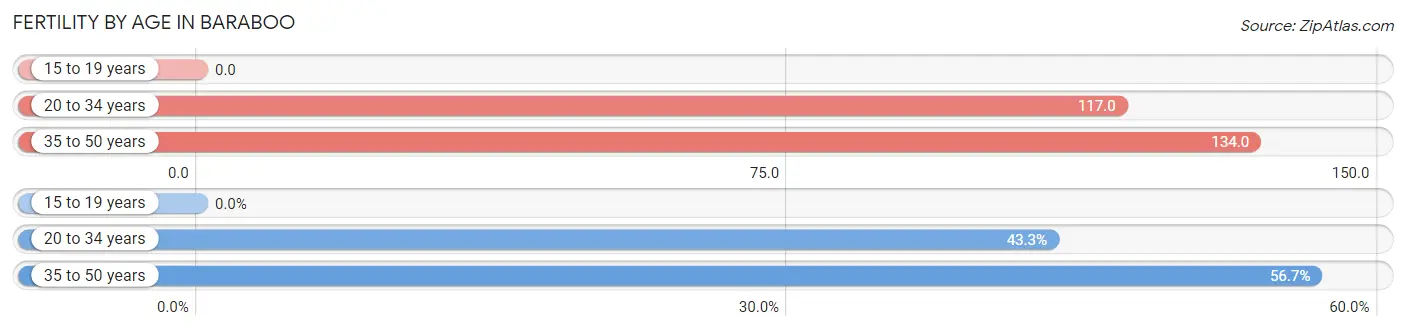
| Age Bracket | Women with Births | Births / 1,000 Women |
| 15 to 19 years | 0 (0.0%) | 0.0 |
| 20 to 34 years | 139 (43.3%) | 117.0 |
| 35 to 50 years | 182 (56.7%) | 134.0 |
| Total | 321 (100.0%) | 113.0 |
Fertility by Age by Marriage Status in Baraboo
52.6% of women with births (321) in Baraboo are married. The highest percentage of unmarried women with births falls into 35 to 50 years age bracket with 78.6% of them unmarried at the time of birth, while the lowest percentage of unmarried women with births belong to 20 to 34 years age bracket with 6.5% of them unmarried.
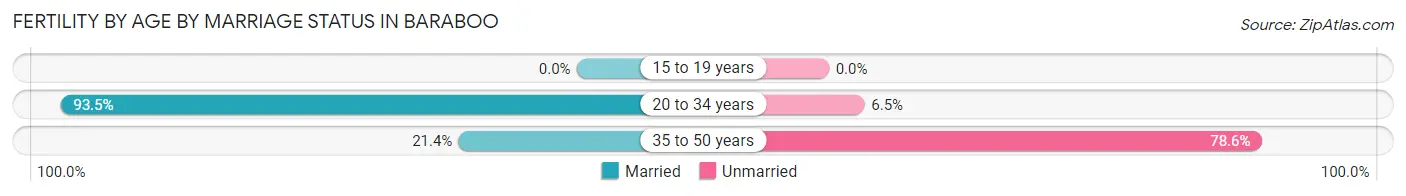
| Age Bracket | Married | Unmarried |
| 15 to 19 years | 0 (0.0%) | 0 (0.0%) |
| 20 to 34 years | 130 (93.5%) | 9 (6.5%) |
| 35 to 50 years | 39 (21.4%) | 143 (78.6%) |
| Total | 169 (52.6%) | 152 (47.3%) |
Fertility by Education in Baraboo
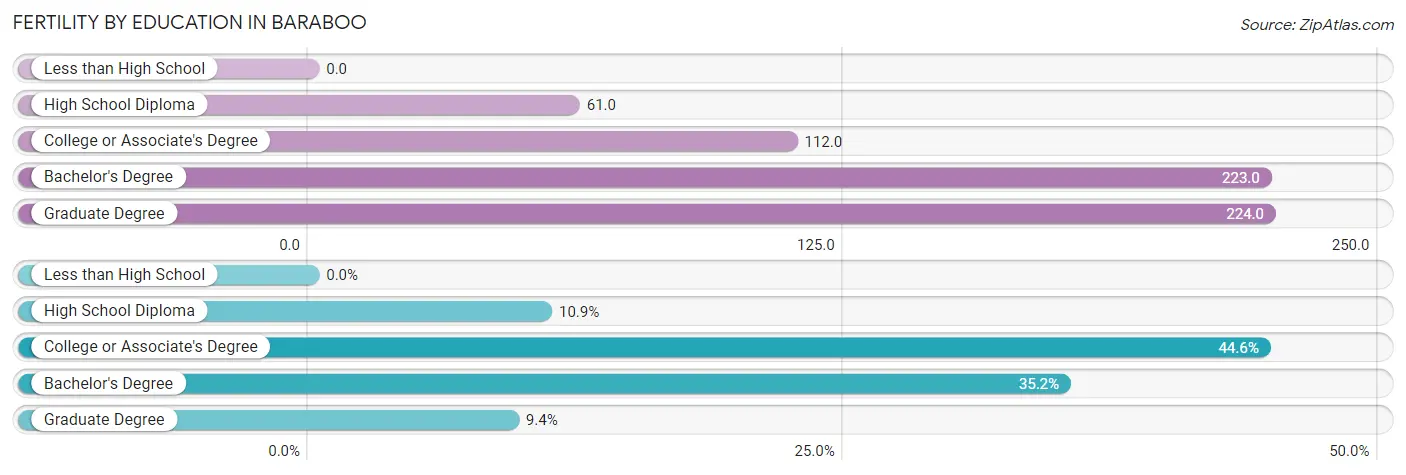
| Educational Attainment | Women with Births | Births / 1,000 Women |
| Less than High School | 0 (0.0%) | 0.0 |
| High School Diploma | 35 (10.9%) | 61.0 |
| College or Associate's Degree | 143 (44.6%) | 112.0 |
| Bachelor's Degree | 113 (35.2%) | 223.0 |
| Graduate Degree | 30 (9.3%) | 224.0 |
| Total | 321 (100.0%) | 113.0 |
Fertility by Education by Marriage Status in Baraboo
47.3% of women with births in Baraboo are unmarried. Women with the educational attainment of bachelor's degree are most likely to be married with 100.0% of them married at childbirth, while women with the educational attainment of college or associate's degree are least likely to be married with 100.0% of them unmarried at childbirth.
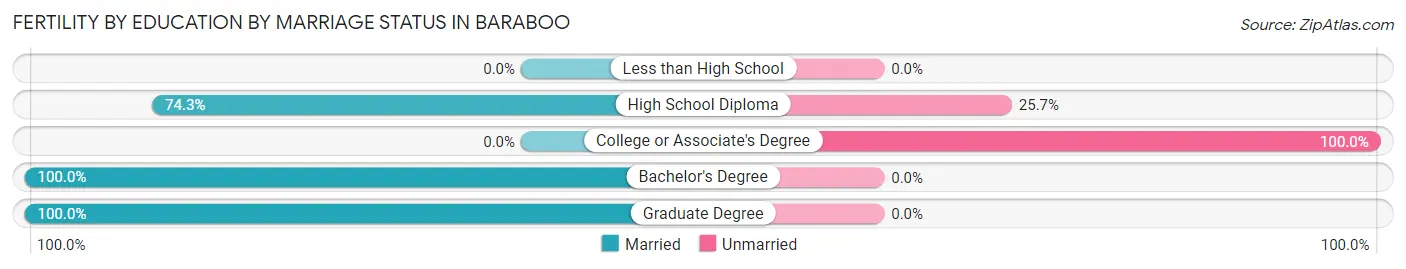
| Educational Attainment | Married | Unmarried |
| Less than High School | 0 (0.0%) | 0 (0.0%) |
| High School Diploma | 26 (74.3%) | 9 (25.7%) |
| College or Associate's Degree | 0 (0.0%) | 143 (100.0%) |
| Bachelor's Degree | 113 (100.0%) | 0 (0.0%) |
| Graduate Degree | 30 (100.0%) | 0 (0.0%) |
| Total | 169 (52.6%) | 152 (47.3%) |
Employment Characteristics in Baraboo
Employment by Class of Employer in Baraboo
Among the 6,485 employed individuals in Baraboo, private company employees (4,871 | 75.1%), local government employees (640 | 9.9%), and not-for-profit organizations (485 | 7.5%) make up the most common classes of employment.
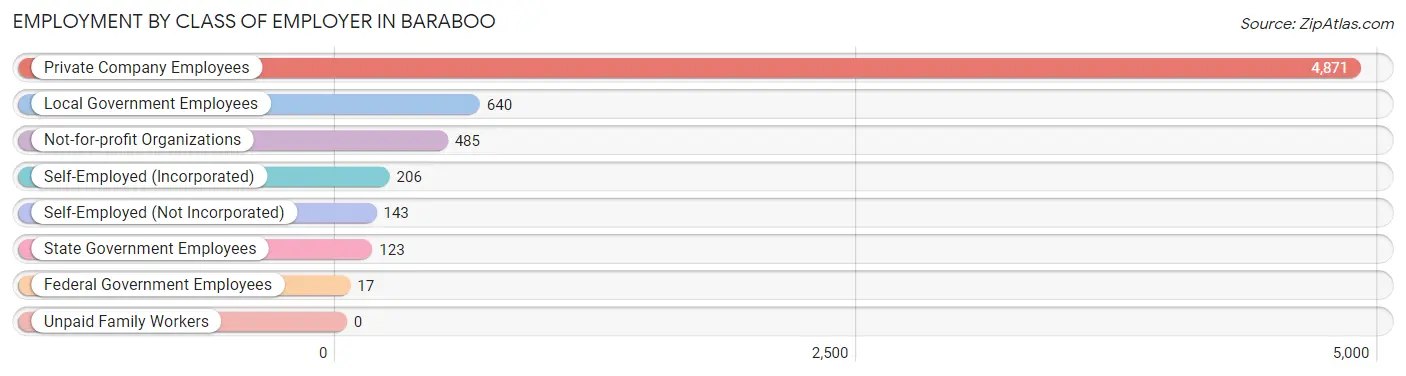
| Employer Class | # Employees | % Employees |
| Private Company Employees | 4,871 | 75.1% |
| Self-Employed (Incorporated) | 206 | 3.2% |
| Self-Employed (Not Incorporated) | 143 | 2.2% |
| Not-for-profit Organizations | 485 | 7.5% |
| Local Government Employees | 640 | 9.9% |
| State Government Employees | 123 | 1.9% |
| Federal Government Employees | 17 | 0.3% |
| Unpaid Family Workers | 0 | 0.0% |
| Total | 6,485 | 100.0% |
Employment Status by Age in Baraboo
According to the labor force statistics for Baraboo, out of the total population over 16 years of age (10,534), 66.2% or 6,974 individuals are in the labor force, with 5.7% or 398 of them unemployed. The age group with the highest labor force participation rate is 25 to 29 years, with 97.7% or 903 individuals in the labor force. Within the labor force, the 20 to 24 years age range has the highest percentage of unemployed individuals, with 15.9% or 84 of them being unemployed.
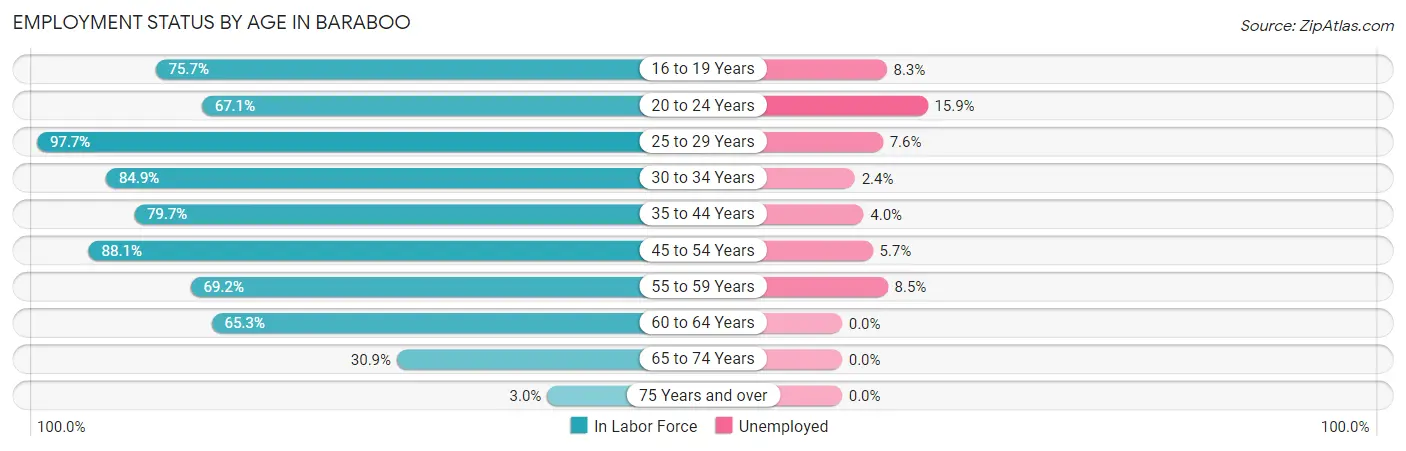
| Age Bracket | In Labor Force | Unemployed |
| 16 to 19 Years | 436 (75.7%) | 36 (8.3%) |
| 20 to 24 Years | 527 (67.1%) | 84 (15.9%) |
| 25 to 29 Years | 903 (97.7%) | 69 (7.6%) |
| 30 to 34 Years | 718 (84.9%) | 17 (2.4%) |
| 35 to 44 Years | 1,532 (79.7%) | 61 (4.0%) |
| 45 to 54 Years | 1,349 (88.1%) | 77 (5.7%) |
| 55 to 59 Years | 635 (69.2%) | 54 (8.5%) |
| 60 to 64 Years | 464 (65.3%) | 0 (0.0%) |
| 65 to 74 Years | 376 (30.9%) | 0 (0.0%) |
| 75 Years and over | 33 (3.0%) | 0 (0.0%) |
| Total | 6,974 (66.2%) | 398 (5.7%) |
Employment Status by Educational Attainment in Baraboo
According to labor force statistics for Baraboo, 81.8% of individuals (5,604) out of the total population between 25 and 64 years of age (6,851) are in the labor force, with 5.0% or 280 of them being unemployed. The group with the highest labor force participation rate are those with the educational attainment of bachelor's degree or higher, with 93.1% or 1,639 individuals in the labor force. Within the labor force, individuals with less than high school education have the highest percentage of unemployment, with 16.1% or 71 of them being unemployed.
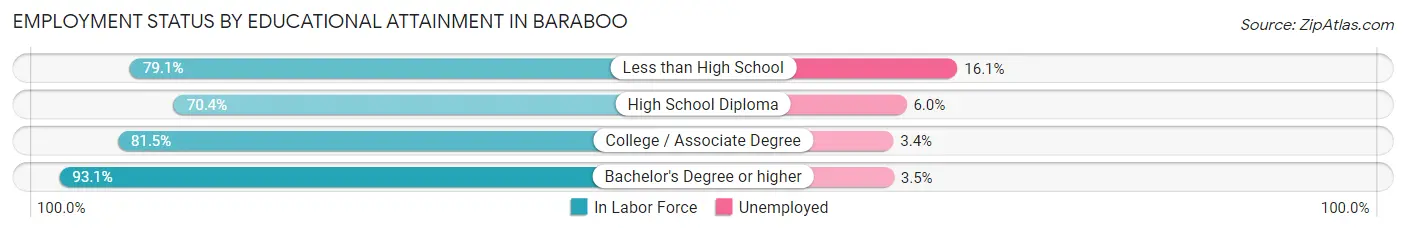
| Educational Attainment | In Labor Force | Unemployed |
| Less than High School | 442 (79.1%) | 90 (16.1%) |
| High School Diploma | 1,107 (70.4%) | 94 (6.0%) |
| College / Associate Degree | 2,412 (81.5%) | 101 (3.4%) |
| Bachelor's Degree or higher | 1,639 (93.1%) | 62 (3.5%) |
| Total | 5,604 (81.8%) | 343 (5.0%) |
Employment Occupations by Sex in Baraboo
Management, Business, Science and Arts Occupations
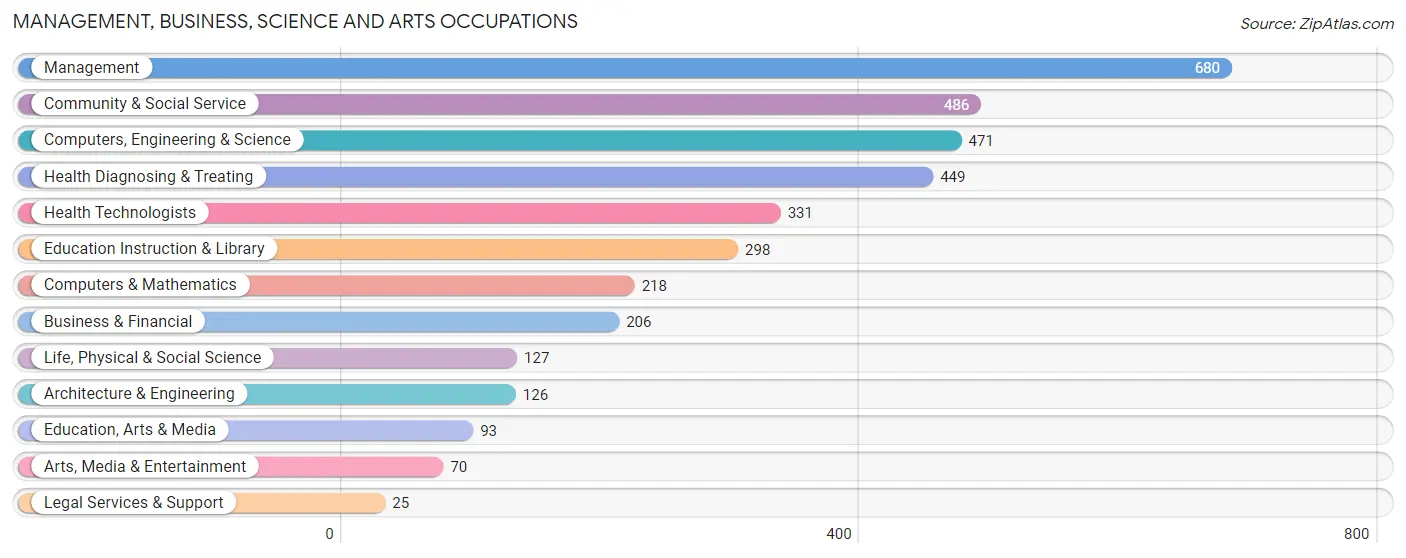
The most common Management, Business, Science and Arts occupations in Baraboo are Management (680 | 10.3%), Community & Social Service (486 | 7.4%), Computers, Engineering & Science (471 | 7.2%), Health Diagnosing & Treating (449 | 6.8%), and Health Technologists (331 | 5.0%).
Management, Business, Science and Arts Occupations by Sex
Within the Management, Business, Science and Arts occupations in Baraboo, the most male-oriented occupations are Computers & Mathematics (85.8%), Computers, Engineering & Science (65.2%), and Architecture & Engineering (64.3%), while the most female-oriented occupations are Health Technologists (90.0%), Health Diagnosing & Treating (82.9%), and Education Instruction & Library (72.5%).
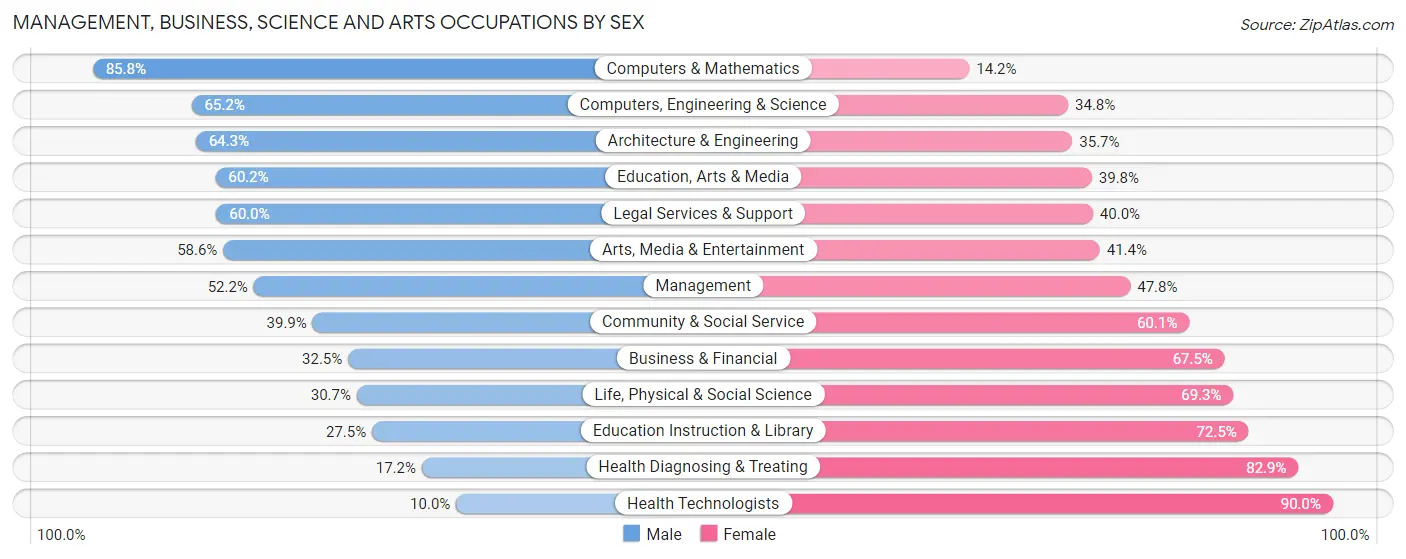
| Occupation | Male | Female |
| Management | 355 (52.2%) | 325 (47.8%) |
| Business & Financial | 67 (32.5%) | 139 (67.5%) |
| Computers, Engineering & Science | 307 (65.2%) | 164 (34.8%) |
| Computers & Mathematics | 187 (85.8%) | 31 (14.2%) |
| Architecture & Engineering | 81 (64.3%) | 45 (35.7%) |
| Life, Physical & Social Science | 39 (30.7%) | 88 (69.3%) |
| Community & Social Service | 194 (39.9%) | 292 (60.1%) |
| Education, Arts & Media | 56 (60.2%) | 37 (39.8%) |
| Legal Services & Support | 15 (60.0%) | 10 (40.0%) |
| Education Instruction & Library | 82 (27.5%) | 216 (72.5%) |
| Arts, Media & Entertainment | 41 (58.6%) | 29 (41.4%) |
| Health Diagnosing & Treating | 77 (17.2%) | 372 (82.9%) |
| Health Technologists | 33 (10.0%) | 298 (90.0%) |
| Total (Category) | 1,000 (43.6%) | 1,292 (56.4%) |
| Total (Overall) | 3,602 (54.8%) | 2,973 (45.2%) |
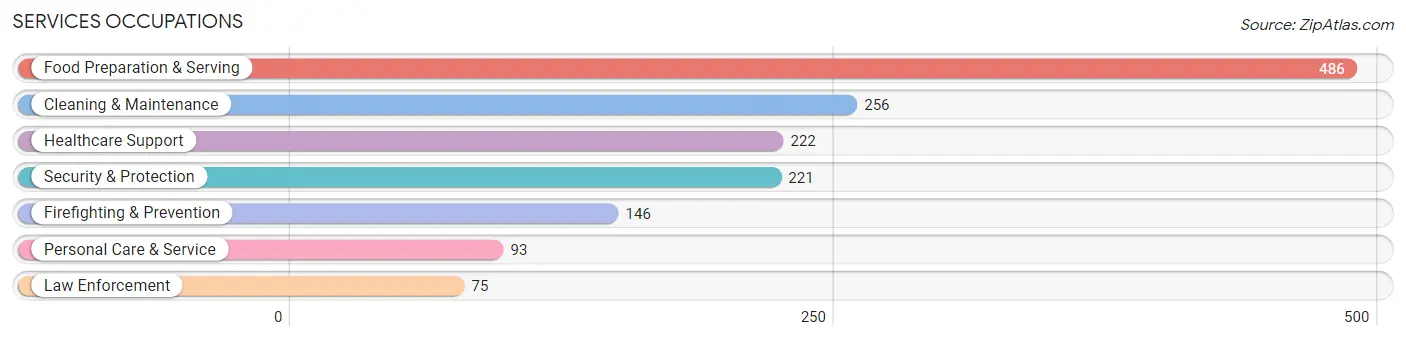
Services Occupations
The most common Services occupations in Baraboo are Food Preparation & Serving (486 | 7.4%), Cleaning & Maintenance (256 | 3.9%), Healthcare Support (222 | 3.4%), Security & Protection (221 | 3.4%), and Firefighting & Prevention (146 | 2.2%).
Services Occupations by Sex
Within the Services occupations in Baraboo, the most male-oriented occupations are Cleaning & Maintenance (89.4%), Food Preparation & Serving (54.7%), and Law Enforcement (48.0%), while the most female-oriented occupations are Healthcare Support (100.0%), Personal Care & Service (100.0%), and Firefighting & Prevention (76.0%).
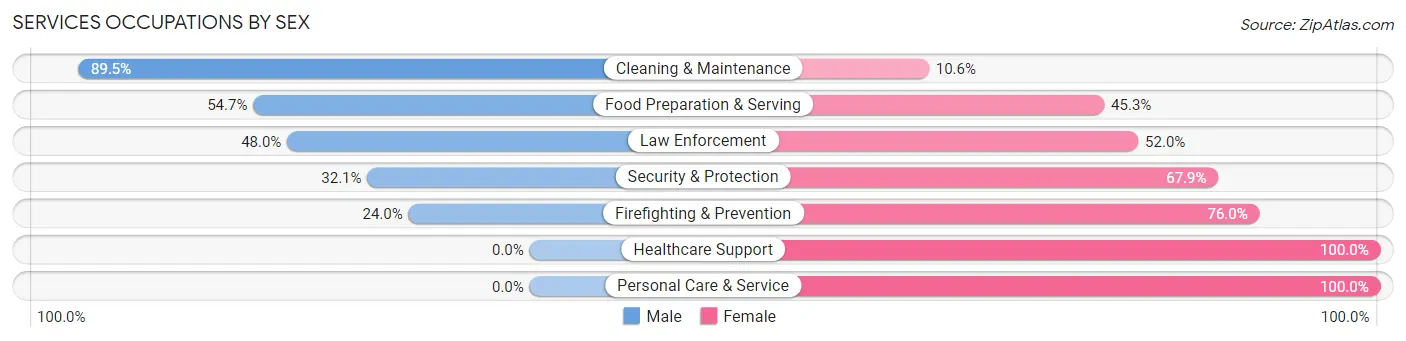
| Occupation | Male | Female |
| Healthcare Support | 0 (0.0%) | 222 (100.0%) |
| Security & Protection | 71 (32.1%) | 150 (67.9%) |
| Firefighting & Prevention | 35 (24.0%) | 111 (76.0%) |
| Law Enforcement | 36 (48.0%) | 39 (52.0%) |
| Food Preparation & Serving | 266 (54.7%) | 220 (45.3%) |
| Cleaning & Maintenance | 229 (89.4%) | 27 (10.5%) |
| Personal Care & Service | 0 (0.0%) | 93 (100.0%) |
| Total (Category) | 566 (44.3%) | 712 (55.7%) |
| Total (Overall) | 3,602 (54.8%) | 2,973 (45.2%) |
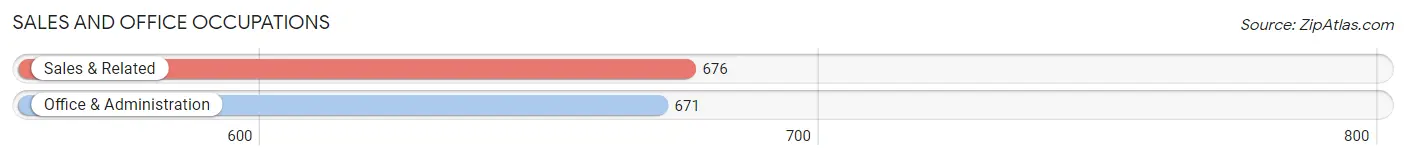
Sales and Office Occupations
The most common Sales and Office occupations in Baraboo are Sales & Related (676 | 10.3%), and Office & Administration (671 | 10.2%).
Sales and Office Occupations by Sex
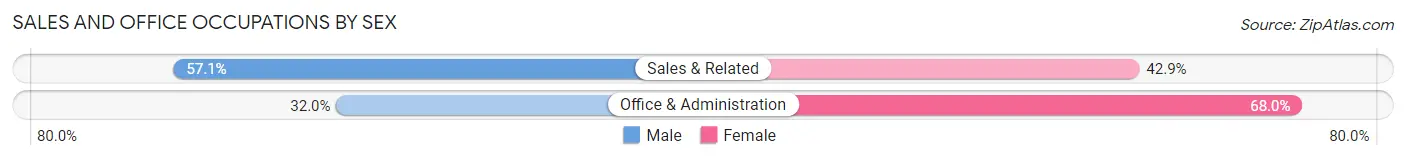
| Occupation | Male | Female |
| Sales & Related | 386 (57.1%) | 290 (42.9%) |
| Office & Administration | 215 (32.0%) | 456 (68.0%) |
| Total (Category) | 601 (44.6%) | 746 (55.4%) |
| Total (Overall) | 3,602 (54.8%) | 2,973 (45.2%) |
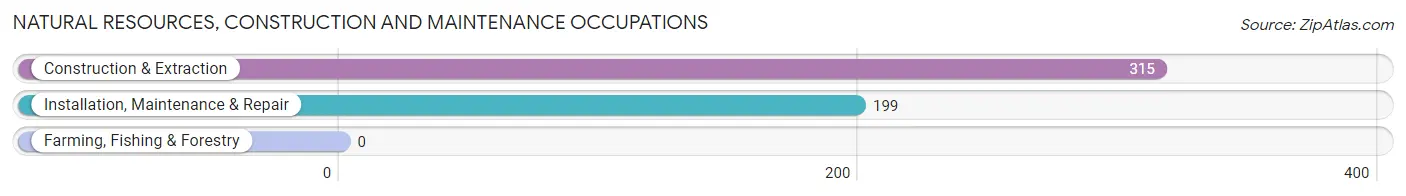
Natural Resources, Construction and Maintenance Occupations
The most common Natural Resources, Construction and Maintenance occupations in Baraboo are Construction & Extraction (315 | 4.8%), and Installation, Maintenance & Repair (199 | 3.0%).
Natural Resources, Construction and Maintenance Occupations by Sex
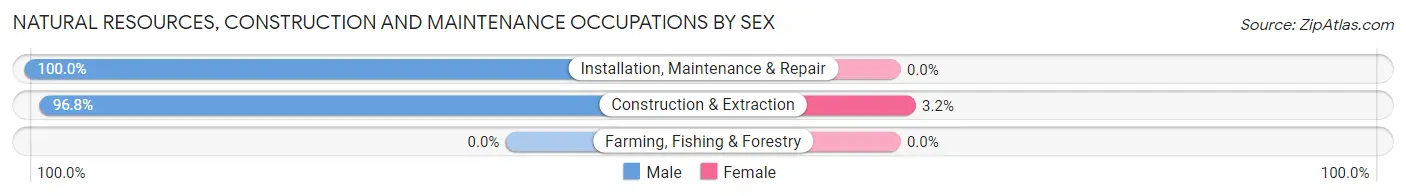
| Occupation | Male | Female |
| Farming, Fishing & Forestry | 0 (0.0%) | 0 (0.0%) |
| Construction & Extraction | 305 (96.8%) | 10 (3.2%) |
| Installation, Maintenance & Repair | 199 (100.0%) | 0 (0.0%) |
| Total (Category) | 504 (98.1%) | 10 (1.9%) |
| Total (Overall) | 3,602 (54.8%) | 2,973 (45.2%) |
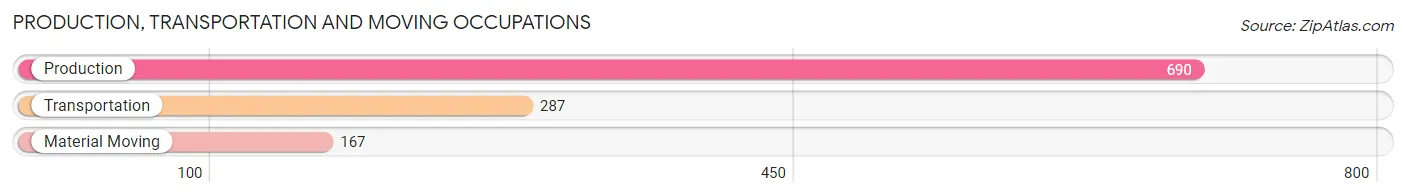
Production, Transportation and Moving Occupations
The most common Production, Transportation and Moving occupations in Baraboo are Production (690 | 10.5%), Transportation (287 | 4.4%), and Material Moving (167 | 2.5%).
Production, Transportation and Moving Occupations by Sex
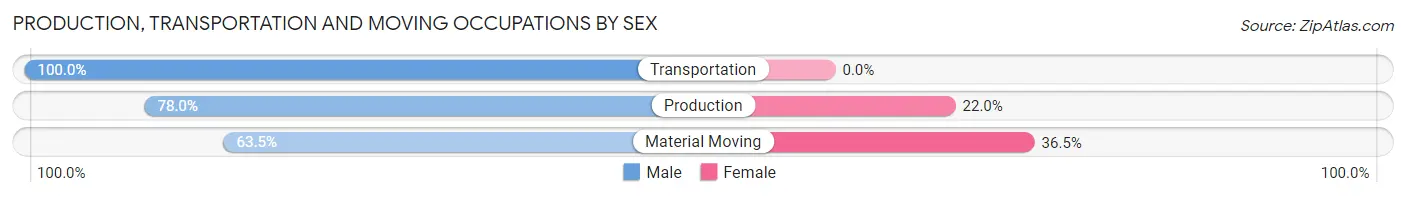
| Occupation | Male | Female |
| Production | 538 (78.0%) | 152 (22.0%) |
| Transportation | 287 (100.0%) | 0 (0.0%) |
| Material Moving | 106 (63.5%) | 61 (36.5%) |
| Total (Category) | 931 (81.4%) | 213 (18.6%) |
| Total (Overall) | 3,602 (54.8%) | 2,973 (45.2%) |
Employment Industries by Sex in Baraboo
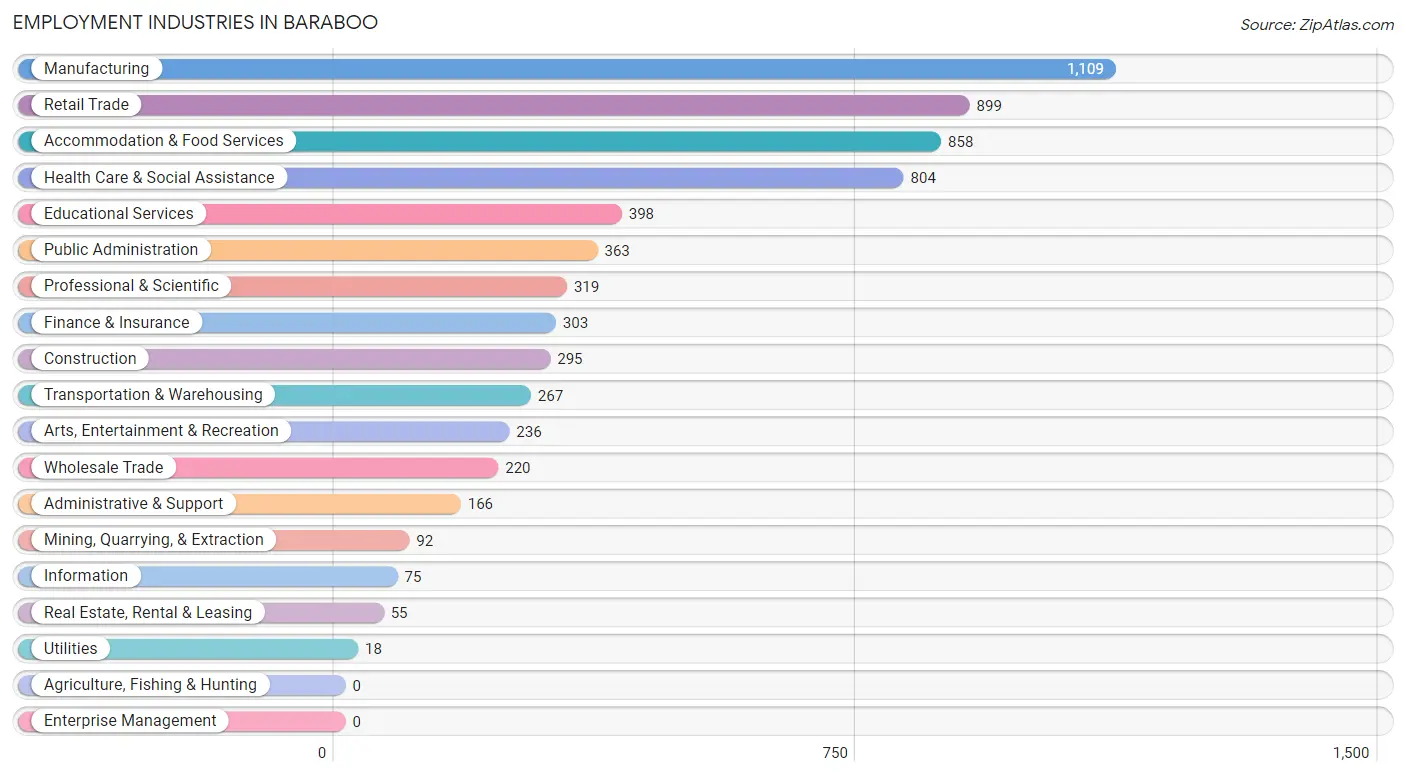
Employment Industries in Baraboo
The major employment industries in Baraboo include Manufacturing (1,109 | 16.9%), Retail Trade (899 | 13.7%), Accommodation & Food Services (858 | 13.1%), Health Care & Social Assistance (804 | 12.2%), and Educational Services (398 | 6.0%).
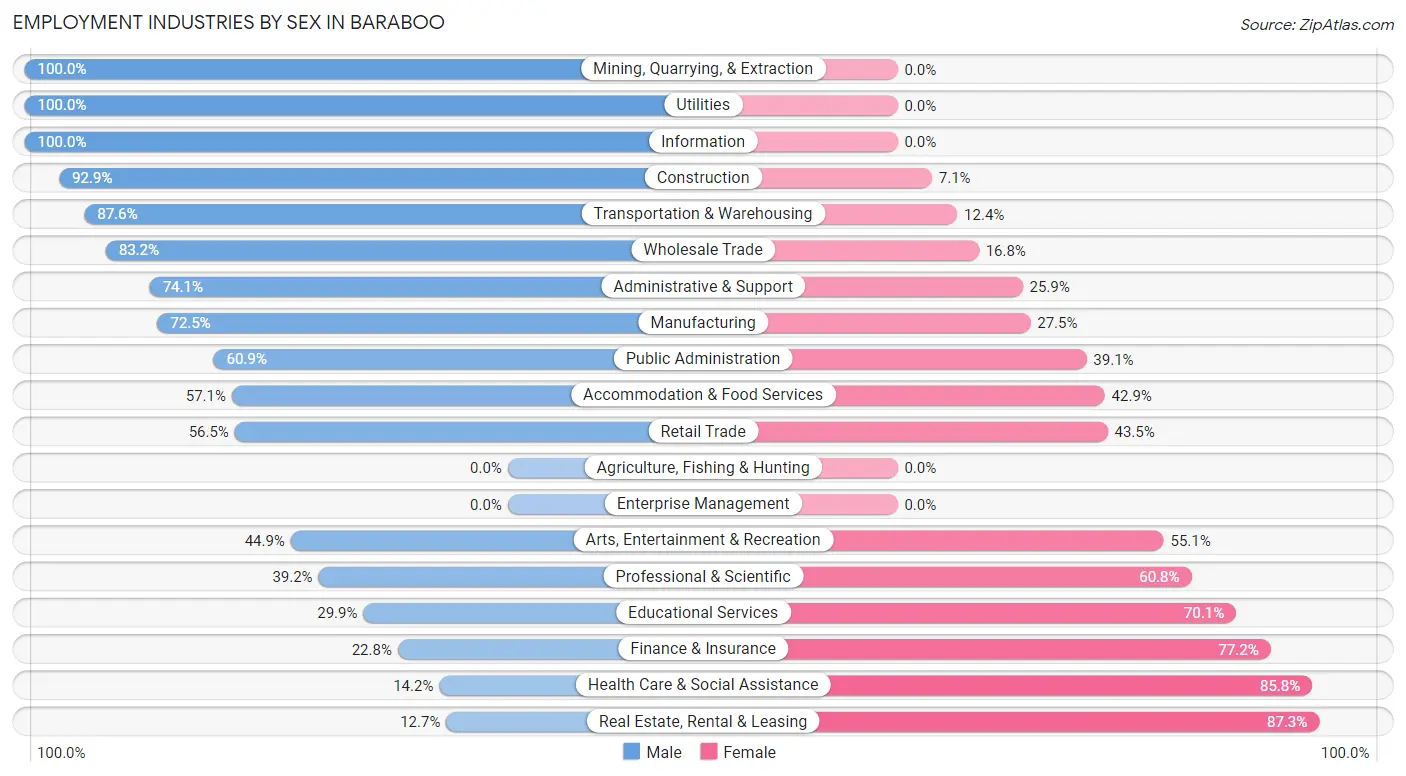
Employment Industries by Sex in Baraboo
The Baraboo industries that see more men than women are Mining, Quarrying, & Extraction (100.0%), Utilities (100.0%), and Information (100.0%), whereas the industries that tend to have a higher number of women are Real Estate, Rental & Leasing (87.3%), Health Care & Social Assistance (85.8%), and Finance & Insurance (77.2%).
| Industry | Male | Female |
| Agriculture, Fishing & Hunting | 0 (0.0%) | 0 (0.0%) |
| Mining, Quarrying, & Extraction | 92 (100.0%) | 0 (0.0%) |
| Construction | 274 (92.9%) | 21 (7.1%) |
| Manufacturing | 804 (72.5%) | 305 (27.5%) |
| Wholesale Trade | 183 (83.2%) | 37 (16.8%) |
| Retail Trade | 508 (56.5%) | 391 (43.5%) |
| Transportation & Warehousing | 234 (87.6%) | 33 (12.4%) |
| Utilities | 18 (100.0%) | 0 (0.0%) |
| Information | 75 (100.0%) | 0 (0.0%) |
| Finance & Insurance | 69 (22.8%) | 234 (77.2%) |
| Real Estate, Rental & Leasing | 7 (12.7%) | 48 (87.3%) |
| Professional & Scientific | 125 (39.2%) | 194 (60.8%) |
| Enterprise Management | 0 (0.0%) | 0 (0.0%) |
| Administrative & Support | 123 (74.1%) | 43 (25.9%) |
| Educational Services | 119 (29.9%) | 279 (70.1%) |
| Health Care & Social Assistance | 114 (14.2%) | 690 (85.8%) |
| Arts, Entertainment & Recreation | 106 (44.9%) | 130 (55.1%) |
| Accommodation & Food Services | 490 (57.1%) | 368 (42.9%) |
| Public Administration | 221 (60.9%) | 142 (39.1%) |
| Total | 3,602 (54.8%) | 2,973 (45.2%) |
Education in Baraboo
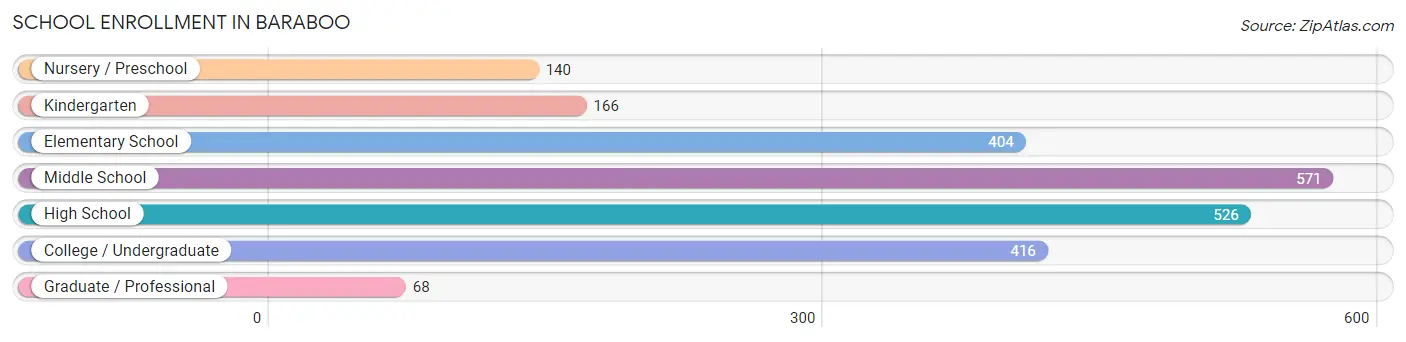
School Enrollment in Baraboo
The most common levels of schooling among the 2,291 students in Baraboo are middle school (571 | 24.9%), high school (526 | 23.0%), and college / undergraduate (416 | 18.2%).
| School Level | # Students | % Students |
| Nursery / Preschool | 140 | 6.1% |
| Kindergarten | 166 | 7.2% |
| Elementary School | 404 | 17.6% |
| Middle School | 571 | 24.9% |
| High School | 526 | 23.0% |
| College / Undergraduate | 416 | 18.2% |
| Graduate / Professional | 68 | 3.0% |
| Total | 2,291 | 100.0% |
School Enrollment by Age by Funding Source in Baraboo
Out of a total of 2,291 students who are enrolled in schools in Baraboo, 323 (14.1%) attend a private institution, while the remaining 1,968 (85.9%) are enrolled in public schools. The age group of 20 to 24 year olds has the highest likelihood of being enrolled in private schools, with 80 (38.3% in the age bracket) enrolled. Conversely, the age group of 18 to 19 year olds has the lowest likelihood of being enrolled in a private school, with 151 (100.0% in the age bracket) attending a public institution.
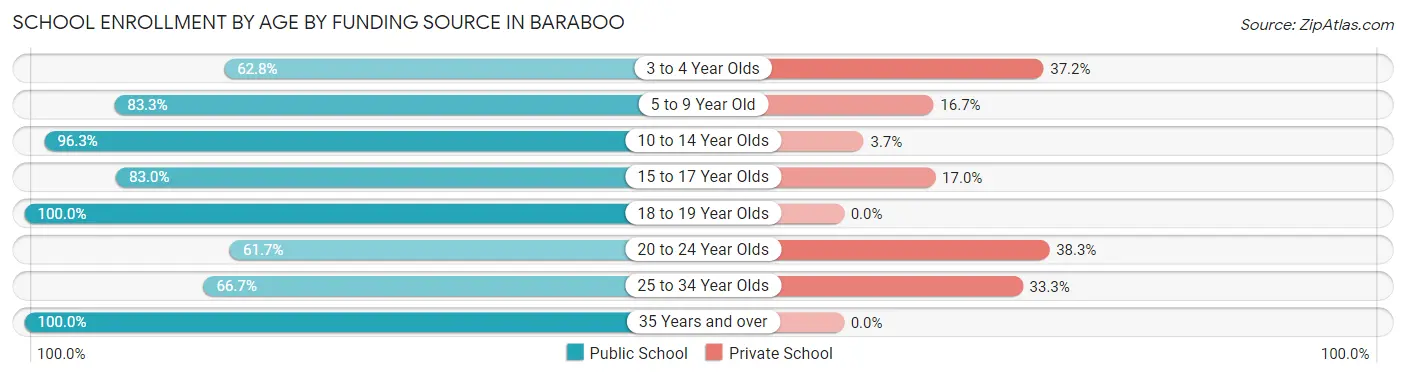
| Age Bracket | Public School | Private School |
| 3 to 4 Year Olds | 49 (62.8%) | 29 (37.2%) |
| 5 to 9 Year Old | 498 (83.3%) | 100 (16.7%) |
| 10 to 14 Year Olds | 625 (96.3%) | 24 (3.7%) |
| 15 to 17 Year Olds | 331 (83.0%) | 68 (17.0%) |
| 18 to 19 Year Olds | 151 (100.0%) | 0 (0.0%) |
| 20 to 24 Year Olds | 129 (61.7%) | 80 (38.3%) |
| 25 to 34 Year Olds | 42 (66.7%) | 21 (33.3%) |
| 35 Years and over | 144 (100.0%) | 0 (0.0%) |
| Total | 1,968 (85.9%) | 323 (14.1%) |
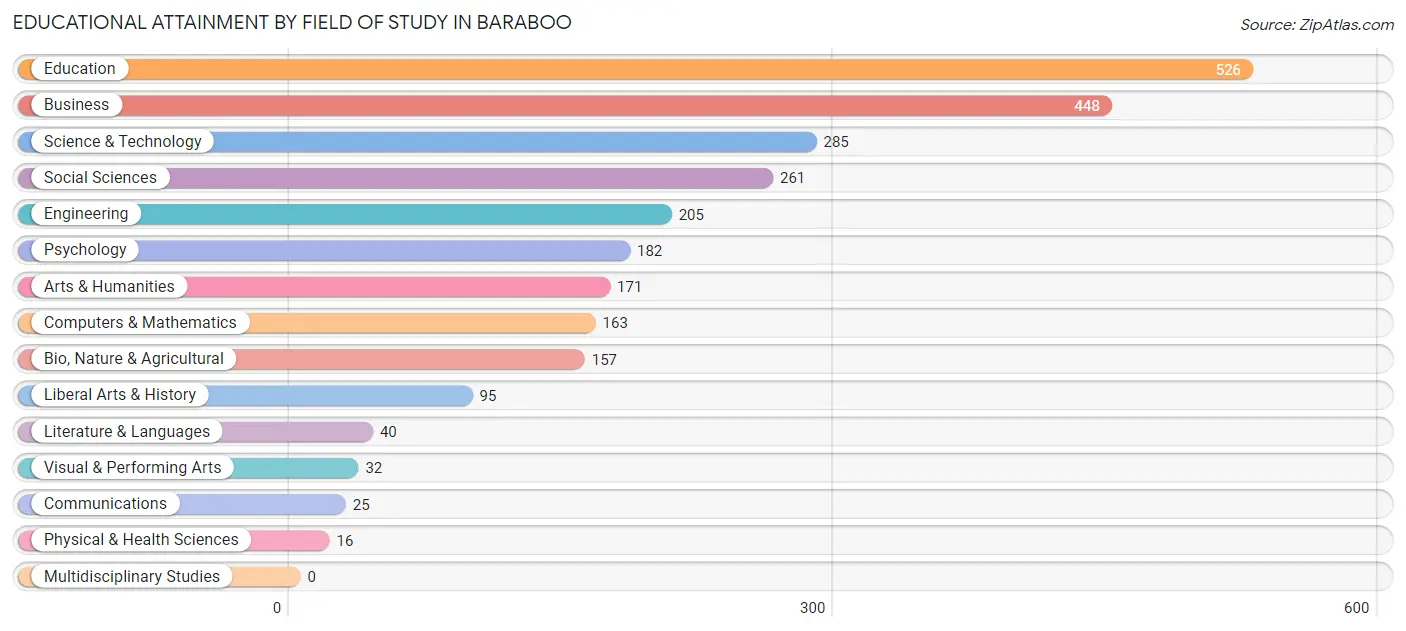
Educational Attainment by Field of Study in Baraboo
Education (526 | 20.2%), business (448 | 17.2%), science & technology (285 | 10.9%), social sciences (261 | 10.0%), and engineering (205 | 7.9%) are the most common fields of study among 2,606 individuals in Baraboo who have obtained a bachelor's degree or higher.
| Field of Study | # Graduates | % Graduates |
| Computers & Mathematics | 163 | 6.2% |
| Bio, Nature & Agricultural | 157 | 6.0% |
| Physical & Health Sciences | 16 | 0.6% |
| Psychology | 182 | 7.0% |
| Social Sciences | 261 | 10.0% |
| Engineering | 205 | 7.9% |
| Multidisciplinary Studies | 0 | 0.0% |
| Science & Technology | 285 | 10.9% |
| Business | 448 | 17.2% |
| Education | 526 | 20.2% |
| Literature & Languages | 40 | 1.5% |
| Liberal Arts & History | 95 | 3.6% |
| Visual & Performing Arts | 32 | 1.2% |
| Communications | 25 | 1.0% |
| Arts & Humanities | 171 | 6.6% |
| Total | 2,606 | 100.0% |
Transportation & Commute in Baraboo
Vehicle Availability by Sex in Baraboo
The most prevalent vehicle ownership categories in Baraboo are males with 2 vehicles (1,485, accounting for 42.2%) and females with 2 vehicles (1,106, making up 50.2%).
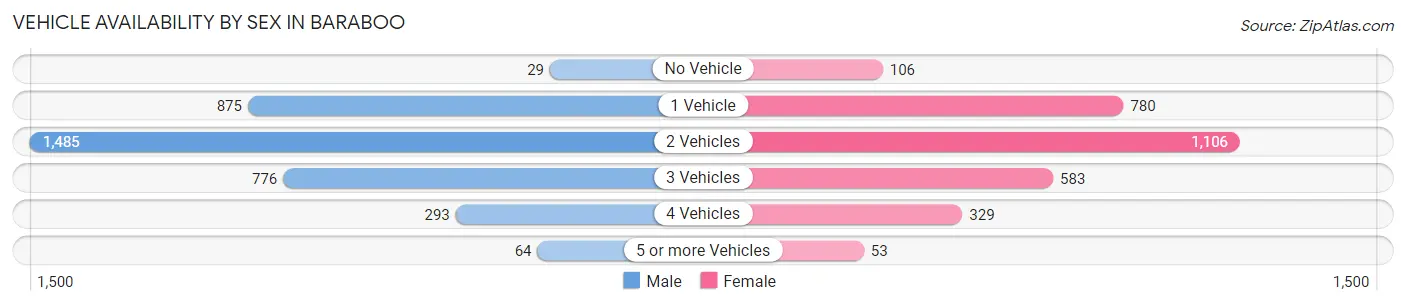
| Vehicles Available | Male | Female |
| No Vehicle | 29 (0.8%) | 106 (3.6%) |
| 1 Vehicle | 875 (24.8%) | 780 (26.4%) |
| 2 Vehicles | 1,485 (42.2%) | 1,106 (37.4%) |
| 3 Vehicles | 776 (22.0%) | 583 (19.7%) |
| 4 Vehicles | 293 (8.3%) | 329 (11.1%) |
| 5 or more Vehicles | 64 (1.8%) | 53 (1.8%) |
| Total | 3,522 (100.0%) | 2,957 (100.0%) |
Commute Time in Baraboo
The most frequently occuring commute durations in Baraboo are 5 to 9 minutes (1,478 commuters, 25.0%), 15 to 19 minutes (736 commuters, 12.4%), and 10 to 14 minutes (734 commuters, 12.4%).
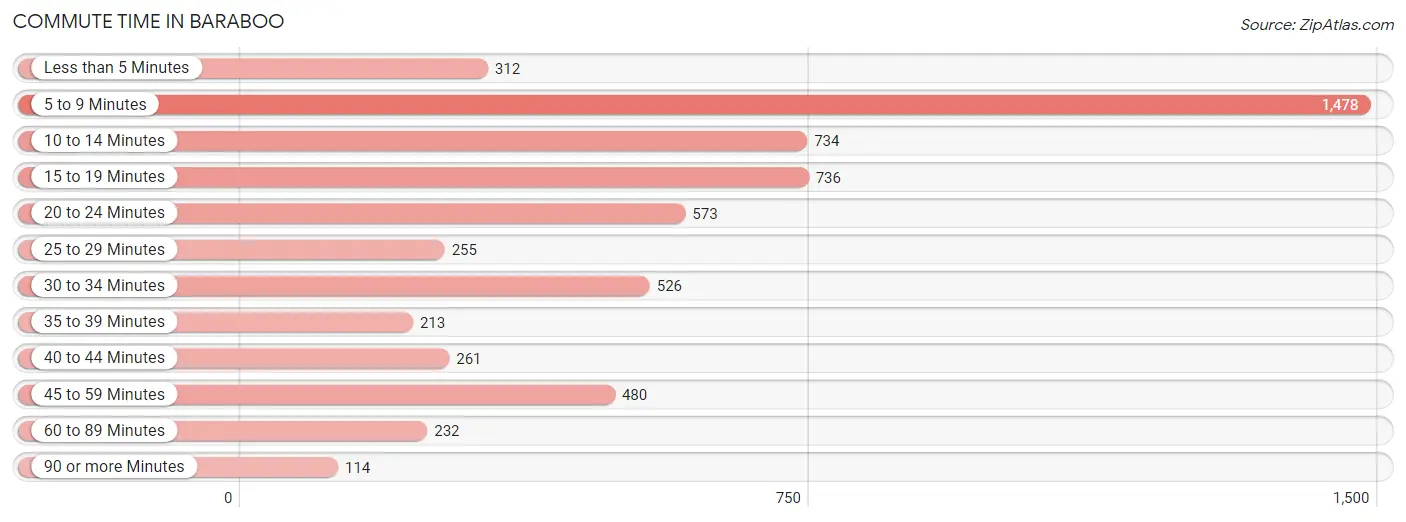
| Commute Time | # Commuters | % Commuters |
| Less than 5 Minutes | 312 | 5.3% |
| 5 to 9 Minutes | 1,478 | 25.0% |
| 10 to 14 Minutes | 734 | 12.4% |
| 15 to 19 Minutes | 736 | 12.4% |
| 20 to 24 Minutes | 573 | 9.7% |
| 25 to 29 Minutes | 255 | 4.3% |
| 30 to 34 Minutes | 526 | 8.9% |
| 35 to 39 Minutes | 213 | 3.6% |
| 40 to 44 Minutes | 261 | 4.4% |
| 45 to 59 Minutes | 480 | 8.1% |
| 60 to 89 Minutes | 232 | 3.9% |
| 90 or more Minutes | 114 | 1.9% |
Commute Time by Sex in Baraboo
The most common commute times in Baraboo are 5 to 9 minutes (802 commuters, 24.1%) for males and 5 to 9 minutes (676 commuters, 26.1%) for females.
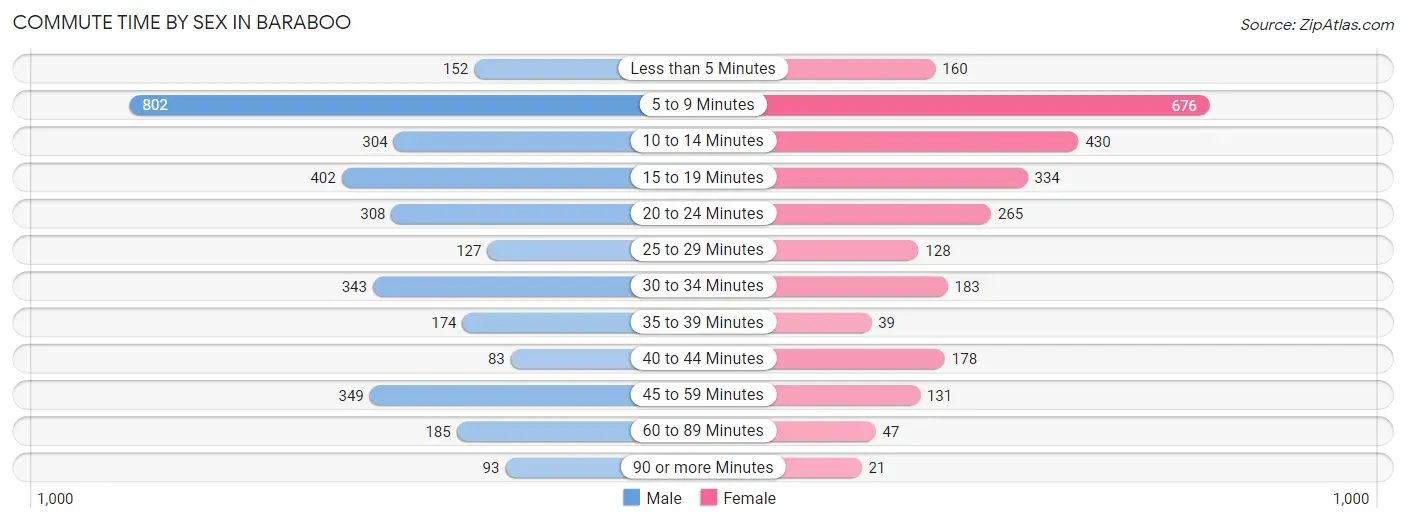
| Commute Time | Male | Female |
| Less than 5 Minutes | 152 (4.6%) | 160 (6.2%) |
| 5 to 9 Minutes | 802 (24.1%) | 676 (26.1%) |
| 10 to 14 Minutes | 304 (9.1%) | 430 (16.6%) |
| 15 to 19 Minutes | 402 (12.1%) | 334 (12.9%) |
| 20 to 24 Minutes | 308 (9.3%) | 265 (10.2%) |
| 25 to 29 Minutes | 127 (3.8%) | 128 (4.9%) |
| 30 to 34 Minutes | 343 (10.3%) | 183 (7.1%) |
| 35 to 39 Minutes | 174 (5.2%) | 39 (1.5%) |
| 40 to 44 Minutes | 83 (2.5%) | 178 (6.9%) |
| 45 to 59 Minutes | 349 (10.5%) | 131 (5.1%) |
| 60 to 89 Minutes | 185 (5.6%) | 47 (1.8%) |
| 90 or more Minutes | 93 (2.8%) | 21 (0.8%) |
Time of Departure to Work by Sex in Baraboo
The most frequent times of departure to work in Baraboo are 7:00 AM to 7:29 AM (489, 14.7%) for males and 7:30 AM to 7:59 AM (422, 16.3%) for females.
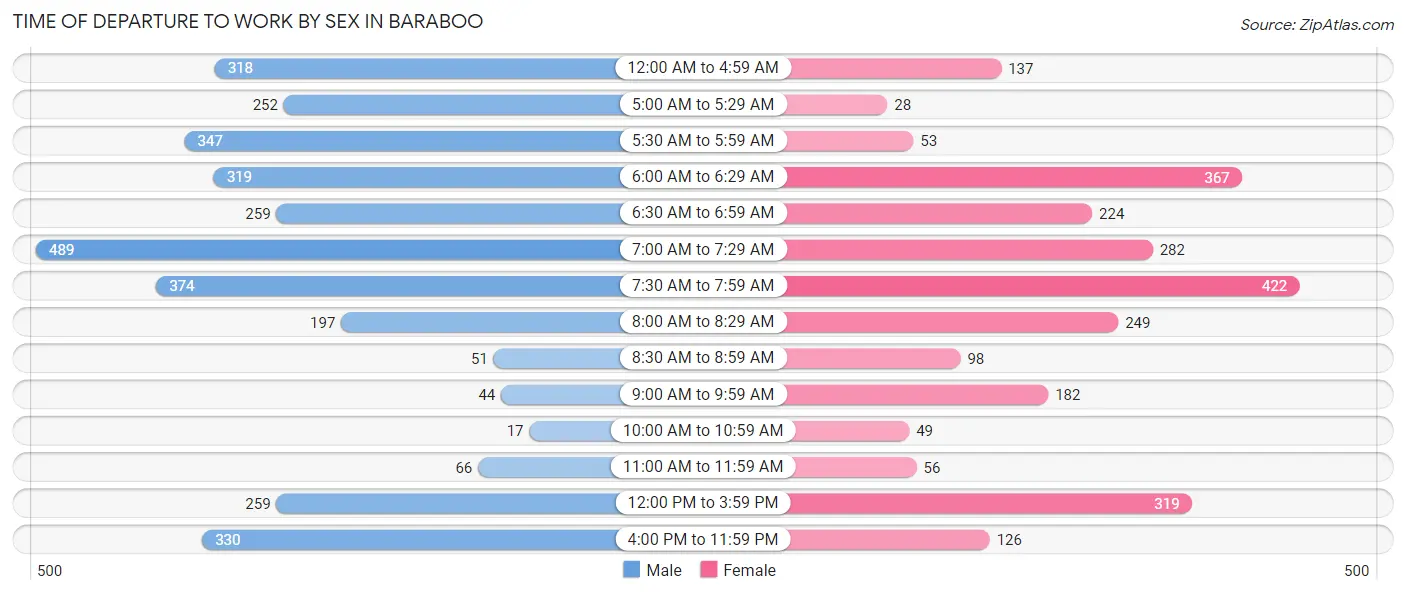
| Time of Departure | Male | Female |
| 12:00 AM to 4:59 AM | 318 (9.6%) | 137 (5.3%) |
| 5:00 AM to 5:29 AM | 252 (7.6%) | 28 (1.1%) |
| 5:30 AM to 5:59 AM | 347 (10.4%) | 53 (2.0%) |
| 6:00 AM to 6:29 AM | 319 (9.6%) | 367 (14.2%) |
| 6:30 AM to 6:59 AM | 259 (7.8%) | 224 (8.6%) |
| 7:00 AM to 7:29 AM | 489 (14.7%) | 282 (10.9%) |
| 7:30 AM to 7:59 AM | 374 (11.3%) | 422 (16.3%) |
| 8:00 AM to 8:29 AM | 197 (5.9%) | 249 (9.6%) |
| 8:30 AM to 8:59 AM | 51 (1.5%) | 98 (3.8%) |
| 9:00 AM to 9:59 AM | 44 (1.3%) | 182 (7.0%) |
| 10:00 AM to 10:59 AM | 17 (0.5%) | 49 (1.9%) |
| 11:00 AM to 11:59 AM | 66 (2.0%) | 56 (2.2%) |
| 12:00 PM to 3:59 PM | 259 (7.8%) | 319 (12.3%) |
| 4:00 PM to 11:59 PM | 330 (9.9%) | 126 (4.9%) |
| Total | 3,322 (100.0%) | 2,592 (100.0%) |
Housing Occupancy in Baraboo
Occupancy by Ownership in Baraboo
Of the total 5,727 dwellings in Baraboo, owner-occupied units account for 3,742 (65.3%), while renter-occupied units make up 1,985 (34.7%).
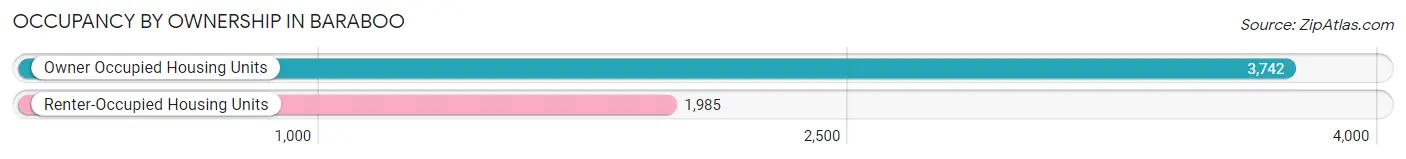
| Occupancy | # Housing Units | % Housing Units |
| Owner Occupied Housing Units | 3,742 | 65.3% |
| Renter-Occupied Housing Units | 1,985 | 34.7% |
| Total Occupied Housing Units | 5,727 | 100.0% |
Occupancy by Household Size in Baraboo
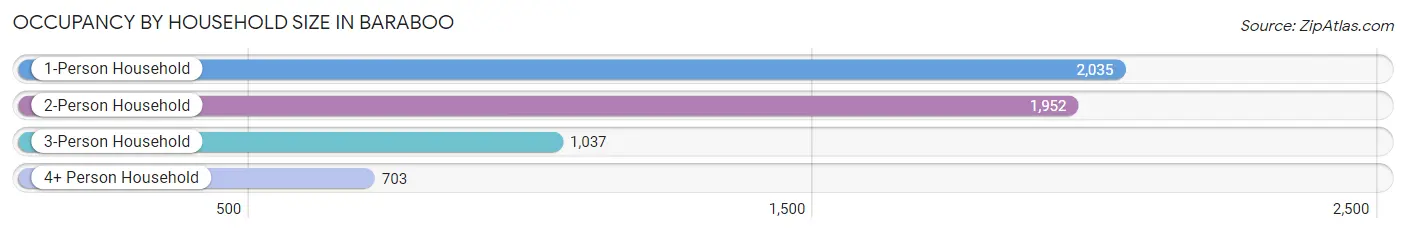
| Household Size | # Housing Units | % Housing Units |
| 1-Person Household | 2,035 | 35.5% |
| 2-Person Household | 1,952 | 34.1% |
| 3-Person Household | 1,037 | 18.1% |
| 4+ Person Household | 703 | 12.3% |
| Total Housing Units | 5,727 | 100.0% |
Occupancy by Ownership by Household Size in Baraboo
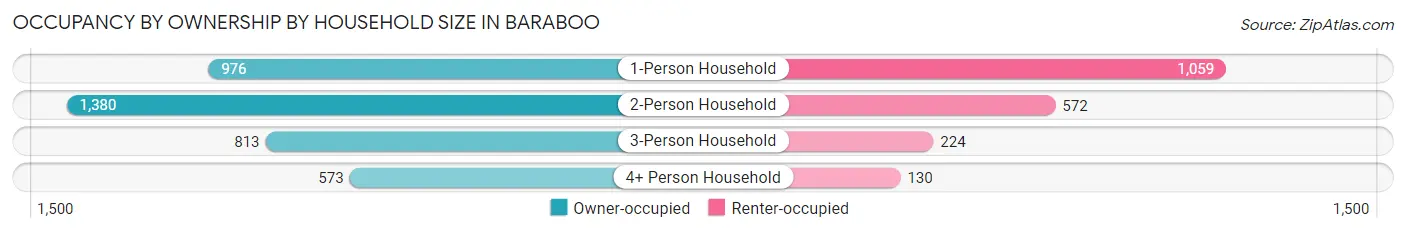
| Household Size | Owner-occupied | Renter-occupied |
| 1-Person Household | 976 (48.0%) | 1,059 (52.0%) |
| 2-Person Household | 1,380 (70.7%) | 572 (29.3%) |
| 3-Person Household | 813 (78.4%) | 224 (21.6%) |
| 4+ Person Household | 573 (81.5%) | 130 (18.5%) |
| Total Housing Units | 3,742 (65.3%) | 1,985 (34.7%) |
Occupancy by Educational Attainment in Baraboo
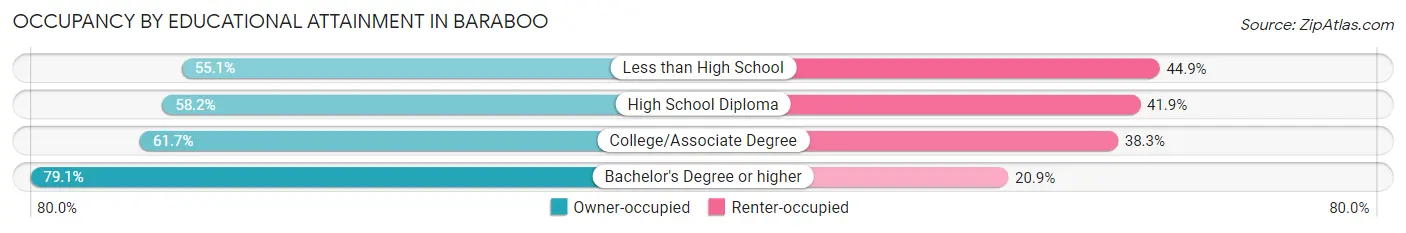
| Household Size | Owner-occupied | Renter-occupied |
| Less than High School | 250 (55.1%) | 204 (44.9%) |
| High School Diploma | 828 (58.2%) | 596 (41.8%) |
| College/Associate Degree | 1,345 (61.7%) | 836 (38.3%) |
| Bachelor's Degree or higher | 1,319 (79.1%) | 349 (20.9%) |
Occupancy by Age of Householder in Baraboo
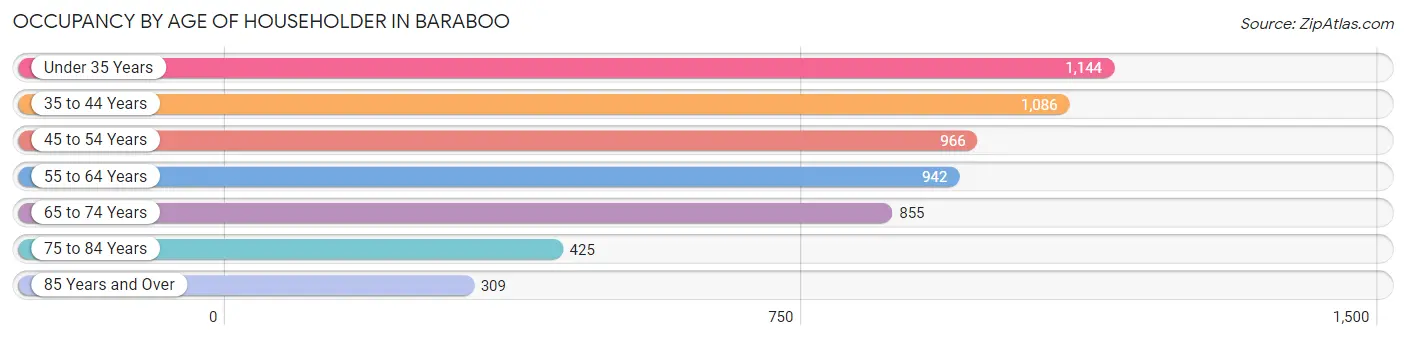
| Age Bracket | # Households | % Households |
| Under 35 Years | 1,144 | 20.0% |
| 35 to 44 Years | 1,086 | 19.0% |
| 45 to 54 Years | 966 | 16.9% |
| 55 to 64 Years | 942 | 16.5% |
| 65 to 74 Years | 855 | 14.9% |
| 75 to 84 Years | 425 | 7.4% |
| 85 Years and Over | 309 | 5.4% |
| Total | 5,727 | 100.0% |
Housing Finances in Baraboo
Median Income by Occupancy in Baraboo
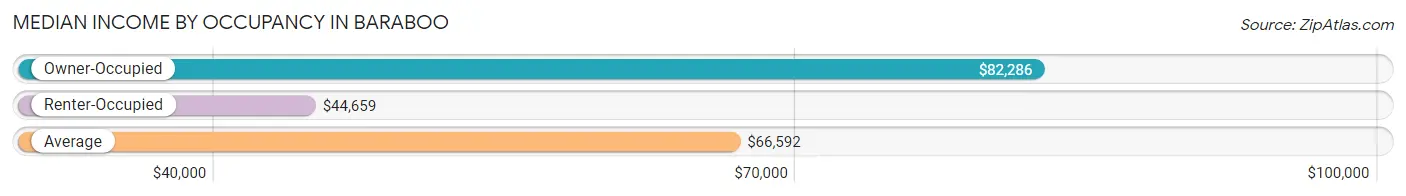
| Occupancy Type | # Households | Median Income |
| Owner-Occupied | 3,742 (65.3%) | $82,286 |
| Renter-Occupied | 1,985 (34.7%) | $44,659 |
| Average | 5,727 (100.0%) | $66,592 |
Occupancy by Householder Income Bracket in Baraboo
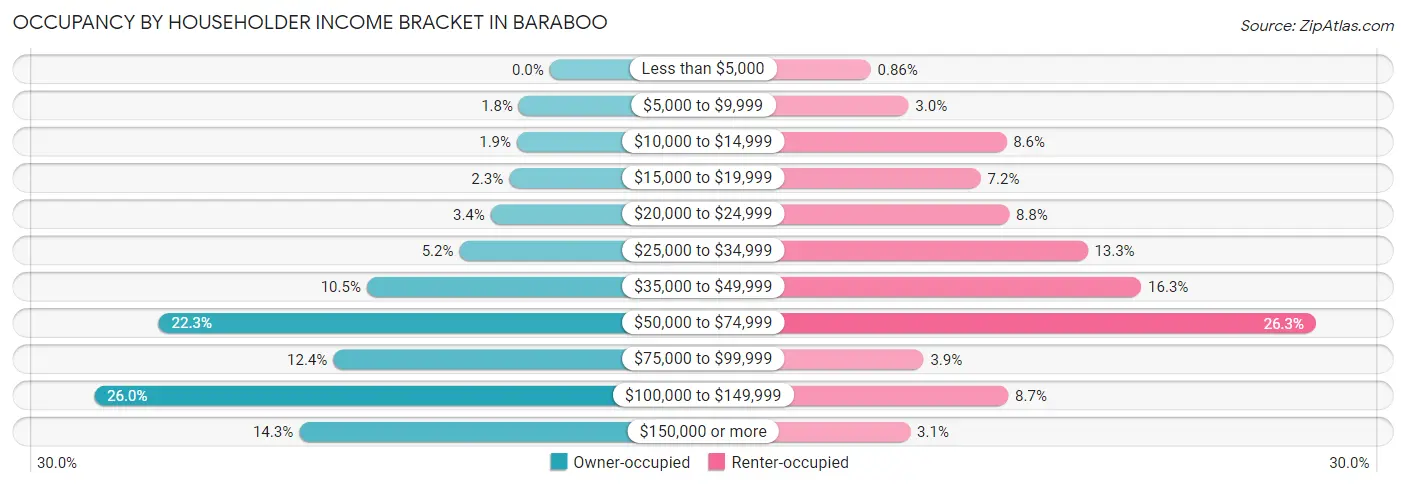
| Income Bracket | Owner-occupied | Renter-occupied |
| Less than $5,000 | 0 (0.0%) | 17 (0.9%) |
| $5,000 to $9,999 | 66 (1.8%) | 60 (3.0%) |
| $10,000 to $14,999 | 70 (1.9%) | 171 (8.6%) |
| $15,000 to $19,999 | 87 (2.3%) | 142 (7.1%) |
| $20,000 to $24,999 | 126 (3.4%) | 174 (8.8%) |
| $25,000 to $34,999 | 193 (5.2%) | 263 (13.3%) |
| $35,000 to $49,999 | 391 (10.4%) | 324 (16.3%) |
| $50,000 to $74,999 | 836 (22.3%) | 522 (26.3%) |
| $75,000 to $99,999 | 463 (12.4%) | 77 (3.9%) |
| $100,000 to $149,999 | 974 (26.0%) | 173 (8.7%) |
| $150,000 or more | 536 (14.3%) | 62 (3.1%) |
| Total | 3,742 (100.0%) | 1,985 (100.0%) |
Monthly Housing Cost Tiers in Baraboo
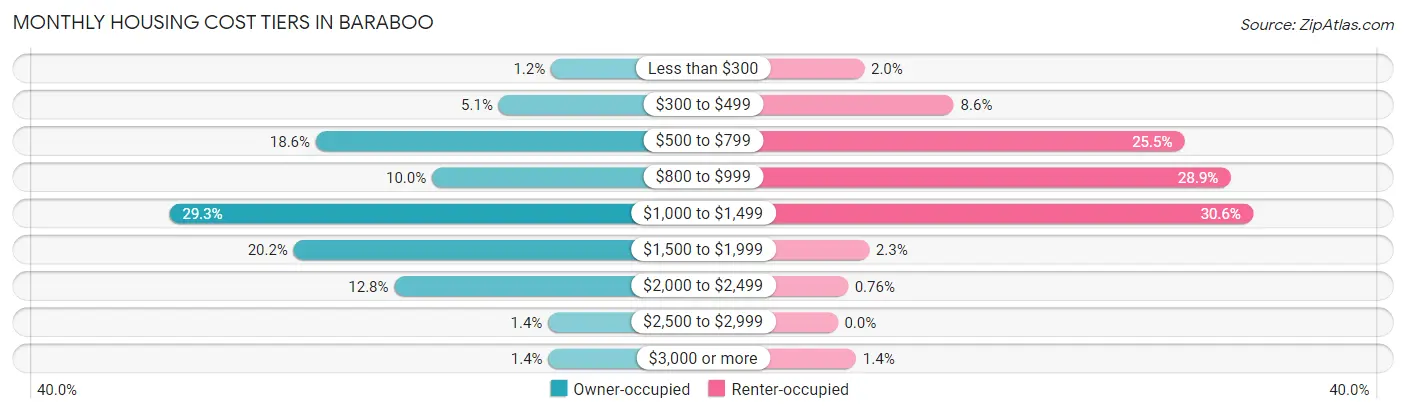
| Monthly Cost | Owner-occupied | Renter-occupied |
| Less than $300 | 46 (1.2%) | 39 (2.0%) |
| $300 to $499 | 190 (5.1%) | 170 (8.6%) |
| $500 to $799 | 694 (18.5%) | 507 (25.5%) |
| $800 to $999 | 374 (10.0%) | 574 (28.9%) |
| $1,000 to $1,499 | 1,098 (29.3%) | 607 (30.6%) |
| $1,500 to $1,999 | 755 (20.2%) | 46 (2.3%) |
| $2,000 to $2,499 | 478 (12.8%) | 15 (0.8%) |
| $2,500 to $2,999 | 54 (1.4%) | 0 (0.0%) |
| $3,000 or more | 53 (1.4%) | 27 (1.4%) |
| Total | 3,742 (100.0%) | 1,985 (100.0%) |
Physical Housing Characteristics in Baraboo
Housing Structures in Baraboo
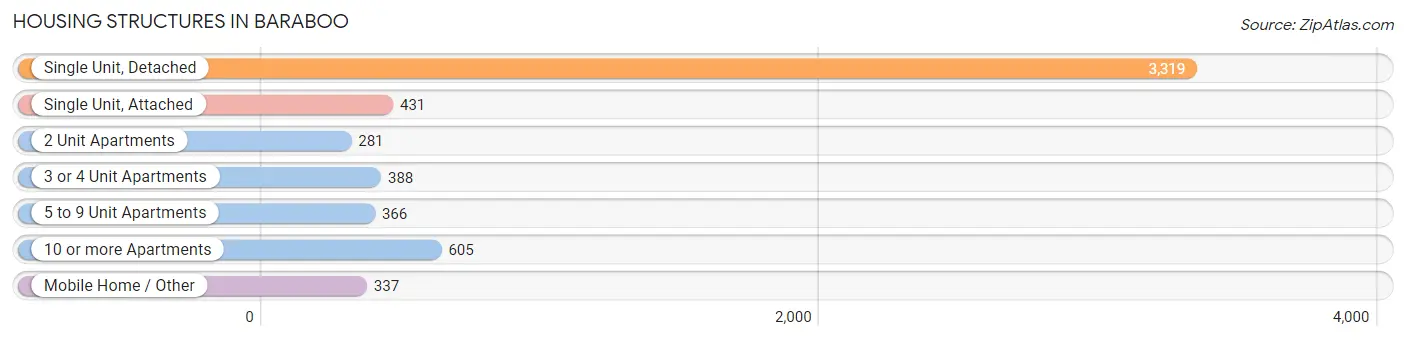
| Structure Type | # Housing Units | % Housing Units |
| Single Unit, Detached | 3,319 | 58.0% |
| Single Unit, Attached | 431 | 7.5% |
| 2 Unit Apartments | 281 | 4.9% |
| 3 or 4 Unit Apartments | 388 | 6.8% |
| 5 to 9 Unit Apartments | 366 | 6.4% |
| 10 or more Apartments | 605 | 10.6% |
| Mobile Home / Other | 337 | 5.9% |
| Total | 5,727 | 100.0% |
Housing Structures by Occupancy in Baraboo
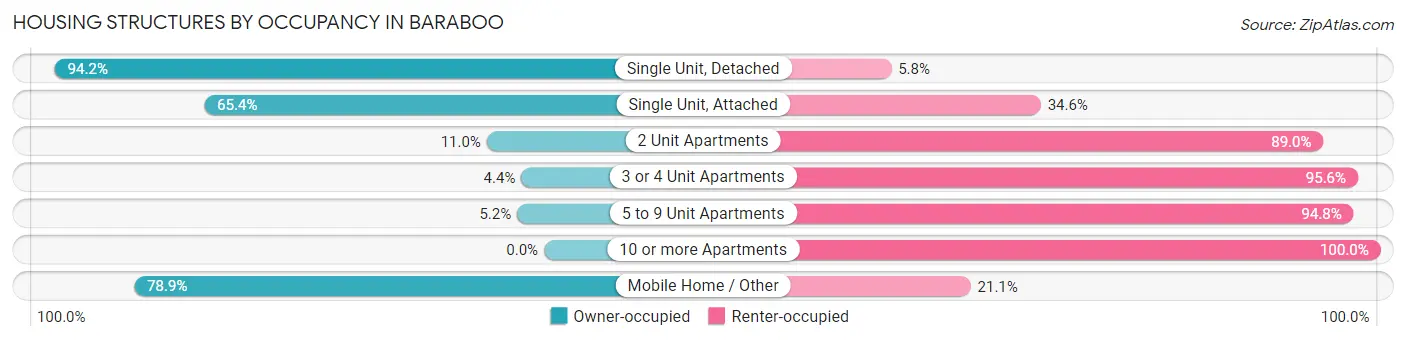
| Structure Type | Owner-occupied | Renter-occupied |
| Single Unit, Detached | 3,127 (94.2%) | 192 (5.8%) |
| Single Unit, Attached | 282 (65.4%) | 149 (34.6%) |
| 2 Unit Apartments | 31 (11.0%) | 250 (89.0%) |
| 3 or 4 Unit Apartments | 17 (4.4%) | 371 (95.6%) |
| 5 to 9 Unit Apartments | 19 (5.2%) | 347 (94.8%) |
| 10 or more Apartments | 0 (0.0%) | 605 (100.0%) |
| Mobile Home / Other | 266 (78.9%) | 71 (21.1%) |
| Total | 3,742 (65.3%) | 1,985 (34.7%) |
Housing Structures by Number of Rooms in Baraboo
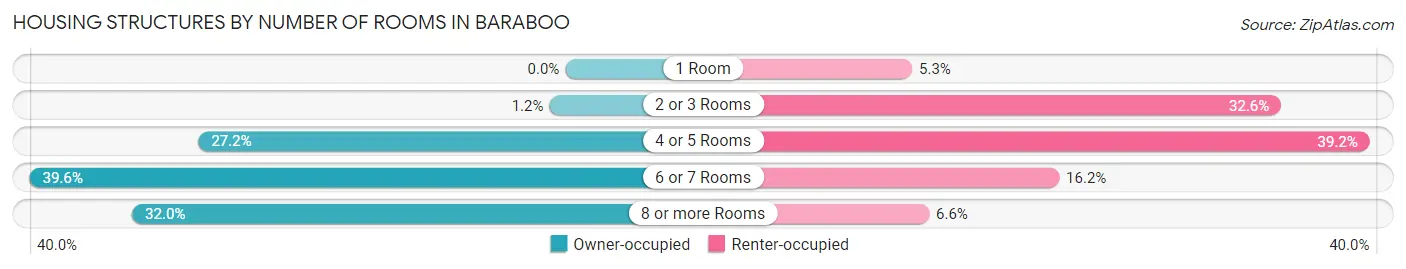
| Number of Rooms | Owner-occupied | Renter-occupied |
| 1 Room | 0 (0.0%) | 106 (5.3%) |
| 2 or 3 Rooms | 44 (1.2%) | 648 (32.6%) |
| 4 or 5 Rooms | 1,016 (27.2%) | 778 (39.2%) |
| 6 or 7 Rooms | 1,483 (39.6%) | 322 (16.2%) |
| 8 or more Rooms | 1,199 (32.0%) | 131 (6.6%) |
| Total | 3,742 (100.0%) | 1,985 (100.0%) |
Housing Structure by Heating Type in Baraboo
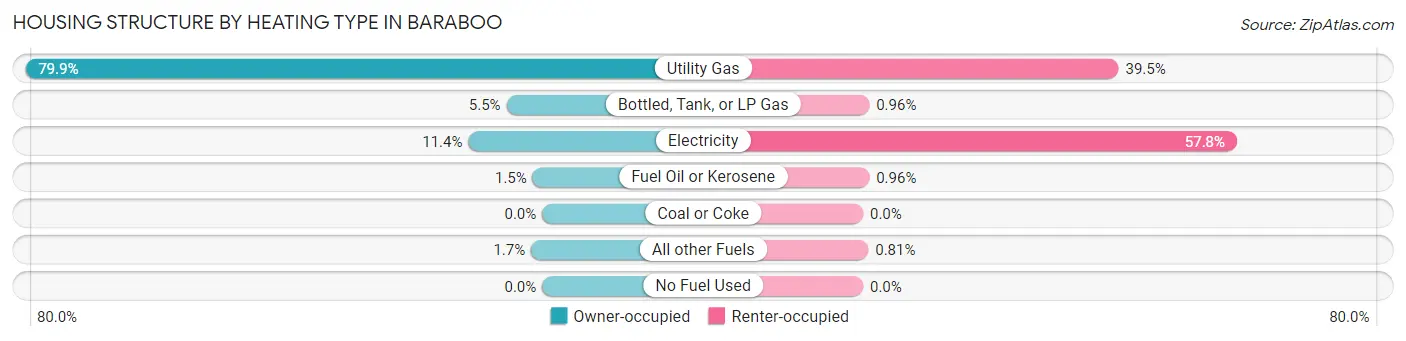
| Heating Type | Owner-occupied | Renter-occupied |
| Utility Gas | 2,990 (79.9%) | 784 (39.5%) |
| Bottled, Tank, or LP Gas | 206 (5.5%) | 19 (1.0%) |
| Electricity | 427 (11.4%) | 1,147 (57.8%) |
| Fuel Oil or Kerosene | 55 (1.5%) | 19 (1.0%) |
| Coal or Coke | 0 (0.0%) | 0 (0.0%) |
| All other Fuels | 64 (1.7%) | 16 (0.8%) |
| No Fuel Used | 0 (0.0%) | 0 (0.0%) |
| Total | 3,742 (100.0%) | 1,985 (100.0%) |
Household Vehicle Usage in Baraboo
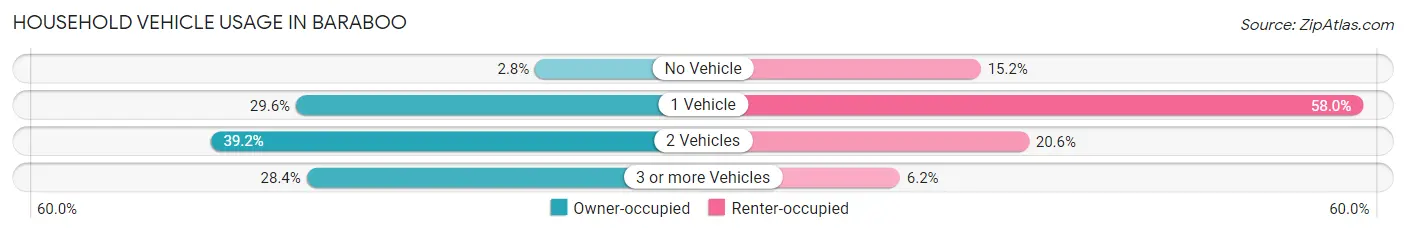
| Vehicles per Household | Owner-occupied | Renter-occupied |
| No Vehicle | 105 (2.8%) | 302 (15.2%) |
| 1 Vehicle | 1,108 (29.6%) | 1,152 (58.0%) |
| 2 Vehicles | 1,466 (39.2%) | 409 (20.6%) |
| 3 or more Vehicles | 1,063 (28.4%) | 122 (6.1%) |
| Total | 3,742 (100.0%) | 1,985 (100.0%) |
Real Estate & Mortgages in Baraboo
Real Estate and Mortgage Overview in Baraboo
| Characteristic | Without Mortgage | With Mortgage |
| Housing Units | 1,071 | 2,671 |
| Median Property Value | $168,300 | $199,600 |
| Median Household Income | $52,614 | $462 |
| Monthly Housing Costs | $648 | $43 |
| Real Estate Taxes | $3,261 | $23 |
Property Value by Mortgage Status in Baraboo
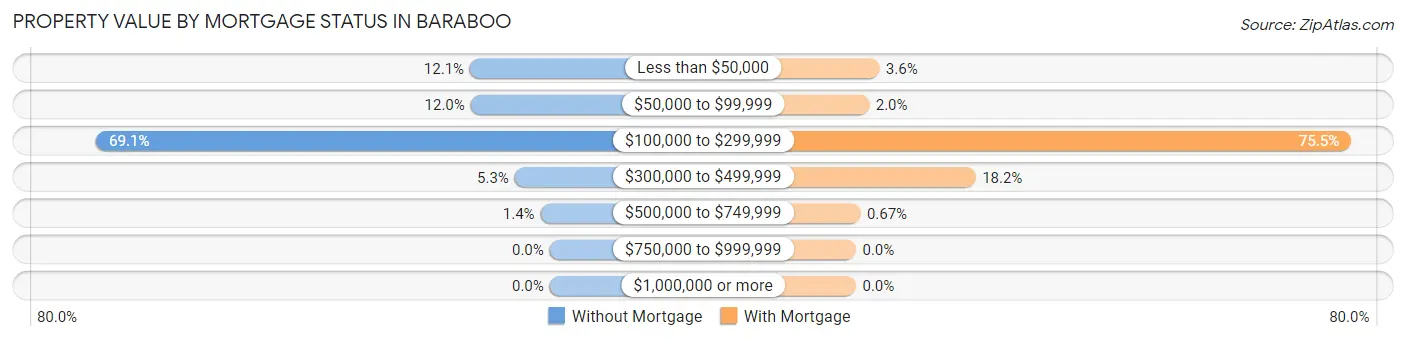
| Property Value | Without Mortgage | With Mortgage |
| Less than $50,000 | 130 (12.1%) | 95 (3.6%) |
| $50,000 to $99,999 | 129 (12.0%) | 54 (2.0%) |
| $100,000 to $299,999 | 740 (69.1%) | 2,017 (75.5%) |
| $300,000 to $499,999 | 57 (5.3%) | 487 (18.2%) |
| $500,000 to $749,999 | 15 (1.4%) | 18 (0.7%) |
| $750,000 to $999,999 | 0 (0.0%) | 0 (0.0%) |
| $1,000,000 or more | 0 (0.0%) | 0 (0.0%) |
| Total | 1,071 (100.0%) | 2,671 (100.0%) |
Household Income by Mortgage Status in Baraboo
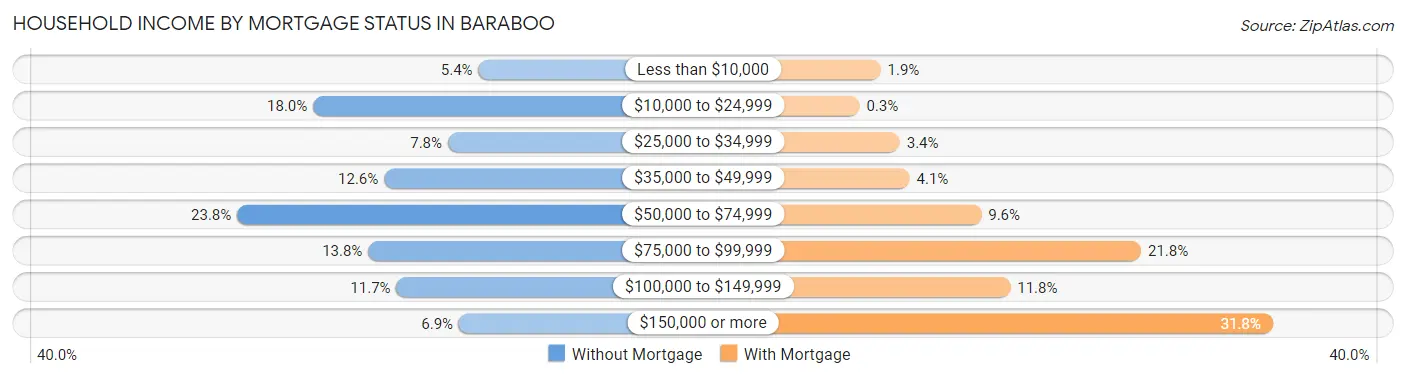
| Household Income | Without Mortgage | With Mortgage |
| Less than $10,000 | 58 (5.4%) | 51 (1.9%) |
| $10,000 to $24,999 | 193 (18.0%) | 8 (0.3%) |
| $25,000 to $34,999 | 83 (7.7%) | 90 (3.4%) |
| $35,000 to $49,999 | 135 (12.6%) | 110 (4.1%) |
| $50,000 to $74,999 | 255 (23.8%) | 256 (9.6%) |
| $75,000 to $99,999 | 148 (13.8%) | 581 (21.7%) |
| $100,000 to $149,999 | 125 (11.7%) | 315 (11.8%) |
| $150,000 or more | 74 (6.9%) | 849 (31.8%) |
| Total | 1,071 (100.0%) | 2,671 (100.0%) |
Property Value to Household Income Ratio in Baraboo
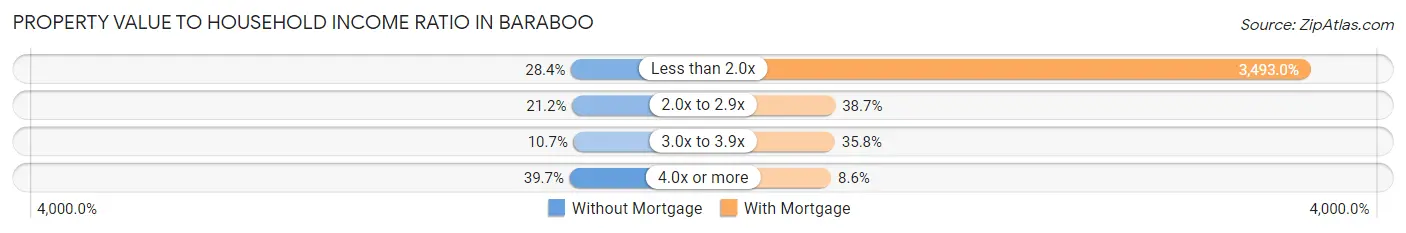
| Value-to-Income Ratio | Without Mortgage | With Mortgage |
| Less than 2.0x | 304 (28.4%) | 93,299 (3,493.0%) |
| 2.0x to 2.9x | 227 (21.2%) | 1,034 (38.7%) |
| 3.0x to 3.9x | 115 (10.7%) | 956 (35.8%) |
| 4.0x or more | 425 (39.7%) | 230 (8.6%) |
| Total | 1,071 (100.0%) | 2,671 (100.0%) |
Real Estate Taxes by Mortgage Status in Baraboo
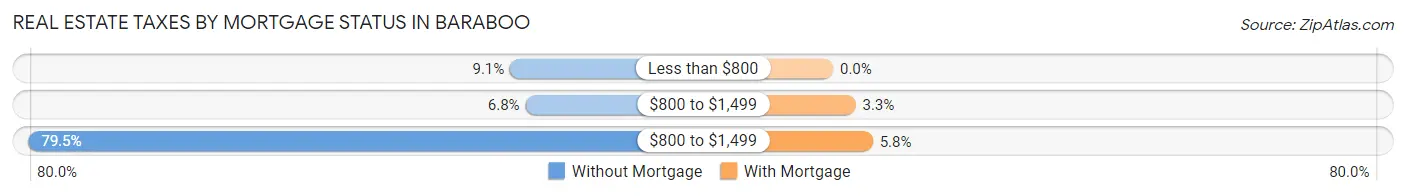
| Property Taxes | Without Mortgage | With Mortgage |
| Less than $800 | 97 (9.1%) | 0 (0.0%) |
| $800 to $1,499 | 73 (6.8%) | 88 (3.3%) |
| $800 to $1,499 | 851 (79.5%) | 155 (5.8%) |
| Total | 1,071 (100.0%) | 2,671 (100.0%) |
Health & Disability in Baraboo
Health Insurance Coverage by Age in Baraboo
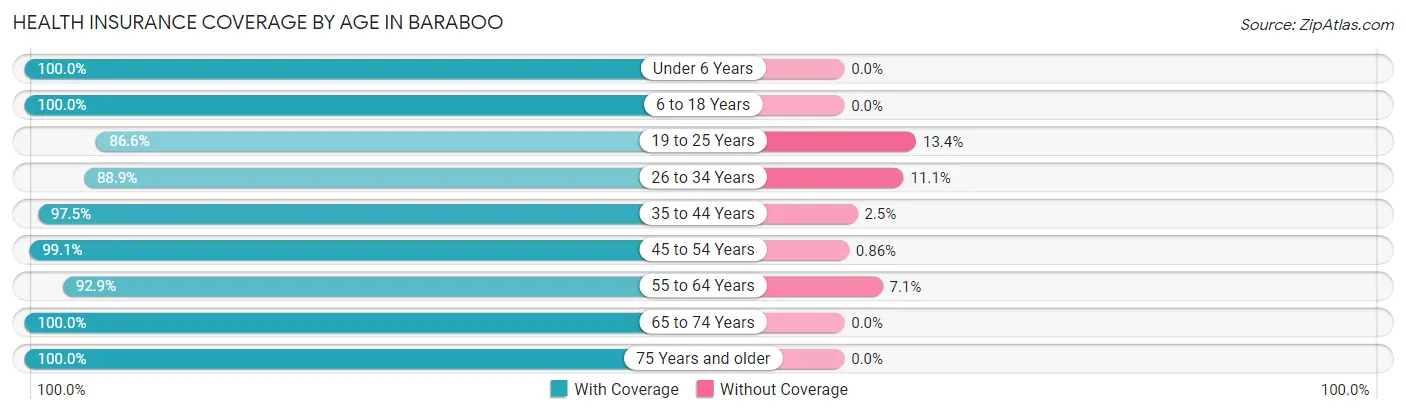
| Age Bracket | With Coverage | Without Coverage |
| Under 6 Years | 701 (100.0%) | 0 (0.0%) |
| 6 to 18 Years | 1,733 (100.0%) | 0 (0.0%) |
| 19 to 25 Years | 848 (86.6%) | 131 (13.4%) |
| 26 to 34 Years | 1,446 (88.9%) | 180 (11.1%) |
| 35 to 44 Years | 1,822 (97.5%) | 46 (2.5%) |
| 45 to 54 Years | 1,492 (99.1%) | 13 (0.9%) |
| 55 to 64 Years | 1,497 (92.9%) | 115 (7.1%) |
| 65 to 74 Years | 1,205 (100.0%) | 0 (0.0%) |
| 75 Years and older | 1,027 (100.0%) | 0 (0.0%) |
| Total | 11,771 (96.0%) | 485 (4.0%) |
Health Insurance Coverage by Citizenship Status in Baraboo
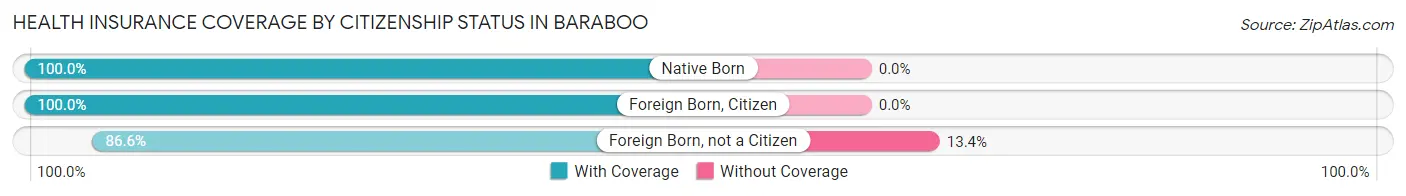
| Citizenship Status | With Coverage | Without Coverage |
| Native Born | 701 (100.0%) | 0 (0.0%) |
| Foreign Born, Citizen | 1,733 (100.0%) | 0 (0.0%) |
| Foreign Born, not a Citizen | 848 (86.6%) | 131 (13.4%) |
Health Insurance Coverage by Household Income in Baraboo
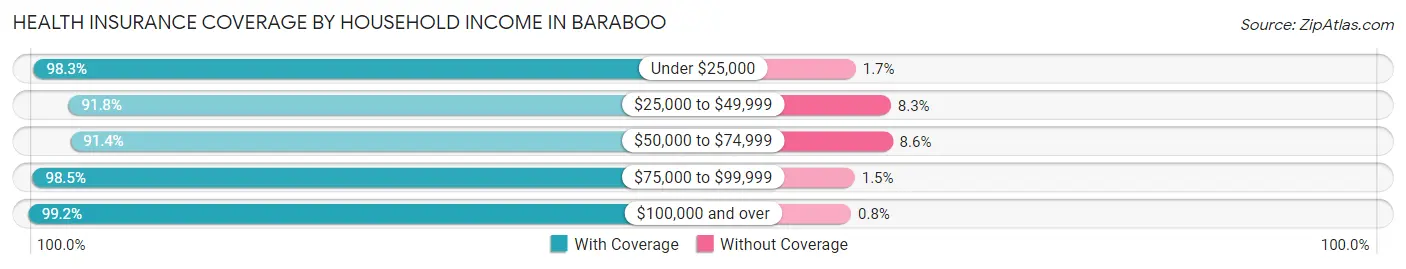
| Household Income | With Coverage | Without Coverage |
| Under $25,000 | 1,161 (98.3%) | 20 (1.7%) |
| $25,000 to $49,999 | 1,835 (91.7%) | 165 (8.3%) |
| $50,000 to $74,999 | 2,554 (91.4%) | 240 (8.6%) |
| $75,000 to $99,999 | 1,446 (98.5%) | 22 (1.5%) |
| $100,000 and over | 4,726 (99.2%) | 38 (0.8%) |
Public vs Private Health Insurance Coverage by Age in Baraboo
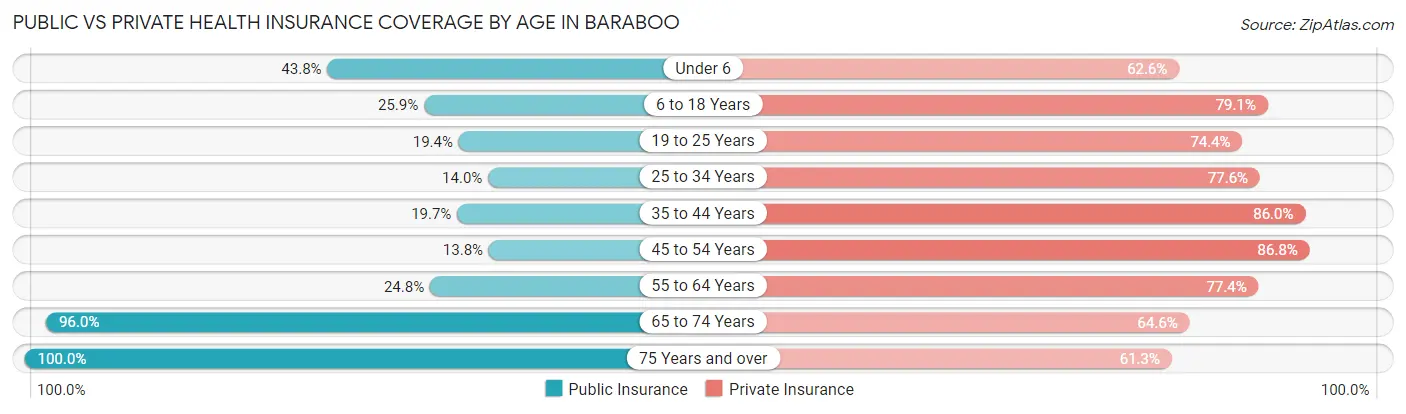
| Age Bracket | Public Insurance | Private Insurance |
| Under 6 | 307 (43.8%) | 439 (62.6%) |
| 6 to 18 Years | 448 (25.9%) | 1,370 (79.0%) |
| 19 to 25 Years | 190 (19.4%) | 728 (74.4%) |
| 25 to 34 Years | 227 (14.0%) | 1,262 (77.6%) |
| 35 to 44 Years | 368 (19.7%) | 1,607 (86.0%) |
| 45 to 54 Years | 208 (13.8%) | 1,307 (86.8%) |
| 55 to 64 Years | 399 (24.7%) | 1,247 (77.4%) |
| 65 to 74 Years | 1,157 (96.0%) | 778 (64.6%) |
| 75 Years and over | 1,027 (100.0%) | 629 (61.3%) |
| Total | 4,331 (35.3%) | 9,367 (76.4%) |
Disability Status by Sex by Age in Baraboo
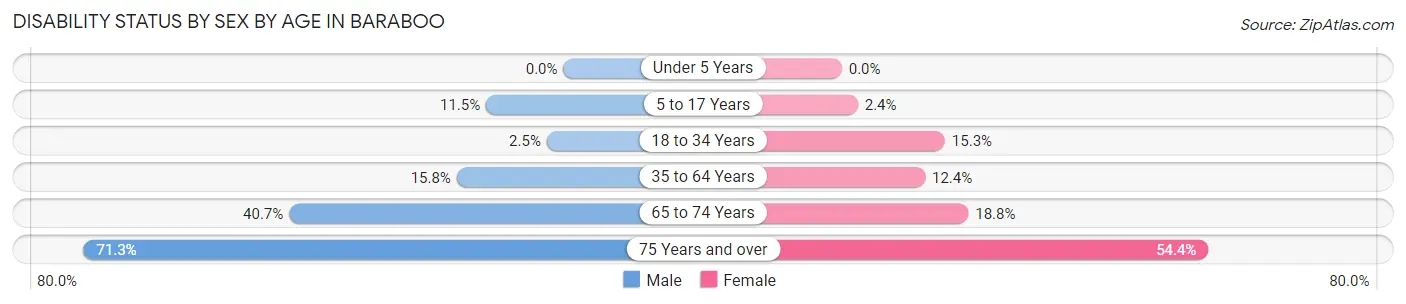
| Age Bracket | Male | Female |
| Under 5 Years | 0 (0.0%) | 0 (0.0%) |
| 5 to 17 Years | 76 (11.5%) | 24 (2.4%) |
| 18 to 34 Years | 37 (2.5%) | 193 (15.3%) |
| 35 to 64 Years | 391 (15.8%) | 311 (12.4%) |
| 65 to 74 Years | 261 (40.7%) | 106 (18.8%) |
| 75 Years and over | 238 (71.3%) | 377 (54.4%) |
Disability Class by Sex by Age in Baraboo
Disability Class: Hearing Difficulty
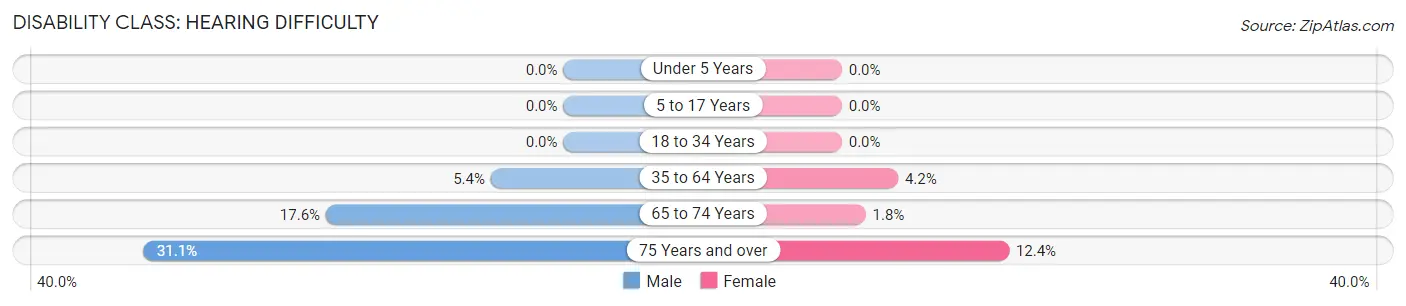
| Age Bracket | Male | Female |
| Under 5 Years | 0 (0.0%) | 0 (0.0%) |
| 5 to 17 Years | 0 (0.0%) | 0 (0.0%) |
| 18 to 34 Years | 0 (0.0%) | 0 (0.0%) |
| 35 to 64 Years | 133 (5.4%) | 105 (4.2%) |
| 65 to 74 Years | 113 (17.6%) | 10 (1.8%) |
| 75 Years and over | 104 (31.1%) | 86 (12.4%) |
Disability Class: Vision Difficulty
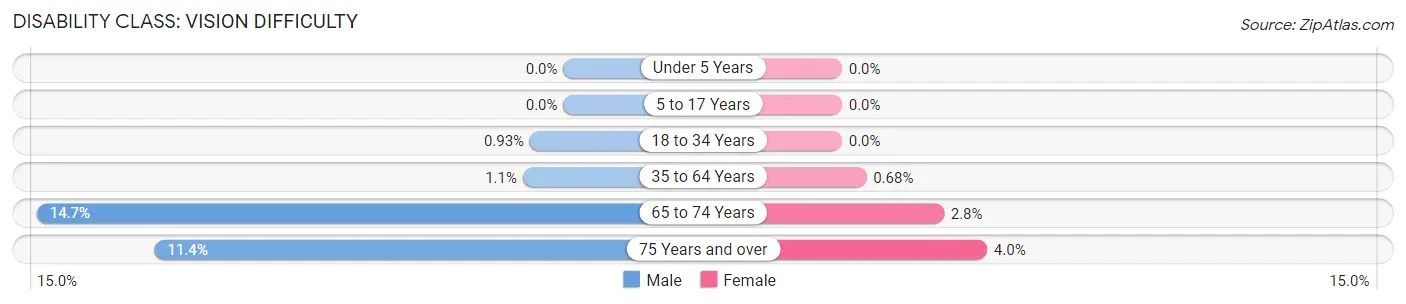
| Age Bracket | Male | Female |
| Under 5 Years | 0 (0.0%) | 0 (0.0%) |
| 5 to 17 Years | 0 (0.0%) | 0 (0.0%) |
| 18 to 34 Years | 14 (0.9%) | 0 (0.0%) |
| 35 to 64 Years | 28 (1.1%) | 17 (0.7%) |
| 65 to 74 Years | 94 (14.7%) | 16 (2.8%) |
| 75 Years and over | 38 (11.4%) | 28 (4.0%) |
Disability Class: Cognitive Difficulty
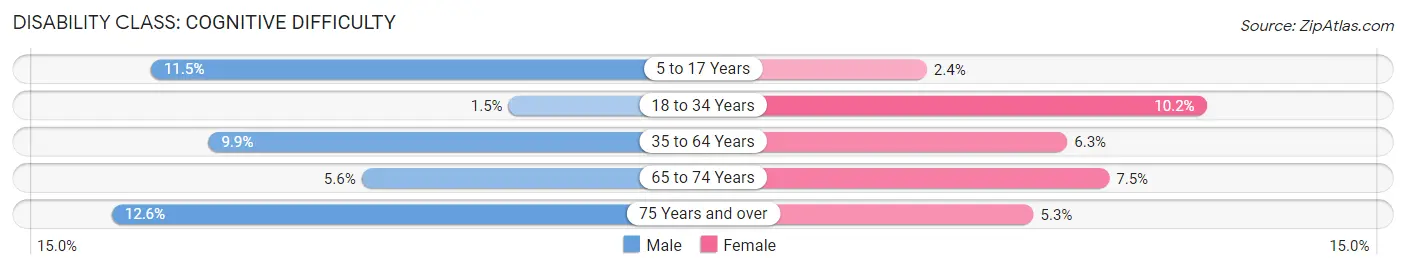
| Age Bracket | Male | Female |
| 5 to 17 Years | 76 (11.5%) | 24 (2.4%) |
| 18 to 34 Years | 23 (1.5%) | 128 (10.2%) |
| 35 to 64 Years | 244 (9.9%) | 158 (6.3%) |
| 65 to 74 Years | 36 (5.6%) | 42 (7.4%) |
| 75 Years and over | 42 (12.6%) | 37 (5.3%) |
Disability Class: Ambulatory Difficulty
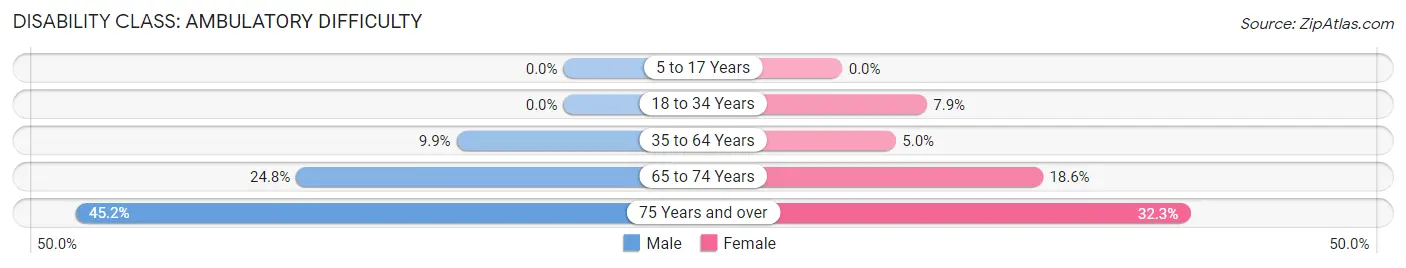
| Age Bracket | Male | Female |
| 5 to 17 Years | 0 (0.0%) | 0 (0.0%) |
| 18 to 34 Years | 0 (0.0%) | 99 (7.9%) |
| 35 to 64 Years | 245 (9.9%) | 125 (5.0%) |
| 65 to 74 Years | 159 (24.8%) | 105 (18.6%) |
| 75 Years and over | 151 (45.2%) | 224 (32.3%) |
Disability Class: Self-Care Difficulty
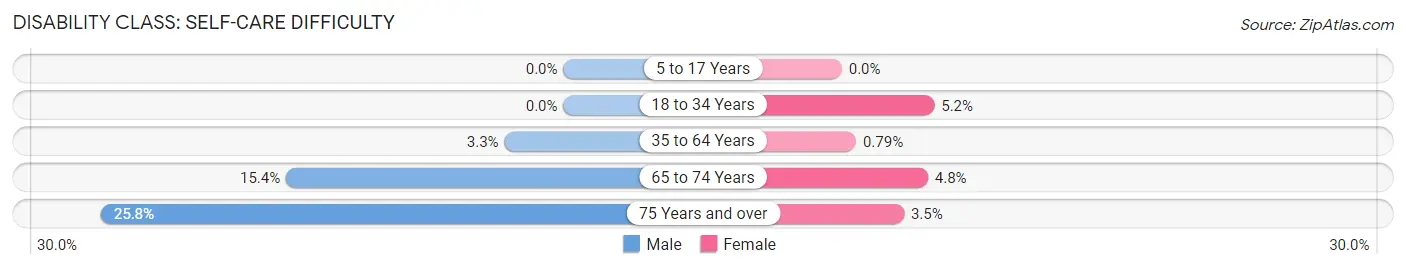
| Age Bracket | Male | Female |
| 5 to 17 Years | 0 (0.0%) | 0 (0.0%) |
| 18 to 34 Years | 0 (0.0%) | 65 (5.1%) |
| 35 to 64 Years | 81 (3.3%) | 20 (0.8%) |
| 65 to 74 Years | 99 (15.4%) | 27 (4.8%) |
| 75 Years and over | 86 (25.8%) | 24 (3.5%) |
Technology Access in Baraboo
Computing Device Access in Baraboo
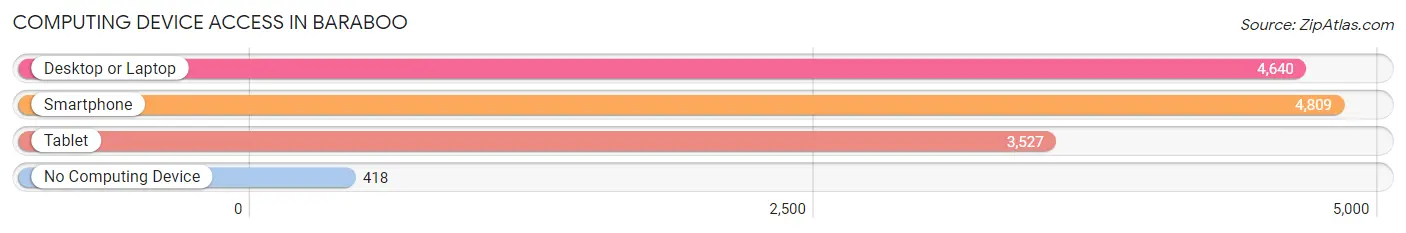
| Device Type | # Households | % Households |
| Desktop or Laptop | 4,640 | 81.0% |
| Smartphone | 4,809 | 84.0% |
| Tablet | 3,527 | 61.6% |
| No Computing Device | 418 | 7.3% |
| Total | 5,727 | 100.0% |
Internet Access in Baraboo
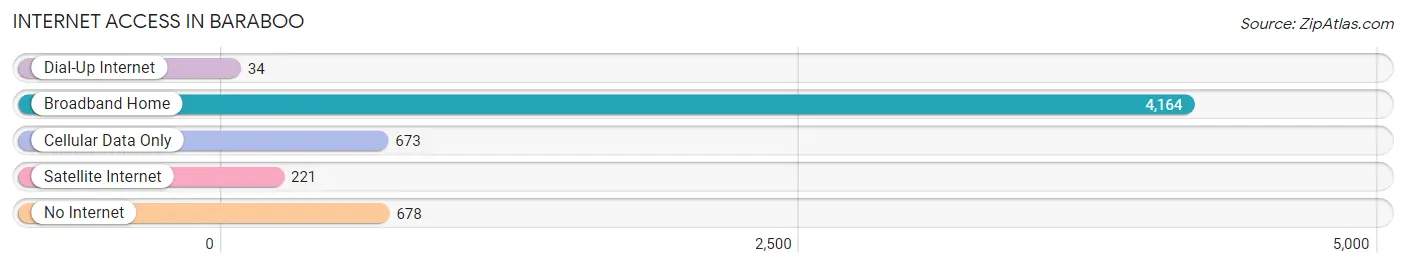
| Internet Type | # Households | % Households |
| Dial-Up Internet | 34 | 0.6% |
| Broadband Home | 4,164 | 72.7% |
| Cellular Data Only | 673 | 11.7% |
| Satellite Internet | 221 | 3.9% |
| No Internet | 678 | 11.8% |
| Total | 5,727 | 100.0% |
Baraboo Summary
Baraboo, Wisconsin is a city located in Sauk County, Wisconsin, United States. It is situated on the Baraboo River, approximately 80 miles northwest of Milwaukee and 100 miles southwest of Madison. The city is the county seat of Sauk County and is home to the Circus World Museum, the International Crane Foundation, and the Aldo Leopold Foundation. As of the 2010 census, the city had a population of 12,048.
History
The area that is now Baraboo was originally inhabited by the Ho-Chunk Native American tribe. The first white settlers arrived in the area in the 1830s, and the city was officially founded in 1838. The city was named after the nearby river, which was named by the Ho-Chunk for the French phrase “barbeau”, meaning “beautiful river”.
In 1856, the first circus in the United States, the Van Amburgh & Co. Circus, was founded in Baraboo. The circus was a major success and eventually became the Ringling Brothers Circus. The Ringling Brothers Circus was based in Baraboo until 1918, when it moved to Sarasota, Florida.
In the late 19th century, Baraboo became a major center for the lumber industry. The city was home to several large sawmills and was a major supplier of lumber to the rest of the country.
Geography
Baraboo is located at 43°26′N 89°45′W (43.4333, -89.7500). According to the United States Census Bureau, the city has a total area of 8.2 square miles (21.2 km2), of which 8.1 square miles (21.0 km2) is land and 0.1 square miles (0.2 km2) is water.
The city is located in the Baraboo Valley, which is surrounded by the Baraboo Range to the east and the Wisconsin Dells to the west. The Baraboo River runs through the city.
Economy
Baraboo’s economy is largely based on tourism. The city is home to the Circus World Museum, the International Crane Foundation, and the Aldo Leopold Foundation, all of which attract visitors from around the world. The city is also home to several manufacturing companies, including a paper mill and a plastics factory.
Demographics
As of the 2010 census, there were 12,048 people, 4,945 households, and 2,945 families residing in the city. The population density was 1,485.3 people per square mile (573.2/km2). There were 5,323 housing units at an average density of 654.3 per square mile (252.6/km2). The racial makeup of the city was 94.2% White, 0.7% African American, 0.7% Native American, 0.7% Asian, 0.1% Pacific Islander, 2.2% from other races, and 1.5% from two or more races. Hispanic or Latino of any race were 4.3% of the population.
There were 4,945 households, out of which 28.2% had children under the age of 18 living with them, 44.2% were married couples living together, 11.3% had a female householder with no husband present, and 39.7% were non-families. 32.2% of all households were made up of individuals, and 13.2% had someone living alone who was 65 years of age or older. The average household size was 2.33 and the average family size was 2.94.
In the city, the population was spread out, with 23.2% under the age of 18, 8.2% from 18 to 24, 28.2% from 25 to 44, 22.7% from 45 to 64, and 17.7% who were 65 years of age or older. The median age was 38 years. For every 100 females, there were 93.2 males. For every 100 females age 18 and over, there were 90.2 males.
The median income for a household in the city was $37,813, and the median income for a family was $45,945. Males had a median income of $31,945 versus $22,917 for females. The per capita income for the city was $19,945. About 6.2% of families and 8.7% of the population were below the poverty line, including 10.3% of those under age 18 and 8.2% of those age 65 or over.
Common Questions
What is Per Capita Income in Baraboo?
Per Capita income in Baraboo is $35,847.
What is the Median Family Income in Baraboo?
Median Family Income in Baraboo is $85,819.
What is the Median Household income in Baraboo?
Median Household Income in Baraboo is $66,592.
What is Income or Wage Gap in Baraboo?
Income or Wage Gap in Baraboo is 16.5%.
Women in Baraboo earn 83.5 cents for every dollar earned by a man.
What is Family Income Deficit in Baraboo?
Family Income Deficit in Baraboo is $10,030.
Families that are below poverty line in Baraboo earn $10,030 less on average than the poverty threshold level.
What is Inequality or Gini Index in Baraboo?
Inequality or Gini Index in Baraboo is 0.38.
What is the Total Population of Baraboo?
Total Population of Baraboo is 12,541.
What is the Total Male Population of Baraboo?
Total Male Population of Baraboo is 6,187.
What is the Total Female Population of Baraboo?
Total Female Population of Baraboo is 6,354.
What is the Ratio of Males per 100 Females in Baraboo?
There are 97.37 Males per 100 Females in Baraboo.
What is the Ratio of Females per 100 Males in Baraboo?
There are 102.70 Females per 100 Males in Baraboo.
What is the Median Population Age in Baraboo?
Median Population Age in Baraboo is 40.6 Years.
What is the Average Family Size in Baraboo
Average Family Size in Baraboo is 2.7 People.
What is the Average Household Size in Baraboo
Average Household Size in Baraboo is 2.1 People.
How Large is the Labor Force in Baraboo?
There are 6,974 People in the Labor Forcein in Baraboo.
What is the Percentage of People in the Labor Force in Baraboo?
66.2% of People are in the Labor Force in Baraboo.
What is the Unemployment Rate in Baraboo?
Unemployment Rate in Baraboo is 5.7%.