Fairchild, WI Map & Demographics
Fairchild Map
Fairchild Overview
$24,691
PER CAPITA INCOME
$50,536
AVG FAMILY INCOME
$45,000
AVG HOUSEHOLD INCOME
34.8%
WAGE / INCOME GAP [ % ]
65.2¢/ $1
WAGE / INCOME GAP [ $ ]
0.42
INEQUALITY / GINI INDEX
505
TOTAL POPULATION
222
MALE POPULATION
283
FEMALE POPULATION
78.45
MALES / 100 FEMALES
127.48
FEMALES / 100 MALES
42.9
MEDIAN AGE
2.6
AVG FAMILY SIZE
2.3
AVG HOUSEHOLD SIZE
246
LABOR FORCE [ PEOPLE ]
58.7%
PERCENT IN LABOR FORCE
10.6%
UNEMPLOYMENT RATE
Fairchild Zip Codes
Fairchild Area Codes
Income in Fairchild
Income Overview in Fairchild
Per Capita Income in Fairchild is $24,691, while median incomes of families and households are $50,536 and $45,000 respectively.
| Characteristic | Number | Measure |
| Per Capita Income | 505 | $24,691 |
| Median Family Income | 143 | $50,536 |
| Mean Family Income | 143 | $61,320 |
| Median Household Income | 220 | $45,000 |
| Mean Household Income | 220 | $55,332 |
| Income Deficit | 143 | $0 |
| Wage / Income Gap (%) | 505 | 34.76% |
| Wage / Income Gap ($) | 505 | 65.24¢ per $1 |
| Gini / Inequality Index | 505 | 0.42 |
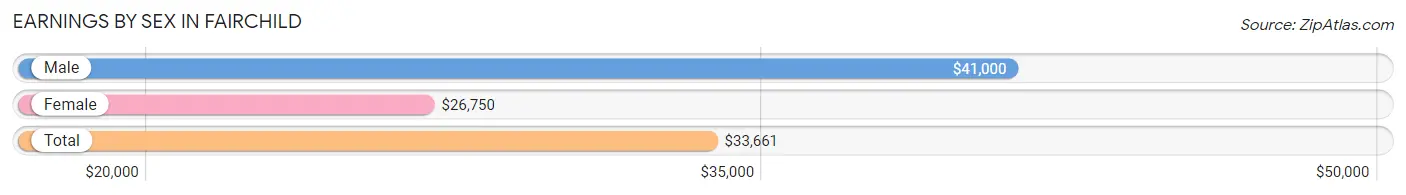
Earnings by Sex in Fairchild
Average Earnings in Fairchild are $33,661, $41,000 for men and $26,750 for women, a difference of 34.8%.
| Sex | Number | Average Earnings |
| Male | 104 (42.4%) | $41,000 |
| Female | 141 (57.6%) | $26,750 |
| Total | 245 (100.0%) | $33,661 |
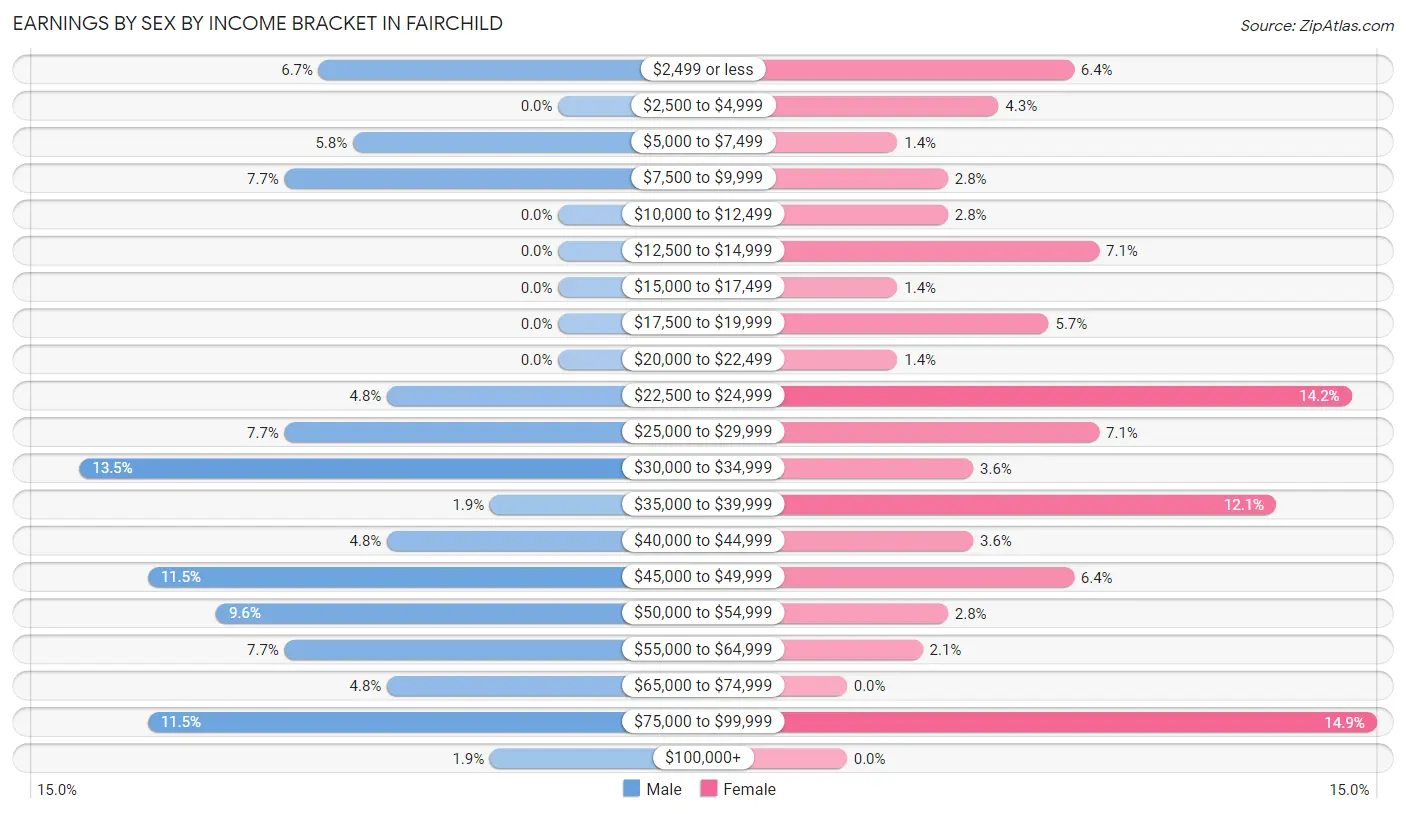
Earnings by Sex by Income Bracket in Fairchild
The most common earnings brackets in Fairchild are $30,000 to $34,999 for men (14 | 13.5%) and $75,000 to $99,999 for women (21 | 14.9%).
| Income | Male | Female |
| $2,499 or less | 7 (6.7%) | 9 (6.4%) |
| $2,500 to $4,999 | 0 (0.0%) | 6 (4.3%) |
| $5,000 to $7,499 | 6 (5.8%) | 2 (1.4%) |
| $7,500 to $9,999 | 8 (7.7%) | 4 (2.8%) |
| $10,000 to $12,499 | 0 (0.0%) | 4 (2.8%) |
| $12,500 to $14,999 | 0 (0.0%) | 10 (7.1%) |
| $15,000 to $17,499 | 0 (0.0%) | 2 (1.4%) |
| $17,500 to $19,999 | 0 (0.0%) | 8 (5.7%) |
| $20,000 to $22,499 | 0 (0.0%) | 2 (1.4%) |
| $22,500 to $24,999 | 5 (4.8%) | 20 (14.2%) |
| $25,000 to $29,999 | 8 (7.7%) | 10 (7.1%) |
| $30,000 to $34,999 | 14 (13.5%) | 5 (3.5%) |
| $35,000 to $39,999 | 2 (1.9%) | 17 (12.1%) |
| $40,000 to $44,999 | 5 (4.8%) | 5 (3.5%) |
| $45,000 to $49,999 | 12 (11.5%) | 9 (6.4%) |
| $50,000 to $54,999 | 10 (9.6%) | 4 (2.8%) |
| $55,000 to $64,999 | 8 (7.7%) | 3 (2.1%) |
| $65,000 to $74,999 | 5 (4.8%) | 0 (0.0%) |
| $75,000 to $99,999 | 12 (11.5%) | 21 (14.9%) |
| $100,000+ | 2 (1.9%) | 0 (0.0%) |
| Total | 104 (100.0%) | 141 (100.0%) |
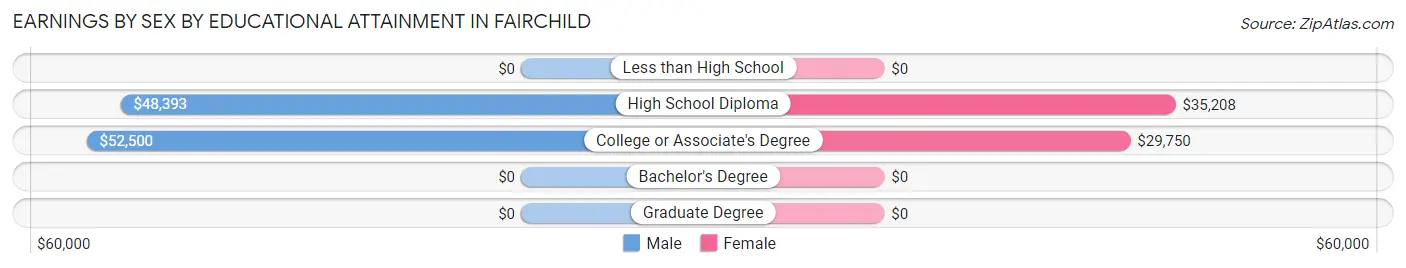
Earnings by Sex by Educational Attainment in Fairchild
Average earnings in Fairchild are $47,857 for men and $29,000 for women, a difference of 39.4%. Men with an educational attainment of college or associate's degree enjoy the highest average annual earnings of $52,500, while those with high school diploma education earn the least with $48,393. Women with an educational attainment of high school diploma earn the most with the average annual earnings of $35,208, while those with college or associate's degree education have the smallest earnings of $29,750.
| Educational Attainment | Male Income | Female Income |
| Less than High School | - | - |
| High School Diploma | $48,393 | $35,208 |
| College or Associate's Degree | $52,500 | $29,750 |
| Bachelor's Degree | - | - |
| Graduate Degree | - | - |
| Total | $47,857 | $29,000 |
Family Income in Fairchild
Family Income Brackets in Fairchild
According to the Fairchild family income data, there are 27 families falling into the $50,000 to $74,999 income range, which is the most common income bracket and makes up 18.9% of all families.
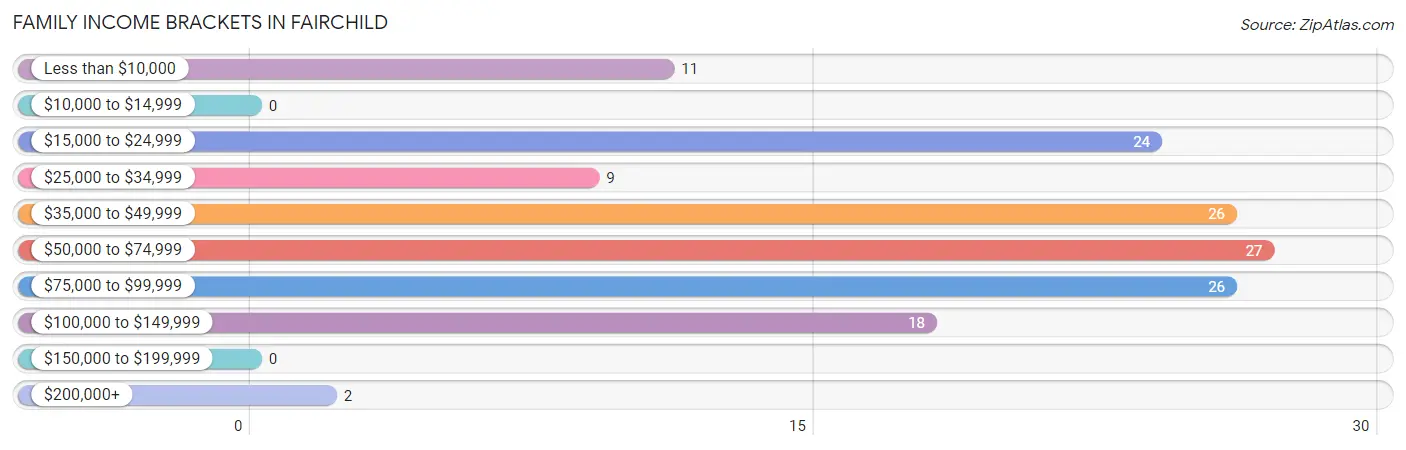
| Income Bracket | # Families | % Families |
| Less than $10,000 | 11 | 7.7% |
| $10,000 to $14,999 | 0 | 0.0% |
| $15,000 to $24,999 | 24 | 16.8% |
| $25,000 to $34,999 | 9 | 6.3% |
| $35,000 to $49,999 | 26 | 18.2% |
| $50,000 to $74,999 | 27 | 18.9% |
| $75,000 to $99,999 | 26 | 18.2% |
| $100,000 to $149,999 | 18 | 12.6% |
| $150,000 to $199,999 | 0 | 0.0% |
| $200,000+ | 2 | 1.4% |
Family Income by Famaliy Size in Fairchild
4-person families (10 | 7.0%) account for the highest median family income in Fairchild with $71,250 per family, while 2-person families (90 | 62.9%) have the highest median income of $22,046 per family member.
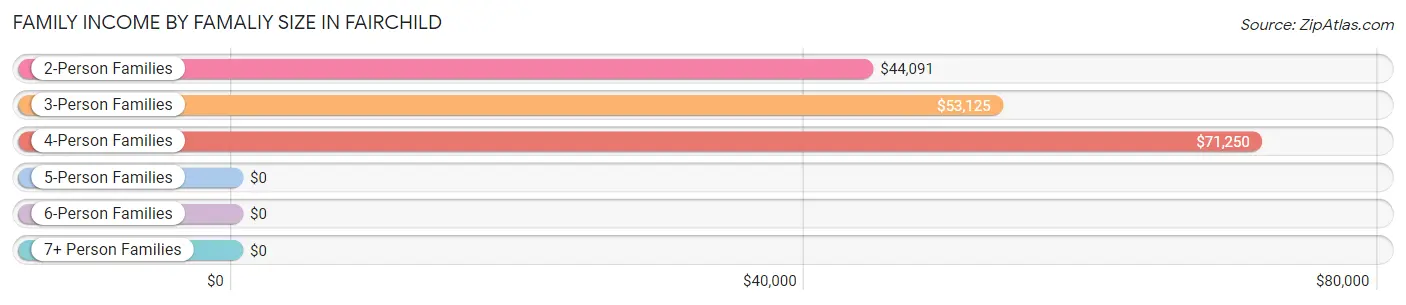
| Income Bracket | # Families | Median Income |
| 2-Person Families | 90 (62.9%) | $44,091 |
| 3-Person Families | 37 (25.9%) | $53,125 |
| 4-Person Families | 10 (7.0%) | $71,250 |
| 5-Person Families | 4 (2.8%) | $0 |
| 6-Person Families | 0 (0.0%) | $0 |
| 7+ Person Families | 2 (1.4%) | $0 |
| Total | 143 (100.0%) | $50,536 |
Family Income by Number of Earners in Fairchild
The median family income in Fairchild is $50,536, with families comprising 2 earners (59) having the highest median family income of $88,092, while families with no earners (37) have the lowest median family income of $26,875, accounting for 41.3% and 25.9% of families, respectively.
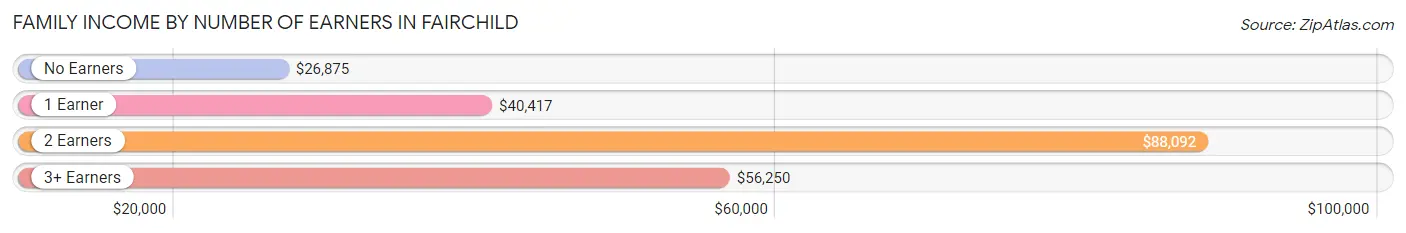
| Number of Earners | # Families | Median Income |
| No Earners | 37 (25.9%) | $26,875 |
| 1 Earner | 41 (28.7%) | $40,417 |
| 2 Earners | 59 (41.3%) | $88,092 |
| 3+ Earners | 6 (4.2%) | $56,250 |
| Total | 143 (100.0%) | $50,536 |
Household Income in Fairchild
Household Income Brackets in Fairchild
With 54 households falling in the category, the $50,000 to $74,999 income range is the most frequent in Fairchild, accounting for 24.5% of all households.
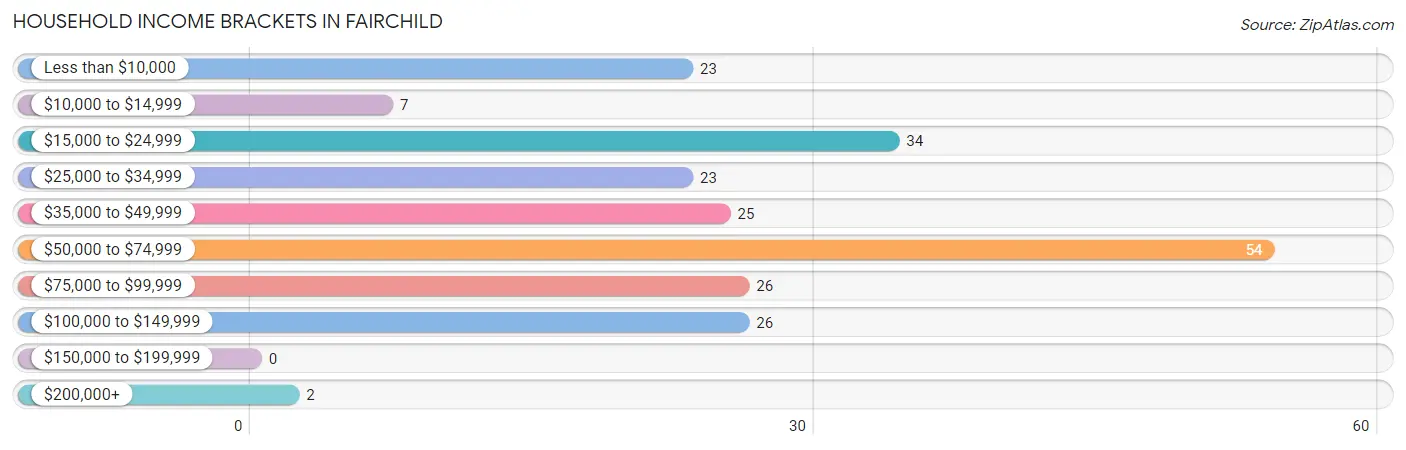
| Income Bracket | # Households | % Households |
| Less than $10,000 | 23 | 10.5% |
| $10,000 to $14,999 | 7 | 3.2% |
| $15,000 to $24,999 | 34 | 15.5% |
| $25,000 to $34,999 | 23 | 10.5% |
| $35,000 to $49,999 | 25 | 11.4% |
| $50,000 to $74,999 | 54 | 24.5% |
| $75,000 to $99,999 | 26 | 11.8% |
| $100,000 to $149,999 | 26 | 11.8% |
| $150,000 to $199,999 | 0 | 0.0% |
| $200,000+ | 2 | 0.9% |
Household Income by Householder Age in Fairchild
The median household income in Fairchild is $45,000, with the highest median household income of $68,750 found in the 25 to 44 years age bracket for the primary householder. A total of 74 households (33.6%) fall into this category. Meanwhile, the 15 to 24 years age bracket for the primary householder has the lowest median household income of $0, with 6 households (2.7%) in this group.
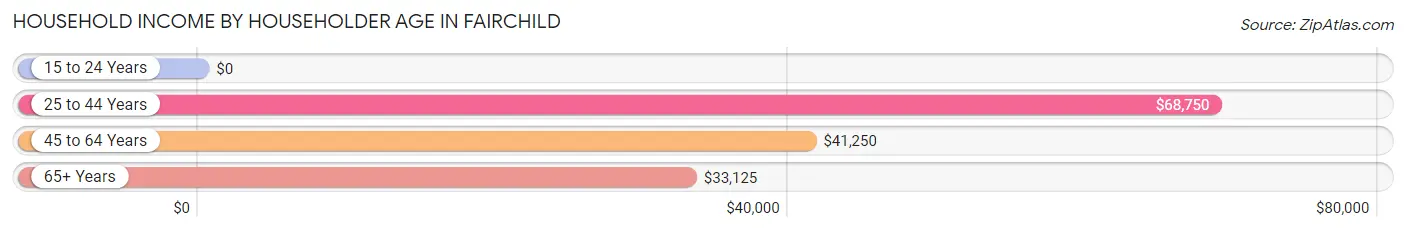
| Income Bracket | # Households | Median Income |
| 15 to 24 Years | 6 (2.7%) | $0 |
| 25 to 44 Years | 74 (33.6%) | $68,750 |
| 45 to 64 Years | 98 (44.6%) | $41,250 |
| 65+ Years | 42 (19.1%) | $33,125 |
| Total | 220 (100.0%) | $45,000 |
Poverty in Fairchild
Income Below Poverty by Sex and Age in Fairchild
With 16.6% poverty level for males and 29.0% for females among the residents of Fairchild, 6 to 11 year old males and 5 year old females are the most vulnerable to poverty, with 10 males (62.5%) and 3 females (100.0%) in their respective age groups living below the poverty level.
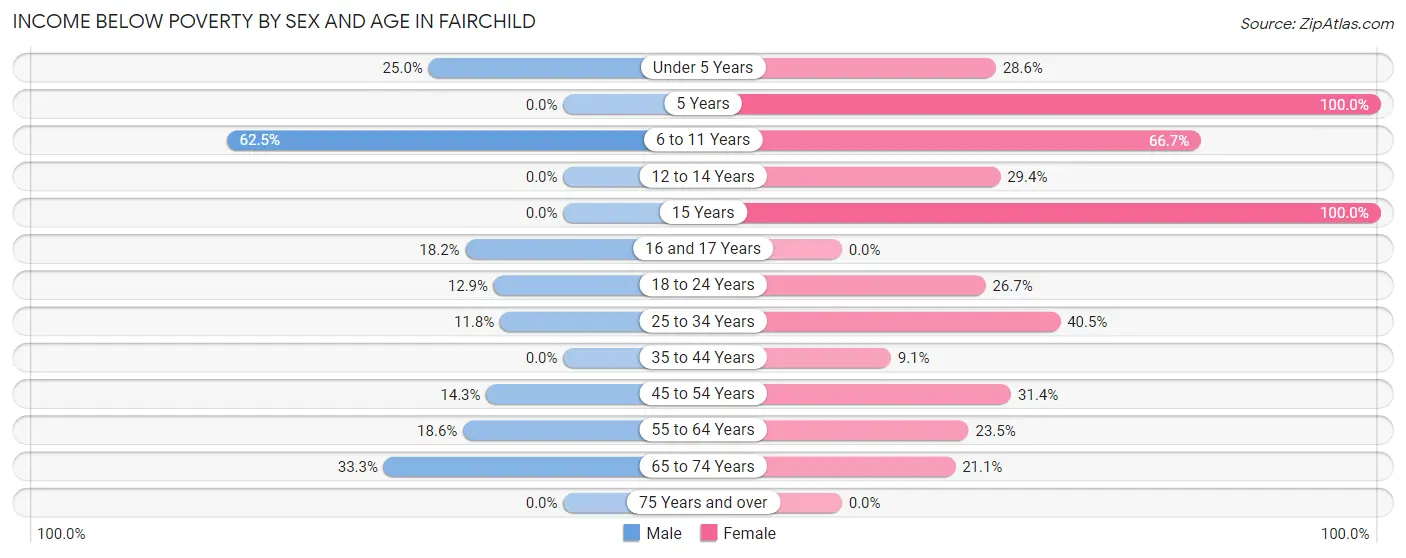
| Age Bracket | Male | Female |
| Under 5 Years | 1 (25.0%) | 2 (28.6%) |
| 5 Years | 0 (0.0%) | 3 (100.0%) |
| 6 to 11 Years | 10 (62.5%) | 12 (66.7%) |
| 12 to 14 Years | 0 (0.0%) | 5 (29.4%) |
| 15 Years | 0 (0.0%) | 3 (100.0%) |
| 16 and 17 Years | 2 (18.2%) | 0 (0.0%) |
| 18 to 24 Years | 4 (12.9%) | 4 (26.7%) |
| 25 to 34 Years | 2 (11.8%) | 15 (40.5%) |
| 35 to 44 Years | 0 (0.0%) | 4 (9.1%) |
| 45 to 54 Years | 6 (14.3%) | 22 (31.4%) |
| 55 to 64 Years | 8 (18.6%) | 8 (23.5%) |
| 65 to 74 Years | 3 (33.3%) | 4 (21.0%) |
| 75 Years and over | 0 (0.0%) | 0 (0.0%) |
| Total | 36 (16.6%) | 82 (29.0%) |
Income Above Poverty by Sex and Age in Fairchild
According to the poverty statistics in Fairchild, males aged 5 years and females aged 75 years and over are the age groups that are most secure financially, with 100.0% of males and 100.0% of females in these age groups living above the poverty line.
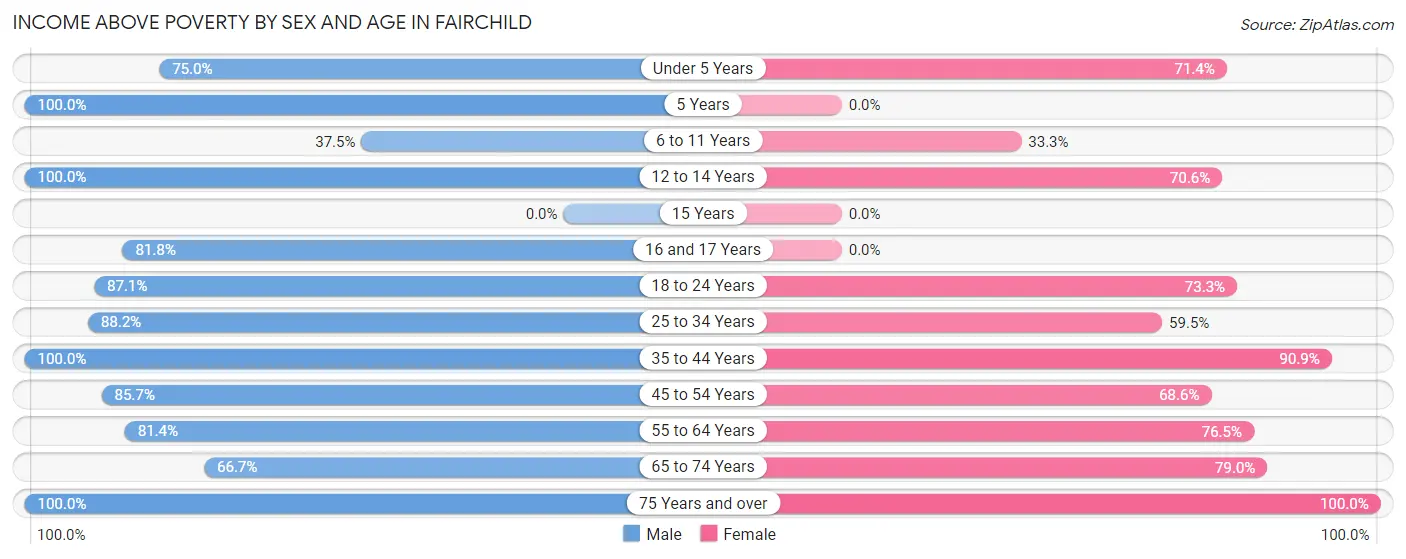
| Age Bracket | Male | Female |
| Under 5 Years | 3 (75.0%) | 5 (71.4%) |
| 5 Years | 8 (100.0%) | 0 (0.0%) |
| 6 to 11 Years | 6 (37.5%) | 6 (33.3%) |
| 12 to 14 Years | 5 (100.0%) | 12 (70.6%) |
| 15 Years | 0 (0.0%) | 0 (0.0%) |
| 16 and 17 Years | 9 (81.8%) | 0 (0.0%) |
| 18 to 24 Years | 27 (87.1%) | 11 (73.3%) |
| 25 to 34 Years | 15 (88.2%) | 22 (59.5%) |
| 35 to 44 Years | 21 (100.0%) | 40 (90.9%) |
| 45 to 54 Years | 36 (85.7%) | 48 (68.6%) |
| 55 to 64 Years | 35 (81.4%) | 26 (76.5%) |
| 65 to 74 Years | 6 (66.7%) | 15 (78.9%) |
| 75 Years and over | 10 (100.0%) | 16 (100.0%) |
| Total | 181 (83.4%) | 201 (71.0%) |
Income Below Poverty Among Married-Couple Families in Fairchild
The poverty statistics for married-couple families in Fairchild show that 7.8% or 5 of the total 64 families live below the poverty line. Families with no children have the highest poverty rate of 10.2%, comprising of 5 families. On the other hand, families with 1 or 2 children have the lowest poverty rate of 0.0%, which includes 0 families.
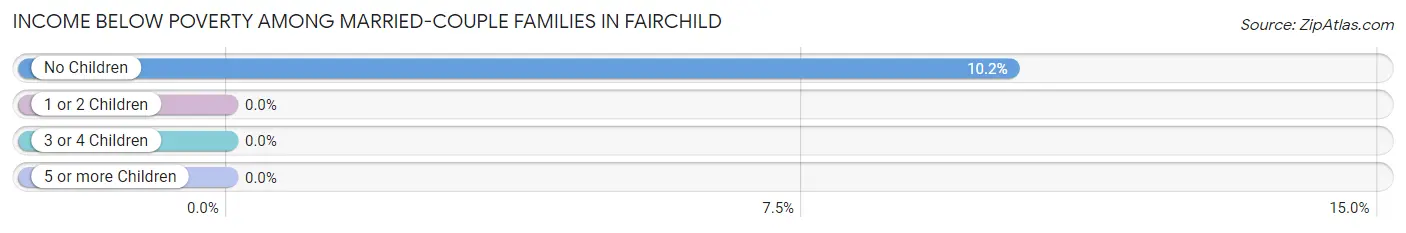
| Children | Above Poverty | Below Poverty |
| No Children | 44 (89.8%) | 5 (10.2%) |
| 1 or 2 Children | 11 (100.0%) | 0 (0.0%) |
| 3 or 4 Children | 4 (100.0%) | 0 (0.0%) |
| 5 or more Children | 0 (0.0%) | 0 (0.0%) |
| Total | 59 (92.2%) | 5 (7.8%) |
Income Below Poverty Among Single-Parent Households in Fairchild
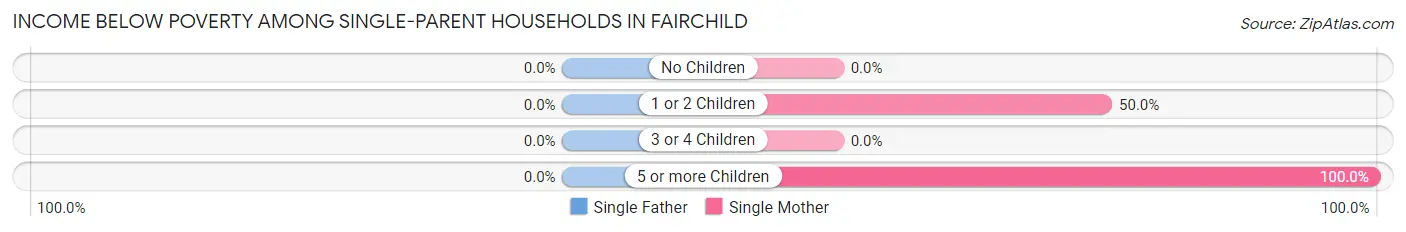
| Children | Single Father | Single Mother |
| No Children | 0 (0.0%) | 0 (0.0%) |
| 1 or 2 Children | 0 (0.0%) | 21 (50.0%) |
| 3 or 4 Children | 0 (0.0%) | 0 (0.0%) |
| 5 or more Children | 0 (0.0%) | 2 (100.0%) |
| Total | 0 (0.0%) | 23 (35.9%) |
Income Below Poverty Among Married-Couple vs Single-Parent Households in Fairchild
The poverty data for Fairchild shows that 5 of the married-couple family households (7.8%) and 23 of the single-parent households (29.1%) are living below the poverty level. Within the married-couple family households, those with no children have the highest poverty rate, with 5 households (10.2%) falling below the poverty line. Among the single-parent households, those with 5 or more children have the highest poverty rate, with 2 household (100.0%) living below poverty.
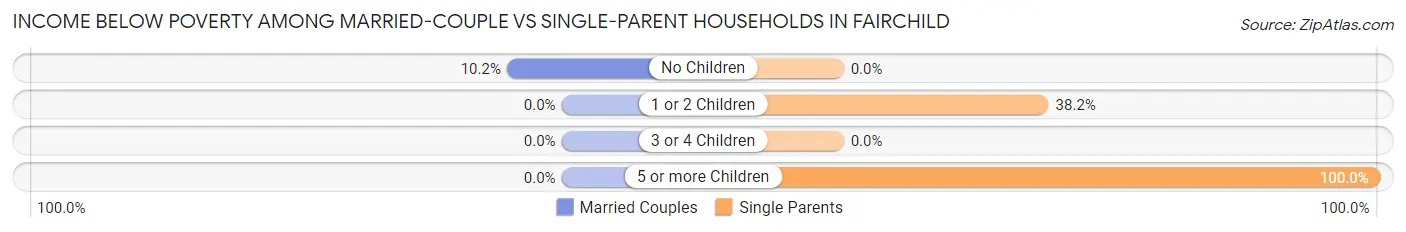
| Children | Married-Couple Families | Single-Parent Households |
| No Children | 5 (10.2%) | 0 (0.0%) |
| 1 or 2 Children | 0 (0.0%) | 21 (38.2%) |
| 3 or 4 Children | 0 (0.0%) | 0 (0.0%) |
| 5 or more Children | 0 (0.0%) | 2 (100.0%) |
| Total | 5 (7.8%) | 23 (29.1%) |
Race in Fairchild
The most populous races in Fairchild are White / Caucasian (463 | 91.7%), Two or more Races (23 | 4.5%), and Native / Alaskan (17 | 3.4%).
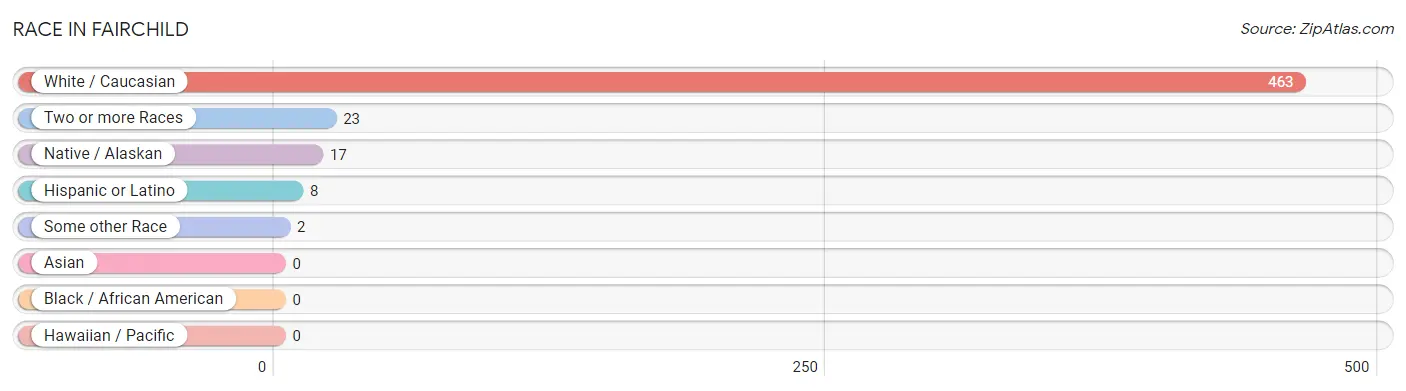
| Race | # Population | % Population |
| Asian | 0 | 0.0% |
| Black / African American | 0 | 0.0% |
| Hawaiian / Pacific | 0 | 0.0% |
| Hispanic or Latino | 8 | 1.6% |
| Native / Alaskan | 17 | 3.4% |
| White / Caucasian | 463 | 91.7% |
| Two or more Races | 23 | 4.5% |
| Some other Race | 2 | 0.4% |
| Total | 505 | 100.0% |
Ancestry in Fairchild
The most populous ancestries reported in Fairchild are German (194 | 38.4%), Irish (105 | 20.8%), Norwegian (89 | 17.6%), Polish (72 | 14.3%), and English (32 | 6.3%), together accounting for 97.4% of all Fairchild residents.
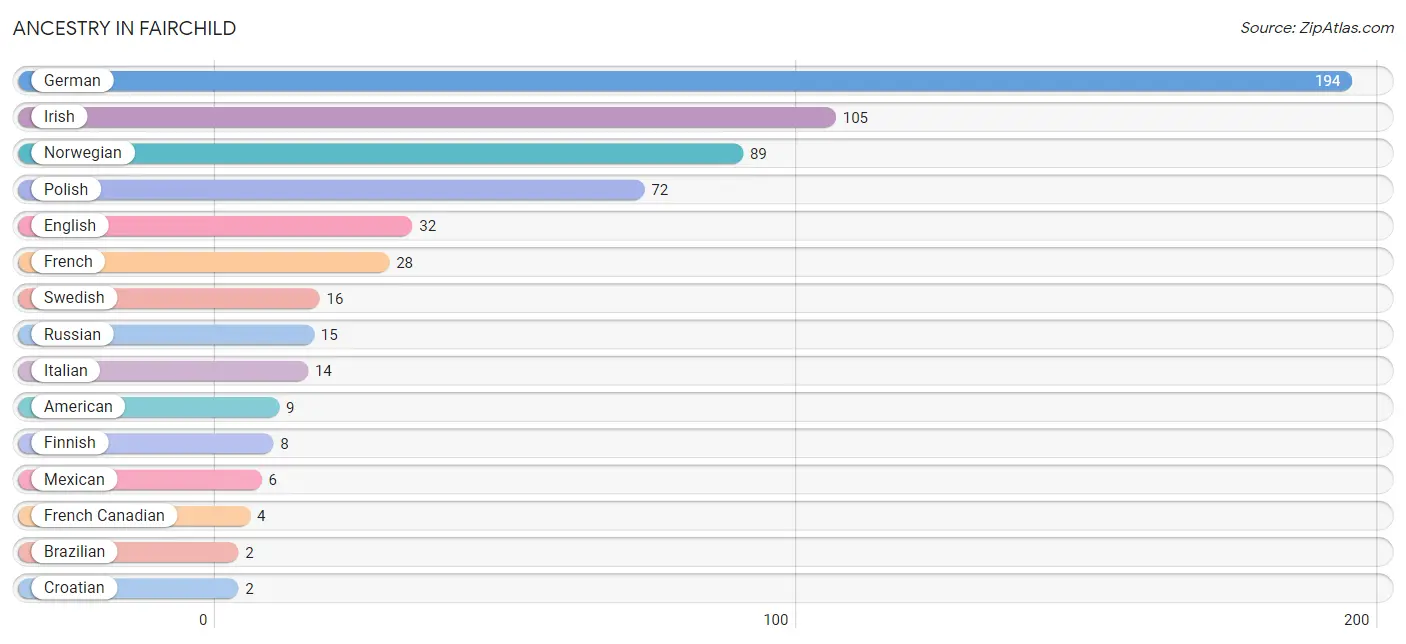
| Ancestry | # Population | % Population |
| American | 9 | 1.8% |
| Brazilian | 2 | 0.4% |
| Croatian | 2 | 0.4% |
| English | 32 | 6.3% |
| Finnish | 8 | 1.6% |
| French | 28 | 5.5% |
| French Canadian | 4 | 0.8% |
| German | 194 | 38.4% |
| Irish | 105 | 20.8% |
| Italian | 14 | 2.8% |
| Jamaican | 2 | 0.4% |
| Mexican | 6 | 1.2% |
| Norwegian | 89 | 17.6% |
| Polish | 72 | 14.3% |
| Russian | 15 | 3.0% |
| Scottish | 2 | 0.4% |
| Spanish | 1 | 0.2% |
| Swedish | 16 | 3.2% |
| Welsh | 1 | 0.2% | View All 19 Rows |
Immigrants in Fairchild
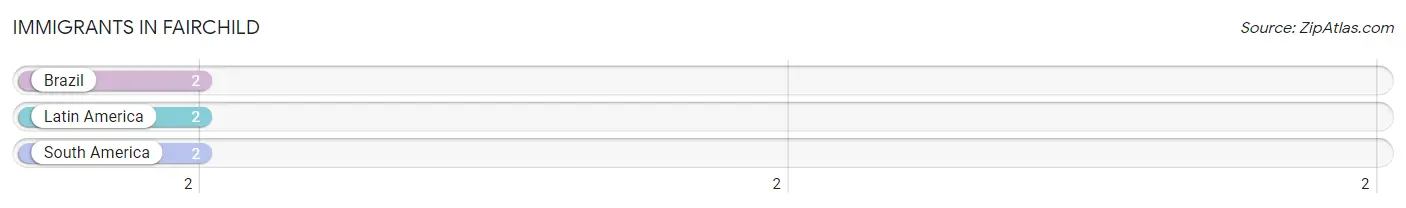
The most numerous immigrant groups reported in Fairchild came from Brazil (2 | 0.4%), Latin America (2 | 0.4%), and South America (2 | 0.4%), together accounting for 1.2% of all Fairchild residents.
| Immigration Origin | # Population | % Population |
| Brazil | 2 | 0.4% |
| Latin America | 2 | 0.4% |
| South America | 2 | 0.4% | View All 3 Rows |
Sex and Age in Fairchild
Sex and Age in Fairchild
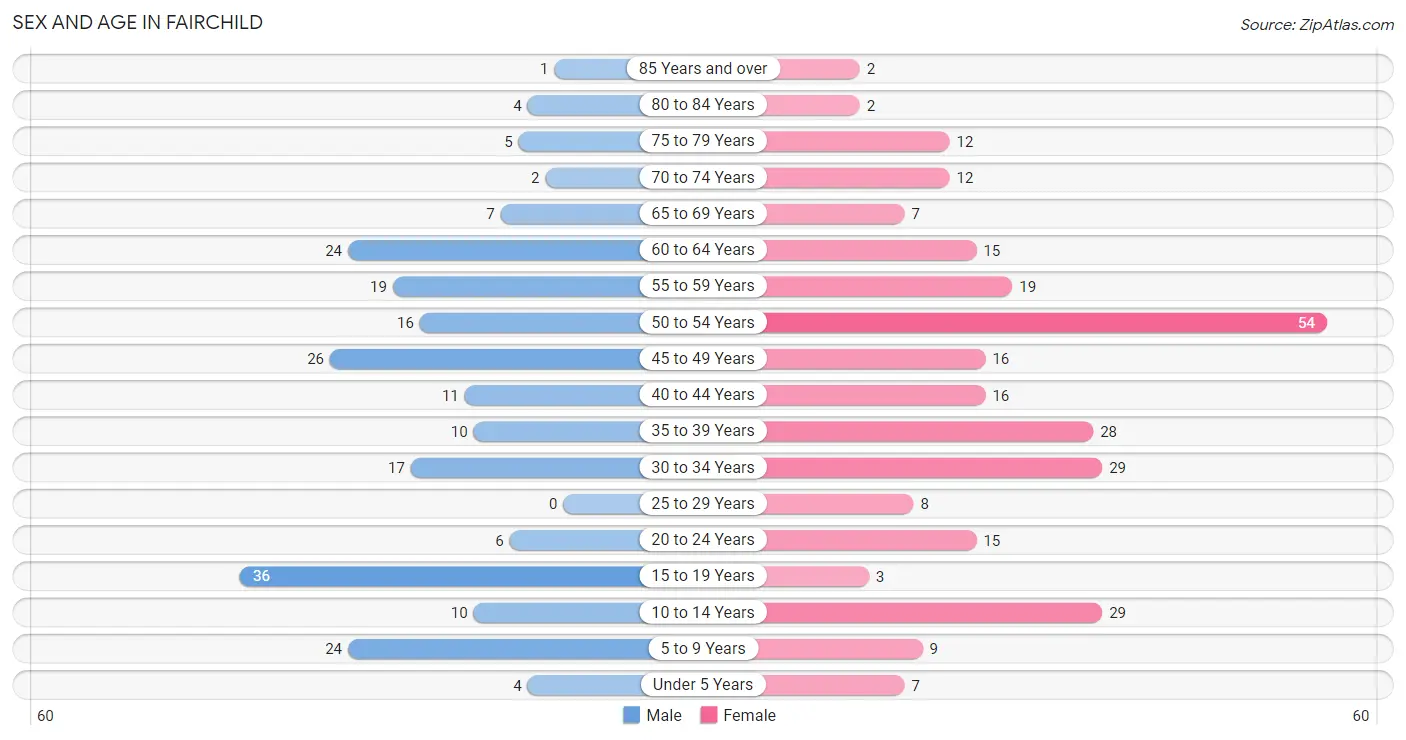
The most populous age groups in Fairchild are 15 to 19 Years (36 | 16.2%) for men and 50 to 54 Years (54 | 19.1%) for women.
| Age Bracket | Male | Female |
| Under 5 Years | 4 (1.8%) | 7 (2.5%) |
| 5 to 9 Years | 24 (10.8%) | 9 (3.2%) |
| 10 to 14 Years | 10 (4.5%) | 29 (10.2%) |
| 15 to 19 Years | 36 (16.2%) | 3 (1.1%) |
| 20 to 24 Years | 6 (2.7%) | 15 (5.3%) |
| 25 to 29 Years | 0 (0.0%) | 8 (2.8%) |
| 30 to 34 Years | 17 (7.7%) | 29 (10.2%) |
| 35 to 39 Years | 10 (4.5%) | 28 (9.9%) |
| 40 to 44 Years | 11 (5.0%) | 16 (5.7%) |
| 45 to 49 Years | 26 (11.7%) | 16 (5.7%) |
| 50 to 54 Years | 16 (7.2%) | 54 (19.1%) |
| 55 to 59 Years | 19 (8.6%) | 19 (6.7%) |
| 60 to 64 Years | 24 (10.8%) | 15 (5.3%) |
| 65 to 69 Years | 7 (3.2%) | 7 (2.5%) |
| 70 to 74 Years | 2 (0.9%) | 12 (4.2%) |
| 75 to 79 Years | 5 (2.2%) | 12 (4.2%) |
| 80 to 84 Years | 4 (1.8%) | 2 (0.7%) |
| 85 Years and over | 1 (0.4%) | 2 (0.7%) |
| Total | 222 (100.0%) | 283 (100.0%) |
Families and Households in Fairchild
Median Family Size in Fairchild
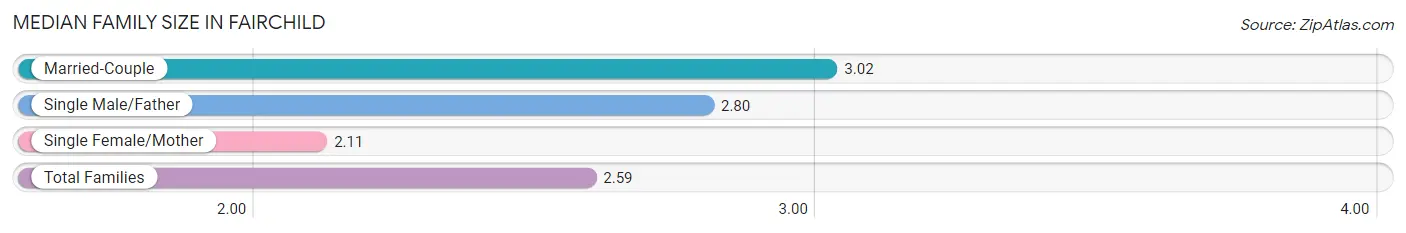
The median family size in Fairchild is 2.59 persons per family, with married-couple families (64 | 44.8%) accounting for the largest median family size of 3.02 persons per family. On the other hand, single female/mother families (64 | 44.8%) represent the smallest median family size with 2.11 persons per family.
| Family Type | # Families | Family Size |
| Married-Couple | 64 (44.8%) | 3.02 |
| Single Male/Father | 15 (10.5%) | 2.80 |
| Single Female/Mother | 64 (44.8%) | 2.11 |
| Total Families | 143 (100.0%) | 2.59 |
Median Household Size in Fairchild
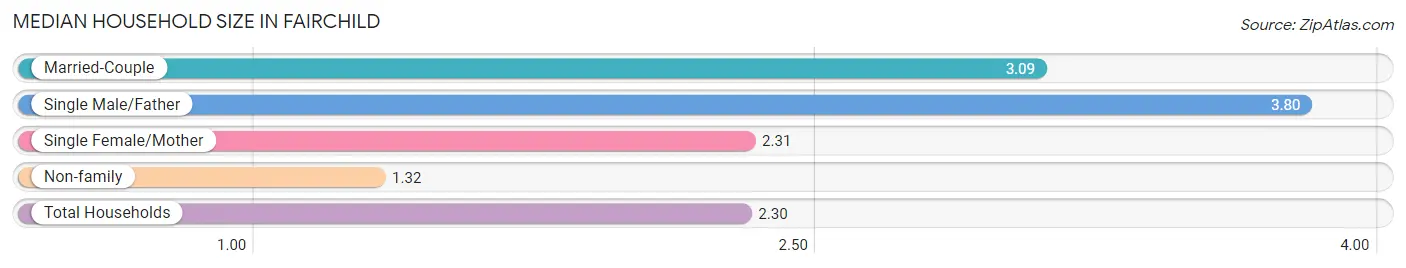
The median household size in Fairchild is 2.30 persons per household, with single male/father households (15 | 6.8%) accounting for the largest median household size of 3.8 persons per household. non-family households (77 | 35.0%) represent the smallest median household size with 1.32 persons per household.
| Household Type | # Households | Household Size |
| Married-Couple | 64 (29.1%) | 3.09 |
| Single Male/Father | 15 (6.8%) | 3.80 |
| Single Female/Mother | 64 (29.1%) | 2.31 |
| Non-family | 77 (35.0%) | 1.32 |
| Total Households | 220 (100.0%) | 2.30 |
Household Size by Marriage Status in Fairchild
Out of a total of 220 households in Fairchild, 143 (65.0%) are family households, while 77 (35.0%) are nonfamily households. The most numerous type of family households are 2-person households, comprising 77, and the most common type of nonfamily households are 1-person households, comprising 59.
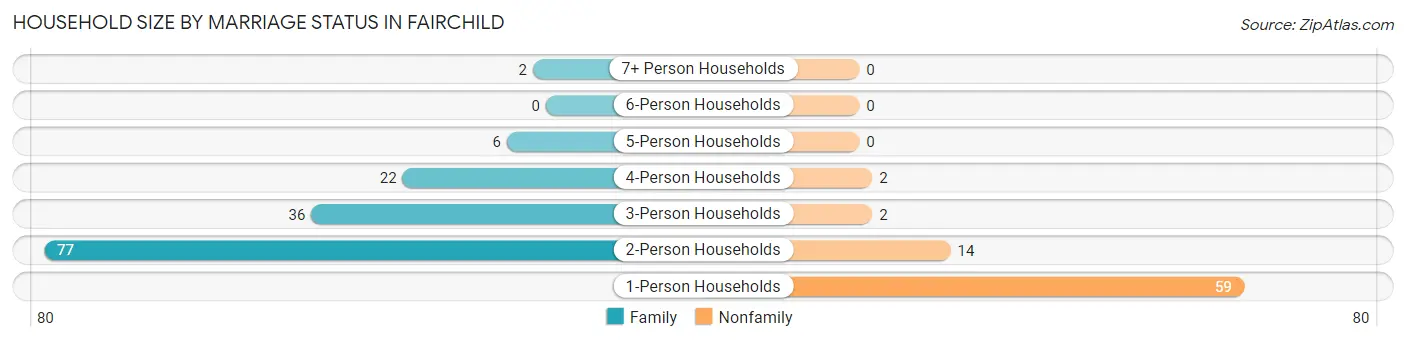
| Household Size | Family Households | Nonfamily Households |
| 1-Person Households | - | 59 (26.8%) |
| 2-Person Households | 77 (35.0%) | 14 (6.4%) |
| 3-Person Households | 36 (16.4%) | 2 (0.9%) |
| 4-Person Households | 22 (10.0%) | 2 (0.9%) |
| 5-Person Households | 6 (2.7%) | 0 (0.0%) |
| 6-Person Households | 0 (0.0%) | 0 (0.0%) |
| 7+ Person Households | 2 (0.9%) | 0 (0.0%) |
| Total | 143 (65.0%) | 77 (35.0%) |
Female Fertility in Fairchild
Fertility by Age in Fairchild
Average fertility rate in Fairchild is 43.0 births per 1,000 women. Women in the age bracket of 20 to 34 years have the highest fertility rate with 77.0 births per 1,000 women. Women in the age bracket of 20 to 34 years acount for 66.7% of all women with births.
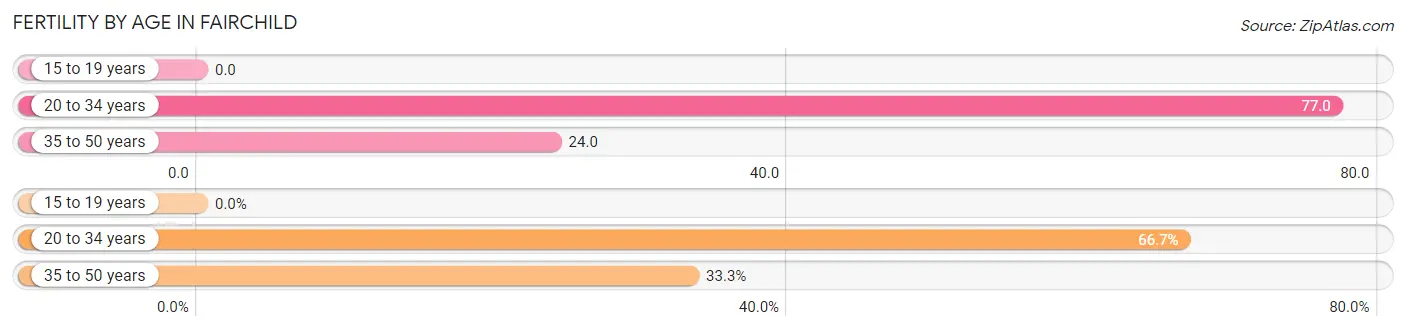
| Age Bracket | Women with Births | Births / 1,000 Women |
| 15 to 19 years | 0 (0.0%) | 0.0 |
| 20 to 34 years | 4 (66.7%) | 77.0 |
| 35 to 50 years | 2 (33.3%) | 24.0 |
| Total | 6 (100.0%) | 43.0 |
Fertility by Age by Marriage Status in Fairchild
33.3% of women with births (6) in Fairchild are married. The highest percentage of unmarried women with births falls into 35 to 50 years age bracket with 100.0% of them unmarried at the time of birth, while the lowest percentage of unmarried women with births belong to 20 to 34 years age bracket with 50.0% of them unmarried.
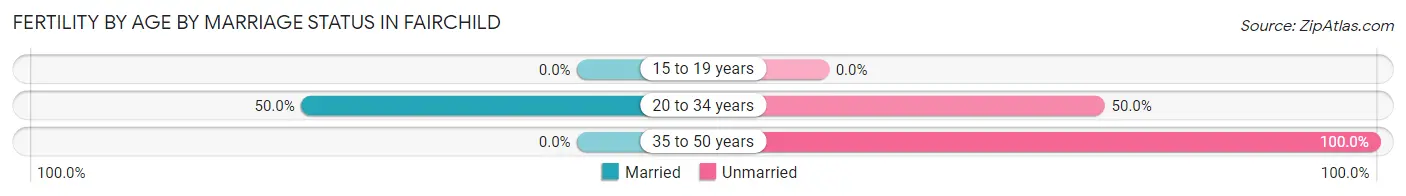
| Age Bracket | Married | Unmarried |
| 15 to 19 years | 0 (0.0%) | 0 (0.0%) |
| 20 to 34 years | 2 (50.0%) | 2 (50.0%) |
| 35 to 50 years | 0 (0.0%) | 2 (100.0%) |
| Total | 2 (33.3%) | 4 (66.7%) |
Fertility by Education in Fairchild
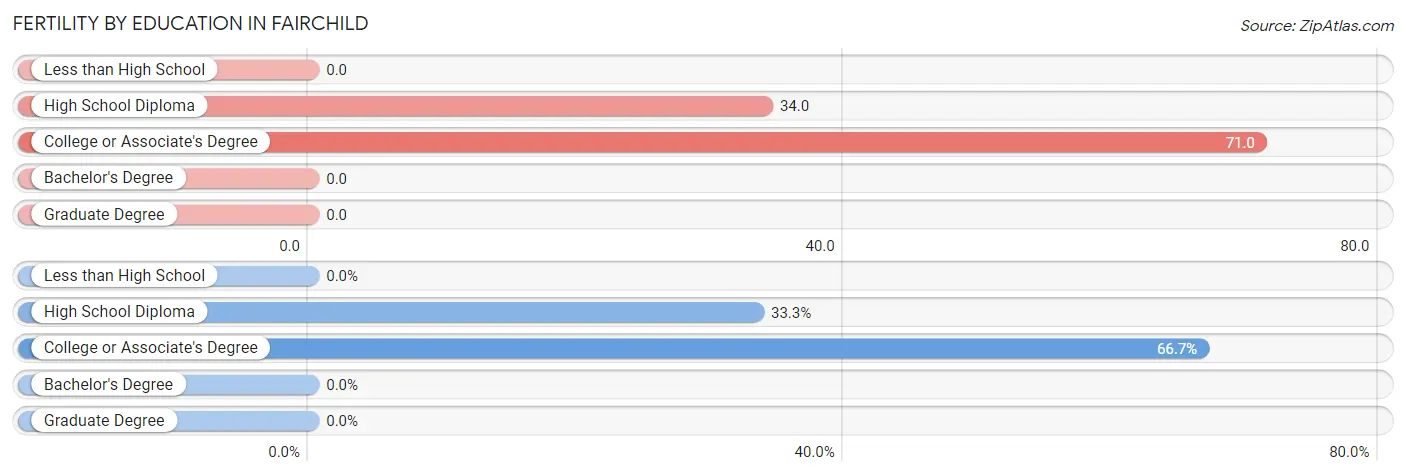
| Educational Attainment | Women with Births | Births / 1,000 Women |
| Less than High School | 0 (0.0%) | 0.0 |
| High School Diploma | 2 (33.3%) | 34.0 |
| College or Associate's Degree | 4 (66.7%) | 71.0 |
| Bachelor's Degree | 0 (0.0%) | 0.0 |
| Graduate Degree | 0 (0.0%) | 0.0 |
| Total | 6 (100.0%) | 43.0 |
Fertility by Education by Marriage Status in Fairchild
66.7% of women with births in Fairchild are unmarried. Women with the educational attainment of college or associate's degree are most likely to be married with 50.0% of them married at childbirth, while women with the educational attainment of high school diploma are least likely to be married with 100.0% of them unmarried at childbirth.
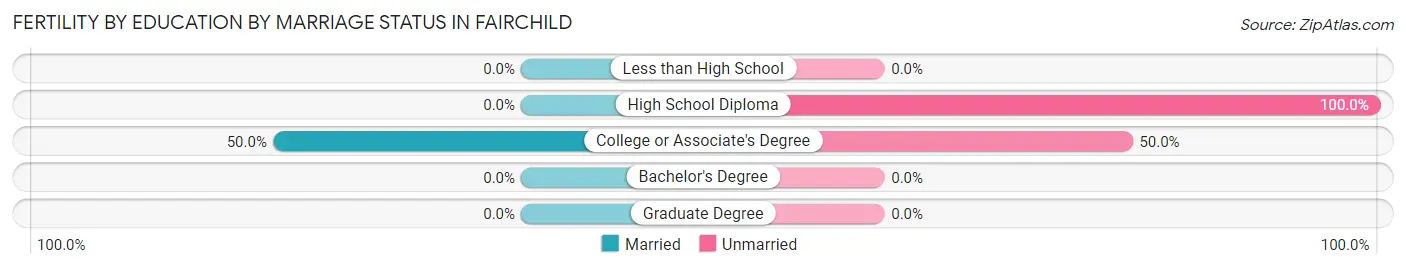
| Educational Attainment | Married | Unmarried |
| Less than High School | 0 (0.0%) | 0 (0.0%) |
| High School Diploma | 0 (0.0%) | 2 (100.0%) |
| College or Associate's Degree | 2 (50.0%) | 2 (50.0%) |
| Bachelor's Degree | 0 (0.0%) | 0 (0.0%) |
| Graduate Degree | 0 (0.0%) | 0 (0.0%) |
| Total | 2 (33.3%) | 4 (66.7%) |
Employment Characteristics in Fairchild
Employment by Class of Employer in Fairchild
Among the 201 employed individuals in Fairchild, private company employees (153 | 76.1%), not-for-profit organizations (19 | 9.5%), and self-employed (incorporated) (9 | 4.5%) make up the most common classes of employment.
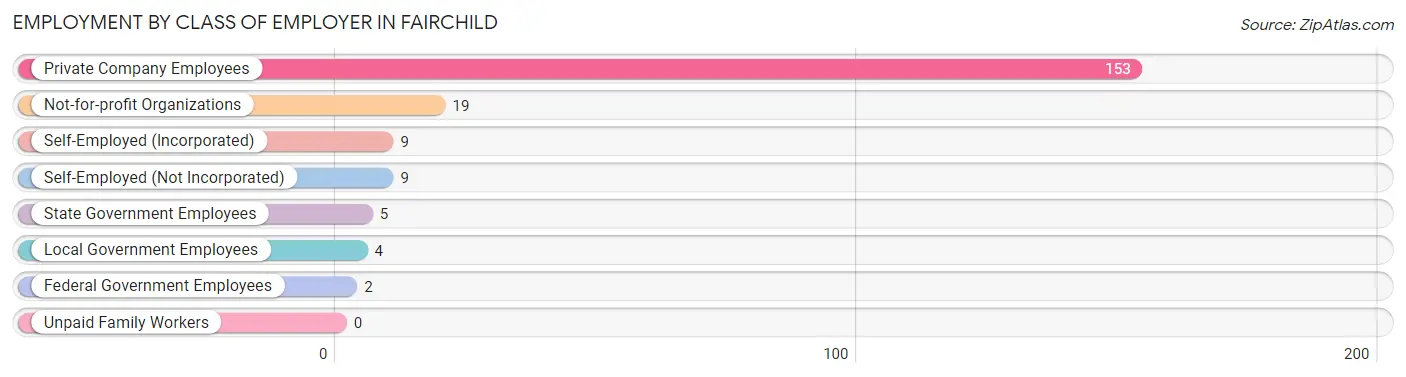
| Employer Class | # Employees | % Employees |
| Private Company Employees | 153 | 76.1% |
| Self-Employed (Incorporated) | 9 | 4.5% |
| Self-Employed (Not Incorporated) | 9 | 4.5% |
| Not-for-profit Organizations | 19 | 9.5% |
| Local Government Employees | 4 | 2.0% |
| State Government Employees | 5 | 2.5% |
| Federal Government Employees | 2 | 1.0% |
| Unpaid Family Workers | 0 | 0.0% |
| Total | 201 | 100.0% |
Employment Status by Age in Fairchild
According to the labor force statistics for Fairchild, out of the total population over 16 years of age (419), 58.7% or 246 individuals are in the labor force, with 10.6% or 26 of them unemployed. The age group with the highest labor force participation rate is 20 to 24 years, with 100.0% or 21 individuals in the labor force. Within the labor force, the 16 to 19 years age range has the highest percentage of unemployed individuals, with 66.7% or 8 of them being unemployed.
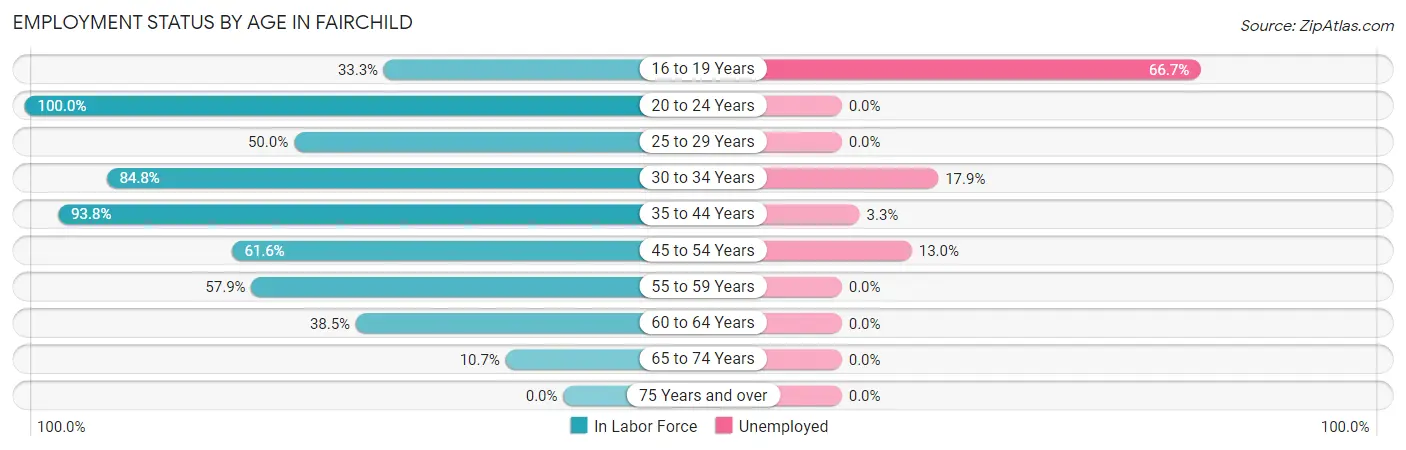
| Age Bracket | In Labor Force | Unemployed |
| 16 to 19 Years | 12 (33.3%) | 8 (66.7%) |
| 20 to 24 Years | 21 (100.0%) | 0 (0.0%) |
| 25 to 29 Years | 4 (50.0%) | 0 (0.0%) |
| 30 to 34 Years | 39 (84.8%) | 7 (17.9%) |
| 35 to 44 Years | 61 (93.8%) | 2 (3.3%) |
| 45 to 54 Years | 69 (61.6%) | 9 (13.0%) |
| 55 to 59 Years | 22 (57.9%) | 0 (0.0%) |
| 60 to 64 Years | 15 (38.5%) | 0 (0.0%) |
| 65 to 74 Years | 3 (10.7%) | 0 (0.0%) |
| 75 Years and over | 0 (0.0%) | 0 (0.0%) |
| Total | 246 (58.7%) | 26 (10.6%) |
Employment Status by Educational Attainment in Fairchild
According to labor force statistics for Fairchild, 68.2% of individuals (210) out of the total population between 25 and 64 years of age (308) are in the labor force, with 8.6% or 18 of them being unemployed. The group with the highest labor force participation rate are those with the educational attainment of college / associate degree, with 74.8% or 83 individuals in the labor force. Within the labor force, individuals with high school diploma education have the highest percentage of unemployment, with 16.8% or 18 of them being unemployed.
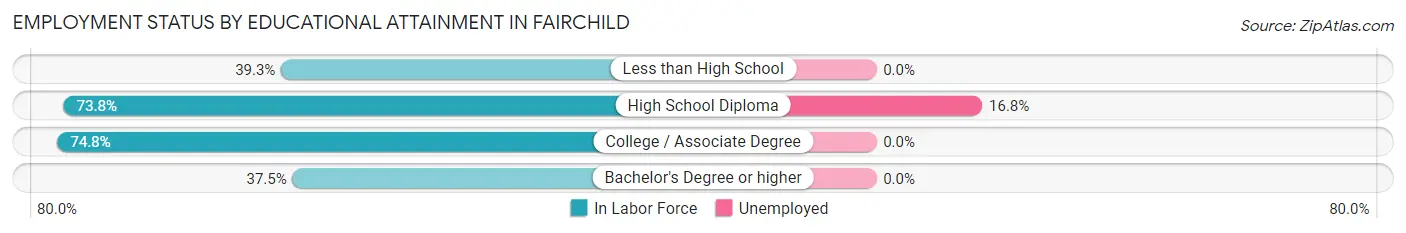
| Educational Attainment | In Labor Force | Unemployed |
| Less than High School | 11 (39.3%) | 0 (0.0%) |
| High School Diploma | 107 (73.8%) | 24 (16.8%) |
| College / Associate Degree | 83 (74.8%) | 0 (0.0%) |
| Bachelor's Degree or higher | 9 (37.5%) | 0 (0.0%) |
| Total | 210 (68.2%) | 26 (8.6%) |
Employment Occupations by Sex in Fairchild
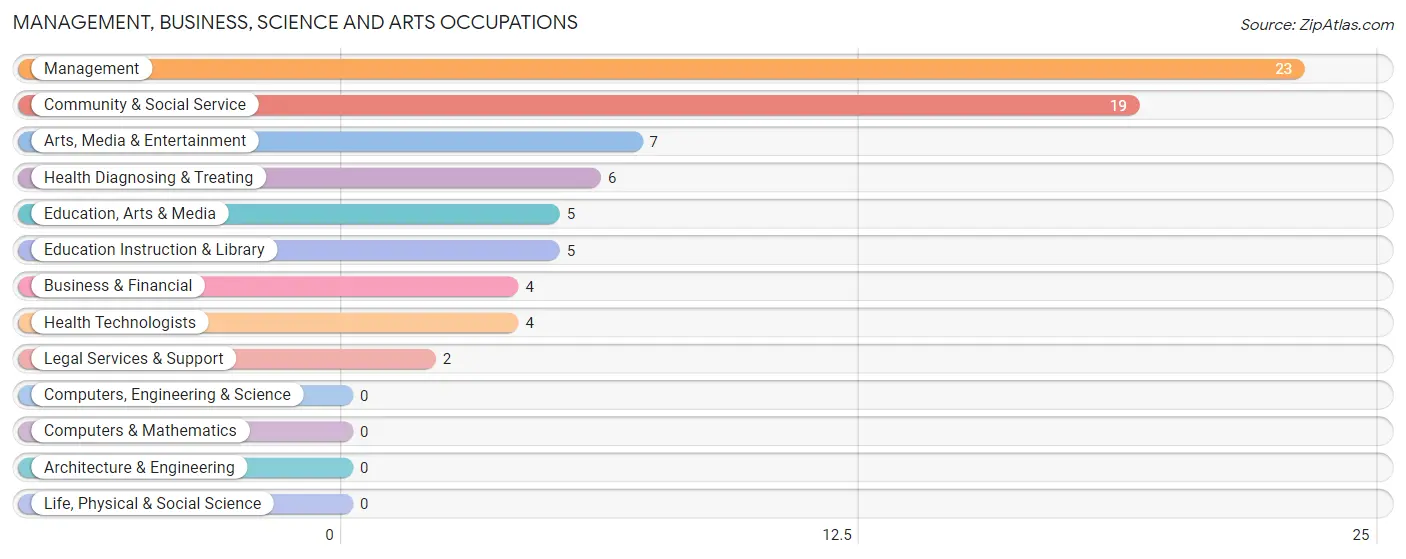
Management, Business, Science and Arts Occupations
The most common Management, Business, Science and Arts occupations in Fairchild are Management (23 | 10.4%), Community & Social Service (19 | 8.6%), Arts, Media & Entertainment (7 | 3.2%), Health Diagnosing & Treating (6 | 2.7%), and Education, Arts & Media (5 | 2.3%).
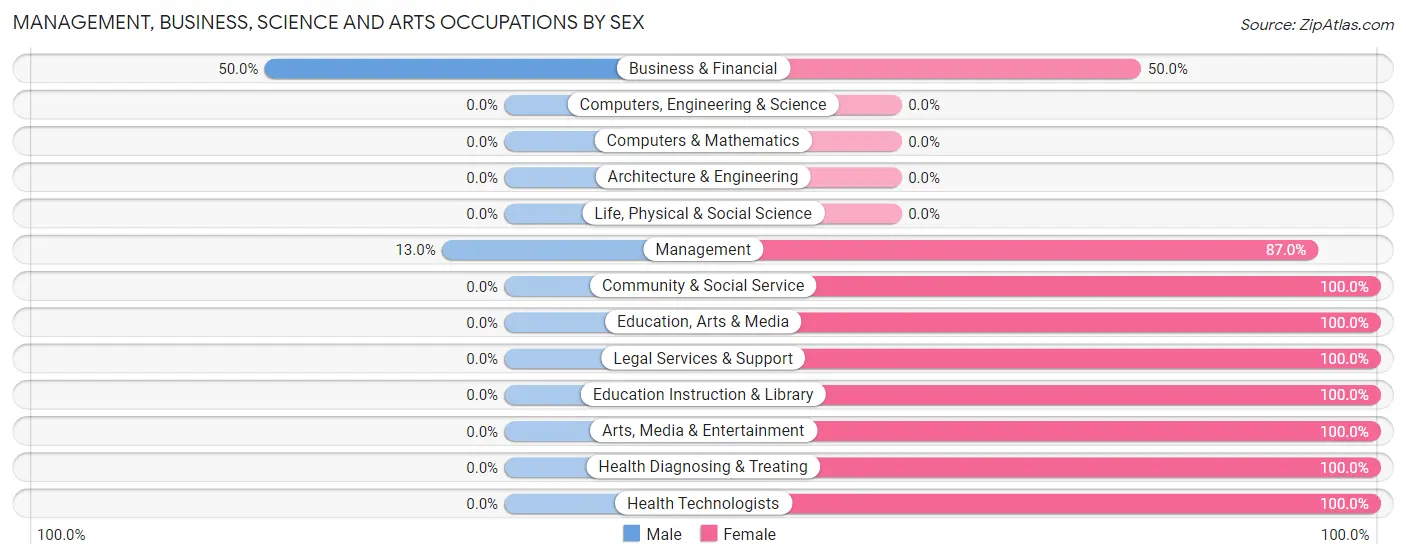
Management, Business, Science and Arts Occupations by Sex
Within the Management, Business, Science and Arts occupations in Fairchild, the most male-oriented occupations are Business & Financial (50.0%), and Management (13.0%), while the most female-oriented occupations are Community & Social Service (100.0%), Education, Arts & Media (100.0%), and Legal Services & Support (100.0%).
| Occupation | Male | Female |
| Management | 3 (13.0%) | 20 (87.0%) |
| Business & Financial | 2 (50.0%) | 2 (50.0%) |
| Computers, Engineering & Science | 0 (0.0%) | 0 (0.0%) |
| Computers & Mathematics | 0 (0.0%) | 0 (0.0%) |
| Architecture & Engineering | 0 (0.0%) | 0 (0.0%) |
| Life, Physical & Social Science | 0 (0.0%) | 0 (0.0%) |
| Community & Social Service | 0 (0.0%) | 19 (100.0%) |
| Education, Arts & Media | 0 (0.0%) | 5 (100.0%) |
| Legal Services & Support | 0 (0.0%) | 2 (100.0%) |
| Education Instruction & Library | 0 (0.0%) | 5 (100.0%) |
| Arts, Media & Entertainment | 0 (0.0%) | 7 (100.0%) |
| Health Diagnosing & Treating | 0 (0.0%) | 6 (100.0%) |
| Health Technologists | 0 (0.0%) | 4 (100.0%) |
| Total (Category) | 5 (9.6%) | 47 (90.4%) |
| Total (Overall) | 89 (40.5%) | 131 (59.6%) |
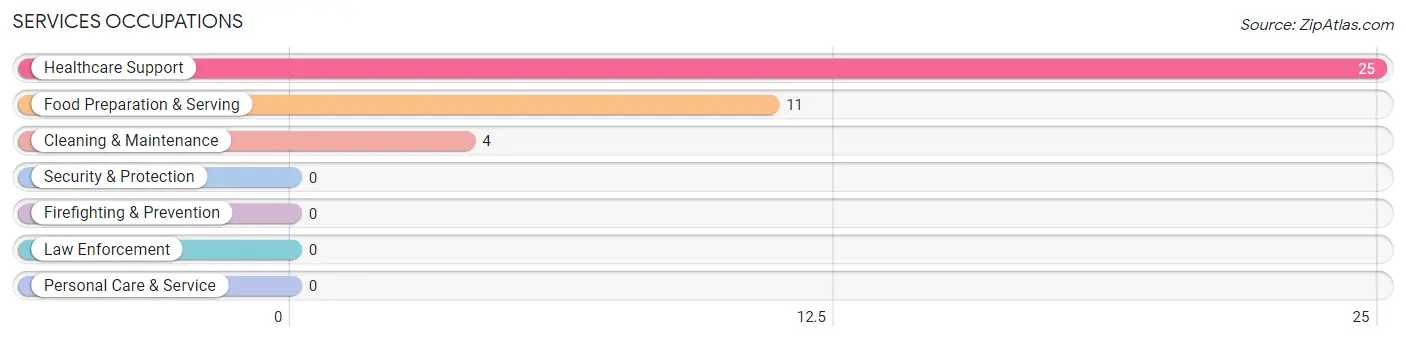
Services Occupations
The most common Services occupations in Fairchild are Healthcare Support (25 | 11.4%), Food Preparation & Serving (11 | 5.0%), and Cleaning & Maintenance (4 | 1.8%).
Services Occupations by Sex
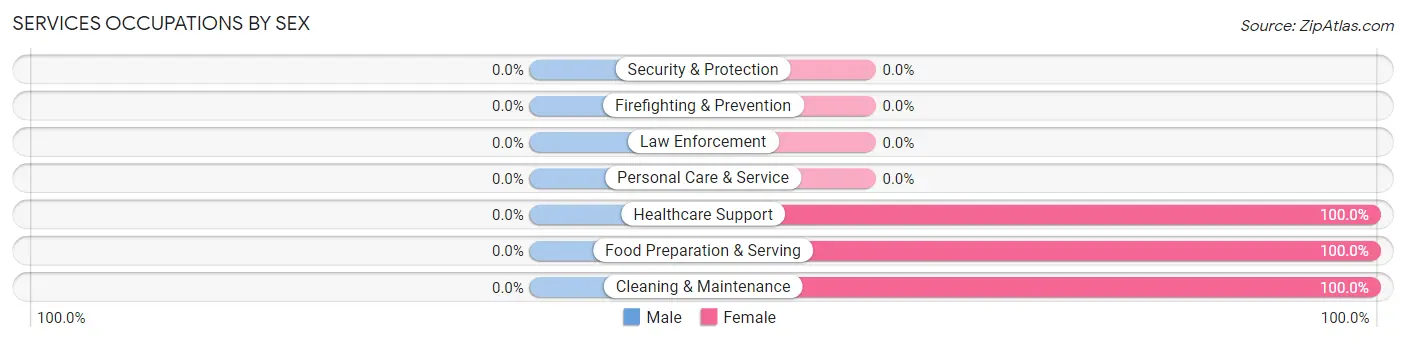
| Occupation | Male | Female |
| Healthcare Support | 0 (0.0%) | 25 (100.0%) |
| Security & Protection | 0 (0.0%) | 0 (0.0%) |
| Firefighting & Prevention | 0 (0.0%) | 0 (0.0%) |
| Law Enforcement | 0 (0.0%) | 0 (0.0%) |
| Food Preparation & Serving | 0 (0.0%) | 11 (100.0%) |
| Cleaning & Maintenance | 0 (0.0%) | 4 (100.0%) |
| Personal Care & Service | 0 (0.0%) | 0 (0.0%) |
| Total (Category) | 0 (0.0%) | 40 (100.0%) |
| Total (Overall) | 89 (40.5%) | 131 (59.6%) |
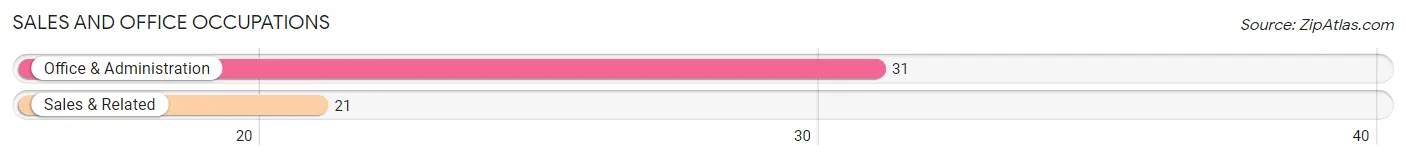
Sales and Office Occupations
The most common Sales and Office occupations in Fairchild are Office & Administration (31 | 14.1%), and Sales & Related (21 | 9.6%).
Sales and Office Occupations by Sex
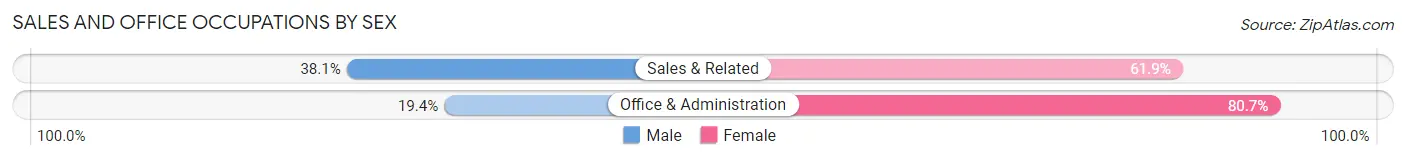
| Occupation | Male | Female |
| Sales & Related | 8 (38.1%) | 13 (61.9%) |
| Office & Administration | 6 (19.4%) | 25 (80.6%) |
| Total (Category) | 14 (26.9%) | 38 (73.1%) |
| Total (Overall) | 89 (40.5%) | 131 (59.6%) |
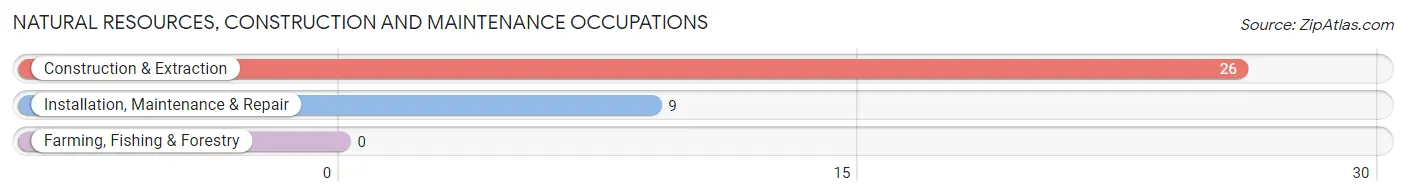
Natural Resources, Construction and Maintenance Occupations
The most common Natural Resources, Construction and Maintenance occupations in Fairchild are Construction & Extraction (26 | 11.8%), and Installation, Maintenance & Repair (9 | 4.1%).
Natural Resources, Construction and Maintenance Occupations by Sex
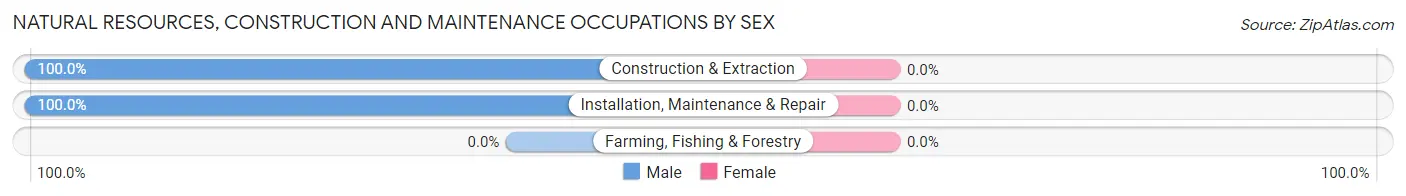
| Occupation | Male | Female |
| Farming, Fishing & Forestry | 0 (0.0%) | 0 (0.0%) |
| Construction & Extraction | 26 (100.0%) | 0 (0.0%) |
| Installation, Maintenance & Repair | 9 (100.0%) | 0 (0.0%) |
| Total (Category) | 35 (100.0%) | 0 (0.0%) |
| Total (Overall) | 89 (40.5%) | 131 (59.6%) |
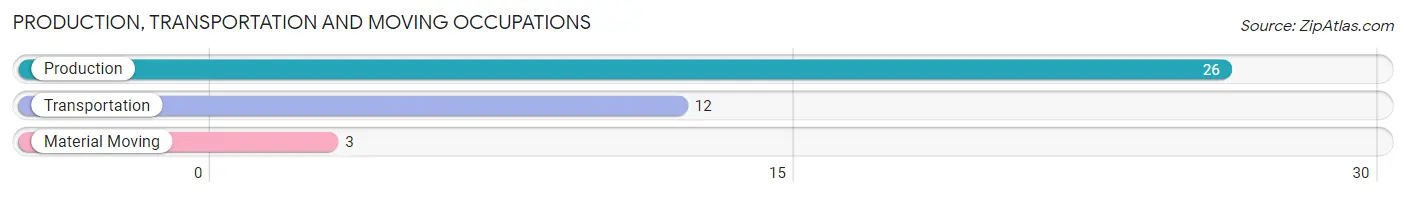
Production, Transportation and Moving Occupations
The most common Production, Transportation and Moving occupations in Fairchild are Production (26 | 11.8%), Transportation (12 | 5.4%), and Material Moving (3 | 1.4%).
Production, Transportation and Moving Occupations by Sex
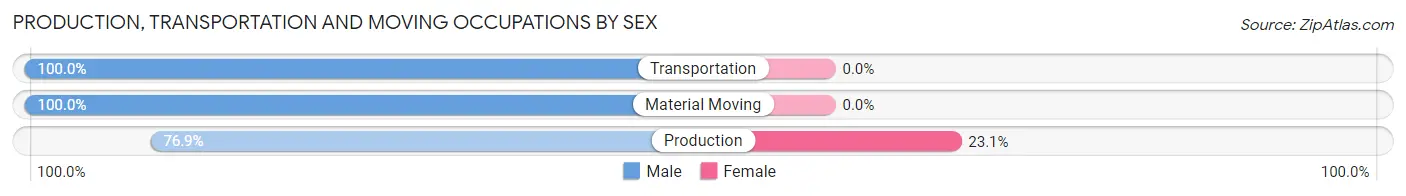
| Occupation | Male | Female |
| Production | 20 (76.9%) | 6 (23.1%) |
| Transportation | 12 (100.0%) | 0 (0.0%) |
| Material Moving | 3 (100.0%) | 0 (0.0%) |
| Total (Category) | 35 (85.4%) | 6 (14.6%) |
| Total (Overall) | 89 (40.5%) | 131 (59.6%) |
Employment Industries by Sex in Fairchild
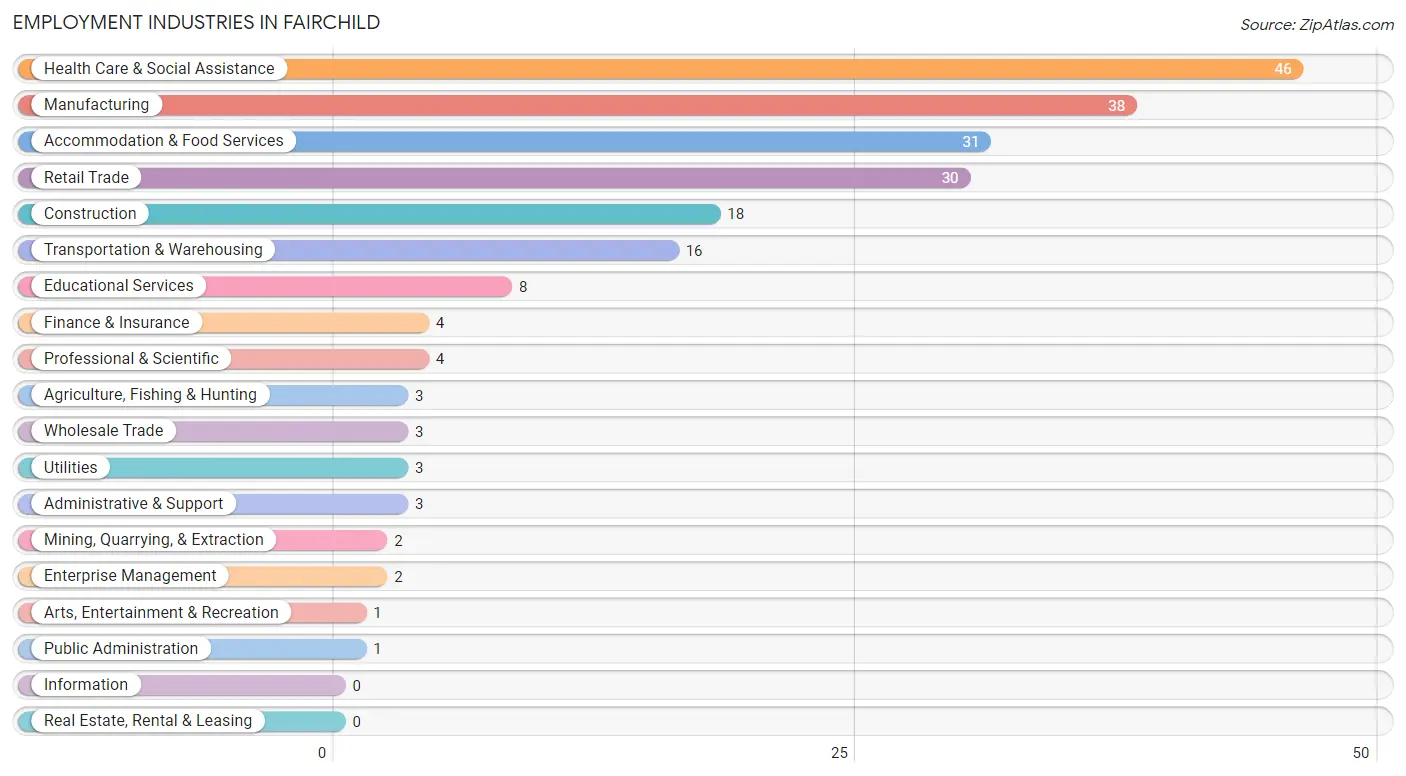
Employment Industries in Fairchild
The major employment industries in Fairchild include Health Care & Social Assistance (46 | 20.9%), Manufacturing (38 | 17.3%), Accommodation & Food Services (31 | 14.1%), Retail Trade (30 | 13.6%), and Construction (18 | 8.2%).
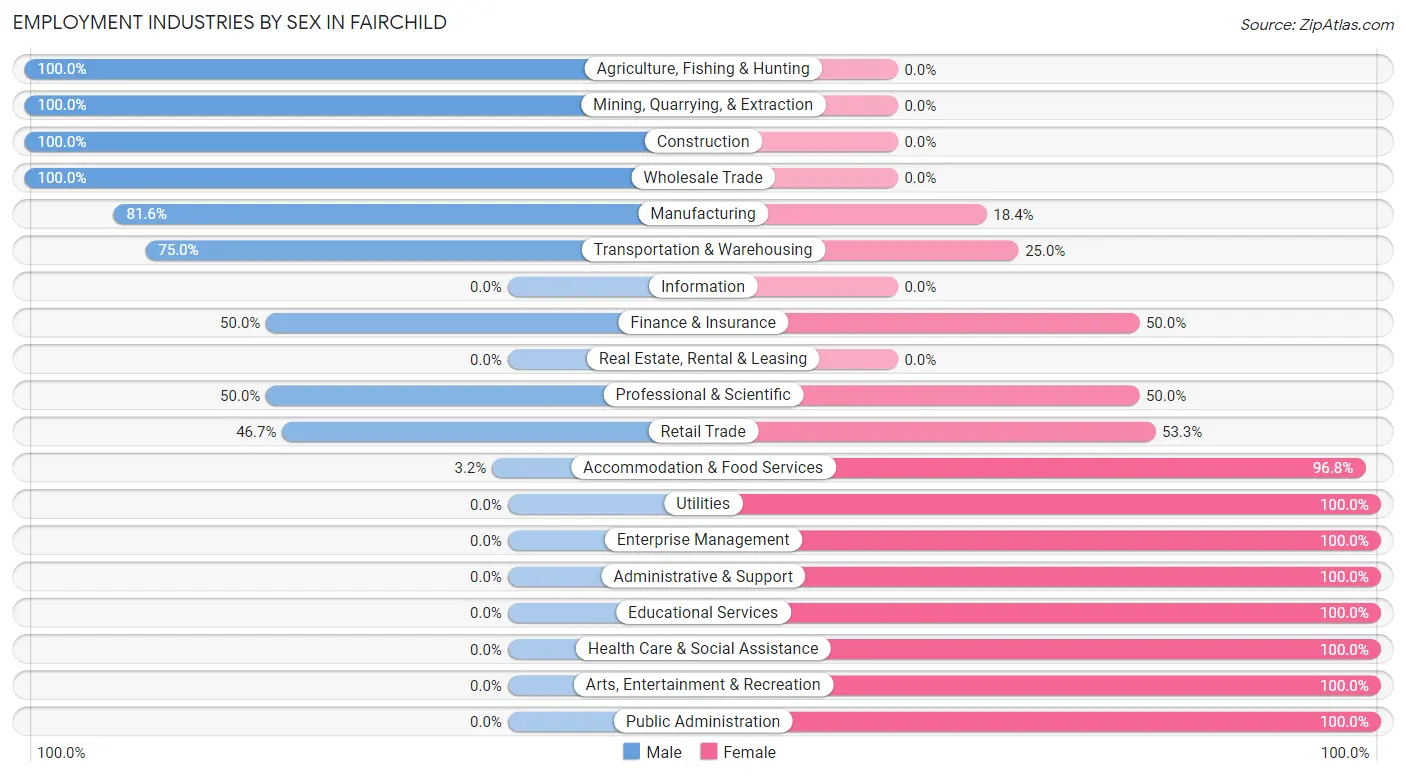
Employment Industries by Sex in Fairchild
The Fairchild industries that see more men than women are Agriculture, Fishing & Hunting (100.0%), Mining, Quarrying, & Extraction (100.0%), and Construction (100.0%), whereas the industries that tend to have a higher number of women are Utilities (100.0%), Enterprise Management (100.0%), and Administrative & Support (100.0%).
| Industry | Male | Female |
| Agriculture, Fishing & Hunting | 3 (100.0%) | 0 (0.0%) |
| Mining, Quarrying, & Extraction | 2 (100.0%) | 0 (0.0%) |
| Construction | 18 (100.0%) | 0 (0.0%) |
| Manufacturing | 31 (81.6%) | 7 (18.4%) |
| Wholesale Trade | 3 (100.0%) | 0 (0.0%) |
| Retail Trade | 14 (46.7%) | 16 (53.3%) |
| Transportation & Warehousing | 12 (75.0%) | 4 (25.0%) |
| Utilities | 0 (0.0%) | 3 (100.0%) |
| Information | 0 (0.0%) | 0 (0.0%) |
| Finance & Insurance | 2 (50.0%) | 2 (50.0%) |
| Real Estate, Rental & Leasing | 0 (0.0%) | 0 (0.0%) |
| Professional & Scientific | 2 (50.0%) | 2 (50.0%) |
| Enterprise Management | 0 (0.0%) | 2 (100.0%) |
| Administrative & Support | 0 (0.0%) | 3 (100.0%) |
| Educational Services | 0 (0.0%) | 8 (100.0%) |
| Health Care & Social Assistance | 0 (0.0%) | 46 (100.0%) |
| Arts, Entertainment & Recreation | 0 (0.0%) | 1 (100.0%) |
| Accommodation & Food Services | 1 (3.2%) | 30 (96.8%) |
| Public Administration | 0 (0.0%) | 1 (100.0%) |
| Total | 89 (40.5%) | 131 (59.6%) |
Education in Fairchild
School Enrollment in Fairchild
The most common levels of schooling among the 107 students in Fairchild are middle school (39 | 36.4%), elementary school (21 | 19.6%), and high school (21 | 19.6%).
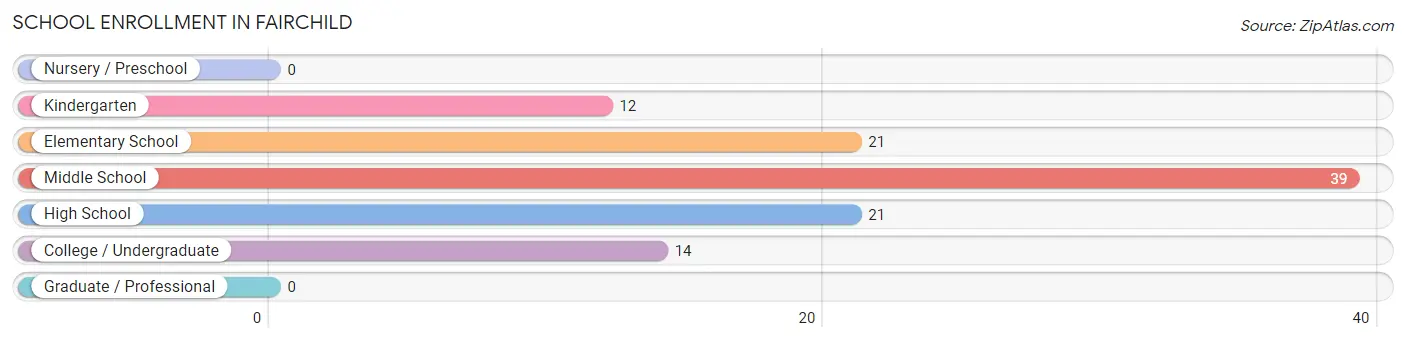
| School Level | # Students | % Students |
| Nursery / Preschool | 0 | 0.0% |
| Kindergarten | 12 | 11.2% |
| Elementary School | 21 | 19.6% |
| Middle School | 39 | 36.4% |
| High School | 21 | 19.6% |
| College / Undergraduate | 14 | 13.1% |
| Graduate / Professional | 0 | 0.0% |
| Total | 107 | 100.0% |
School Enrollment by Age by Funding Source in Fairchild
Out of a total of 107 students who are enrolled in schools in Fairchild, 1 (0.9%) attend a private institution, while the remaining 106 (99.1%) are enrolled in public schools. The age group of 5 to 9 year old has the highest likelihood of being enrolled in private schools, with 1 (3.0% in the age bracket) enrolled. Conversely, the age group of 10 to 14 year olds has the lowest likelihood of being enrolled in a private school, with 39 (100.0% in the age bracket) attending a public institution.
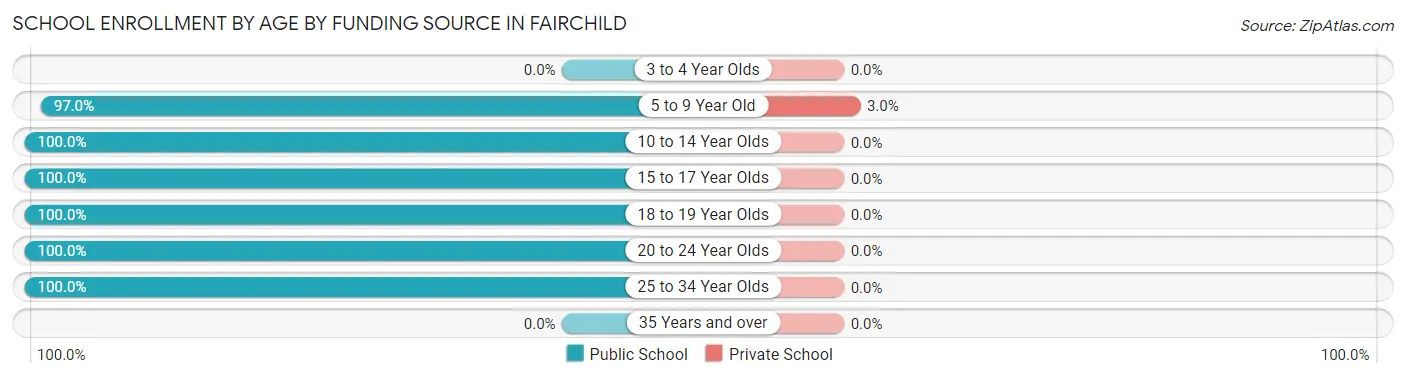
| Age Bracket | Public School | Private School |
| 3 to 4 Year Olds | 0 (0.0%) | 0 (0.0%) |
| 5 to 9 Year Old | 32 (97.0%) | 1 (3.0%) |
| 10 to 14 Year Olds | 39 (100.0%) | 0 (0.0%) |
| 15 to 17 Year Olds | 14 (100.0%) | 0 (0.0%) |
| 18 to 19 Year Olds | 7 (100.0%) | 0 (0.0%) |
| 20 to 24 Year Olds | 12 (100.0%) | 0 (0.0%) |
| 25 to 34 Year Olds | 2 (100.0%) | 0 (0.0%) |
| 35 Years and over | 0 (0.0%) | 0 (0.0%) |
| Total | 106 (99.1%) | 1 (0.9%) |
Educational Attainment by Field of Study in Fairchild
Education (22 | 73.3%), social sciences (2 | 6.7%), engineering (2 | 6.7%), business (2 | 6.7%), and psychology (1 | 3.3%) are the most common fields of study among 30 individuals in Fairchild who have obtained a bachelor's degree or higher.
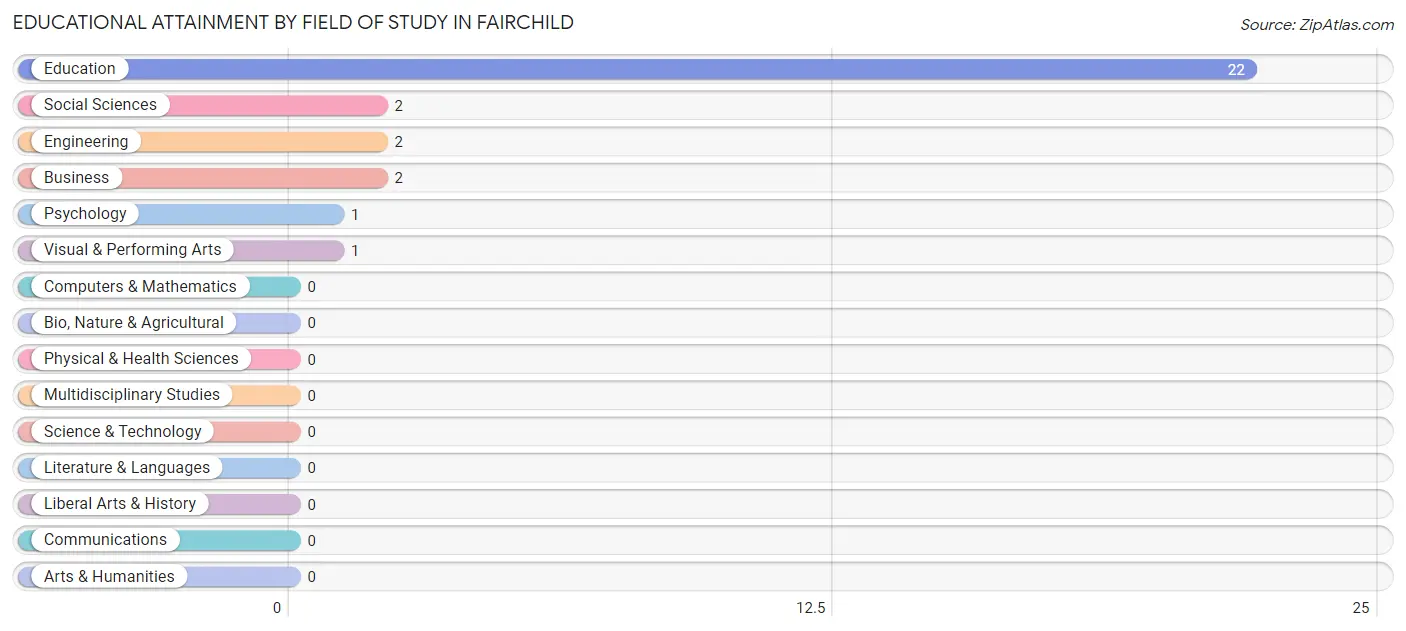
| Field of Study | # Graduates | % Graduates |
| Computers & Mathematics | 0 | 0.0% |
| Bio, Nature & Agricultural | 0 | 0.0% |
| Physical & Health Sciences | 0 | 0.0% |
| Psychology | 1 | 3.3% |
| Social Sciences | 2 | 6.7% |
| Engineering | 2 | 6.7% |
| Multidisciplinary Studies | 0 | 0.0% |
| Science & Technology | 0 | 0.0% |
| Business | 2 | 6.7% |
| Education | 22 | 73.3% |
| Literature & Languages | 0 | 0.0% |
| Liberal Arts & History | 0 | 0.0% |
| Visual & Performing Arts | 1 | 3.3% |
| Communications | 0 | 0.0% |
| Arts & Humanities | 0 | 0.0% |
| Total | 30 | 100.0% |
Transportation & Commute in Fairchild
Vehicle Availability by Sex in Fairchild
The most prevalent vehicle ownership categories in Fairchild are males with 3 vehicles (31, accounting for 34.8%) and females with 3 vehicles (31, making up 27.7%).
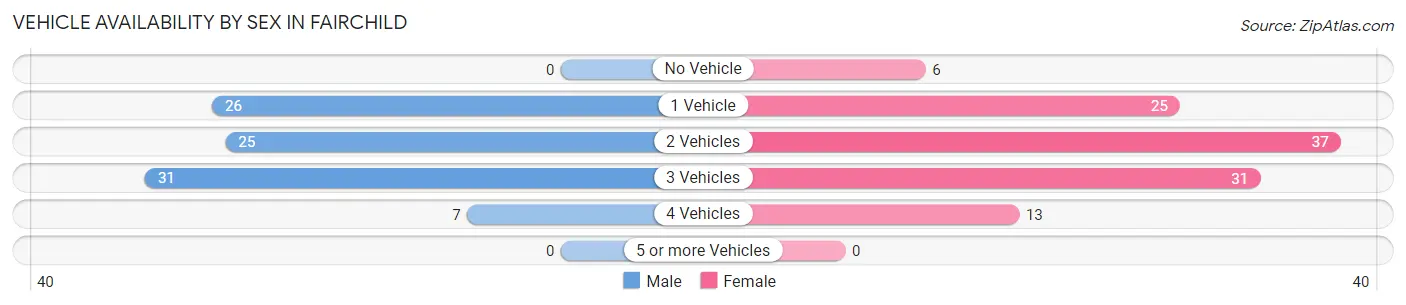
| Vehicles Available | Male | Female |
| No Vehicle | 0 (0.0%) | 6 (5.4%) |
| 1 Vehicle | 26 (29.2%) | 25 (22.3%) |
| 2 Vehicles | 25 (28.1%) | 37 (33.0%) |
| 3 Vehicles | 31 (34.8%) | 31 (27.7%) |
| 4 Vehicles | 7 (7.9%) | 13 (11.6%) |
| 5 or more Vehicles | 0 (0.0%) | 0 (0.0%) |
| Total | 89 (100.0%) | 112 (100.0%) |
Commute Time in Fairchild
The most frequently occuring commute durations in Fairchild are 15 to 19 minutes (38 commuters, 21.0%), 20 to 24 minutes (25 commuters, 13.8%), and 45 to 59 minutes (25 commuters, 13.8%).
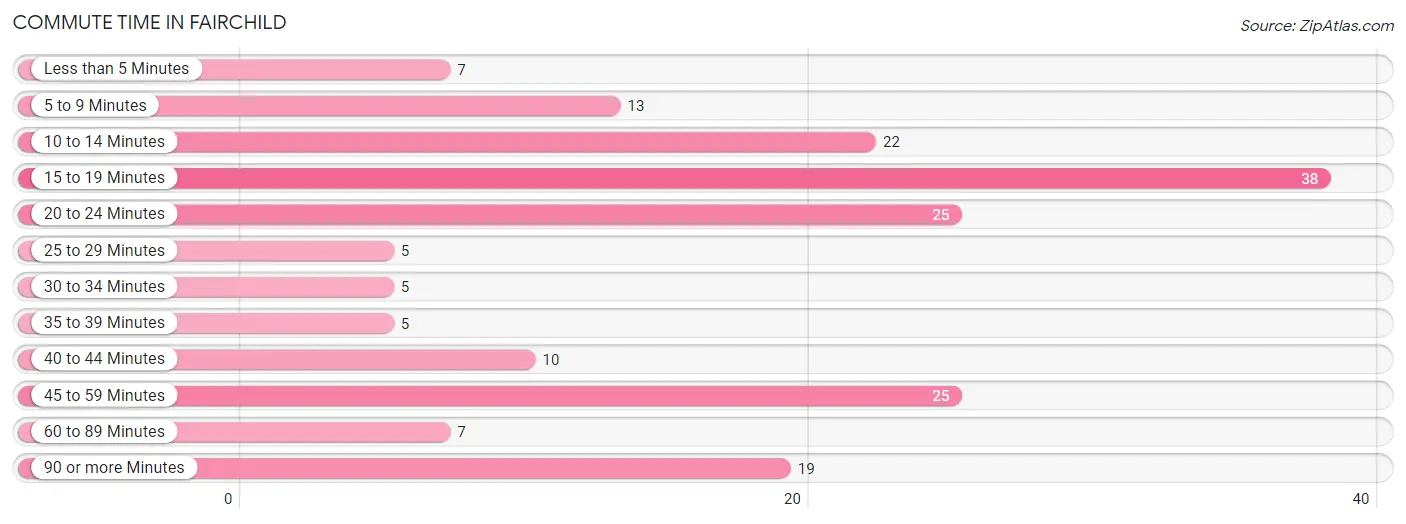
| Commute Time | # Commuters | % Commuters |
| Less than 5 Minutes | 7 | 3.9% |
| 5 to 9 Minutes | 13 | 7.2% |
| 10 to 14 Minutes | 22 | 12.1% |
| 15 to 19 Minutes | 38 | 21.0% |
| 20 to 24 Minutes | 25 | 13.8% |
| 25 to 29 Minutes | 5 | 2.8% |
| 30 to 34 Minutes | 5 | 2.8% |
| 35 to 39 Minutes | 5 | 2.8% |
| 40 to 44 Minutes | 10 | 5.5% |
| 45 to 59 Minutes | 25 | 13.8% |
| 60 to 89 Minutes | 7 | 3.9% |
| 90 or more Minutes | 19 | 10.5% |
Commute Time by Sex in Fairchild
The most common commute times in Fairchild are 45 to 59 minutes (13 commuters, 16.3%) for males and 15 to 19 minutes (29 commuters, 28.7%) for females.
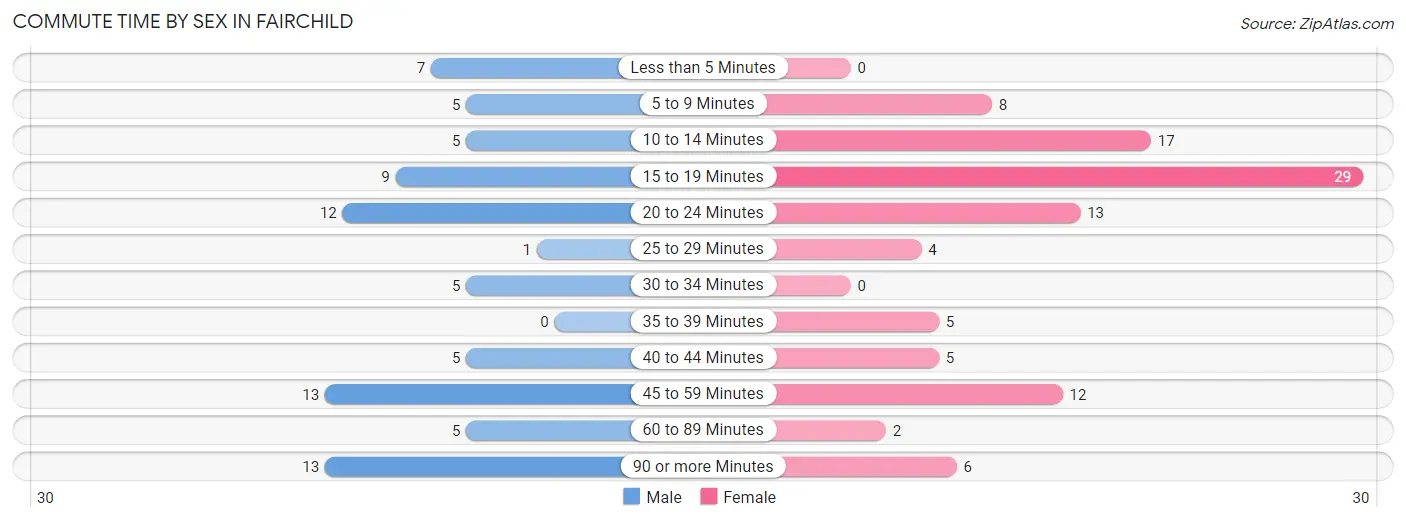
| Commute Time | Male | Female |
| Less than 5 Minutes | 7 (8.7%) | 0 (0.0%) |
| 5 to 9 Minutes | 5 (6.2%) | 8 (7.9%) |
| 10 to 14 Minutes | 5 (6.2%) | 17 (16.8%) |
| 15 to 19 Minutes | 9 (11.3%) | 29 (28.7%) |
| 20 to 24 Minutes | 12 (15.0%) | 13 (12.9%) |
| 25 to 29 Minutes | 1 (1.3%) | 4 (4.0%) |
| 30 to 34 Minutes | 5 (6.2%) | 0 (0.0%) |
| 35 to 39 Minutes | 0 (0.0%) | 5 (5.0%) |
| 40 to 44 Minutes | 5 (6.2%) | 5 (5.0%) |
| 45 to 59 Minutes | 13 (16.3%) | 12 (11.9%) |
| 60 to 89 Minutes | 5 (6.2%) | 2 (2.0%) |
| 90 or more Minutes | 13 (16.3%) | 6 (5.9%) |
Time of Departure to Work by Sex in Fairchild
The most frequent times of departure to work in Fairchild are 4:00 PM to 11:59 PM (18, 22.5%) for males and 6:30 AM to 6:59 AM (15, 14.8%) for females.
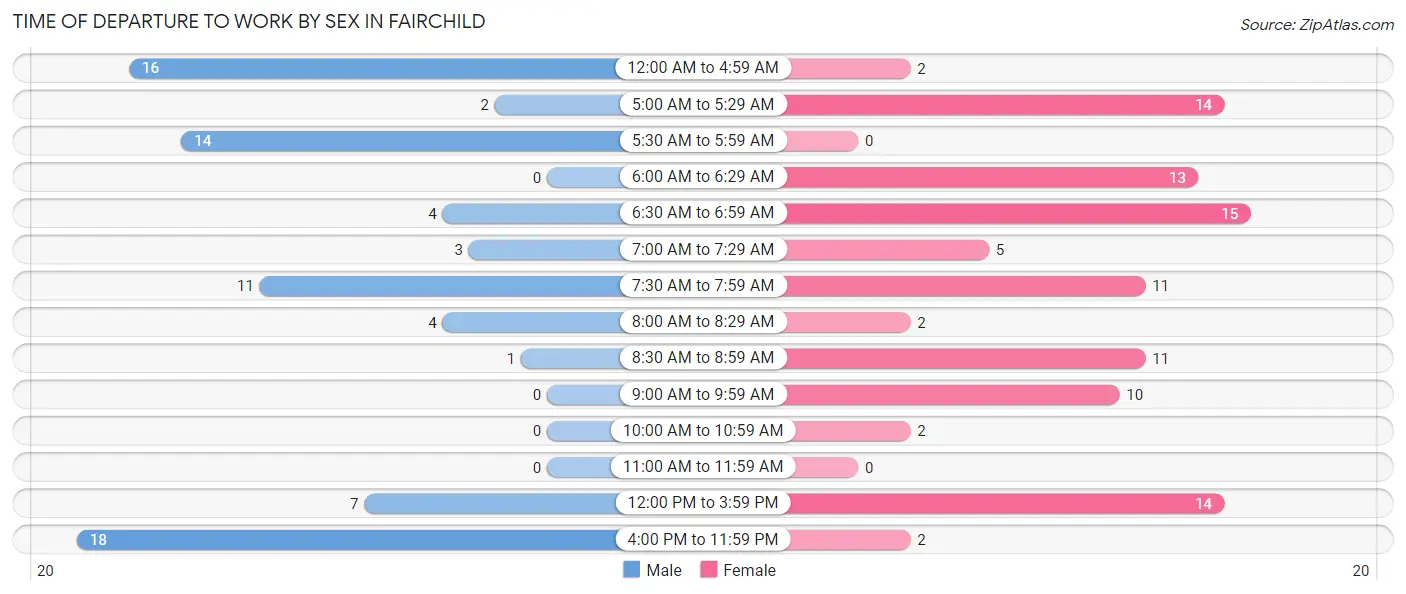
| Time of Departure | Male | Female |
| 12:00 AM to 4:59 AM | 16 (20.0%) | 2 (2.0%) |
| 5:00 AM to 5:29 AM | 2 (2.5%) | 14 (13.9%) |
| 5:30 AM to 5:59 AM | 14 (17.5%) | 0 (0.0%) |
| 6:00 AM to 6:29 AM | 0 (0.0%) | 13 (12.9%) |
| 6:30 AM to 6:59 AM | 4 (5.0%) | 15 (14.8%) |
| 7:00 AM to 7:29 AM | 3 (3.7%) | 5 (5.0%) |
| 7:30 AM to 7:59 AM | 11 (13.8%) | 11 (10.9%) |
| 8:00 AM to 8:29 AM | 4 (5.0%) | 2 (2.0%) |
| 8:30 AM to 8:59 AM | 1 (1.3%) | 11 (10.9%) |
| 9:00 AM to 9:59 AM | 0 (0.0%) | 10 (9.9%) |
| 10:00 AM to 10:59 AM | 0 (0.0%) | 2 (2.0%) |
| 11:00 AM to 11:59 AM | 0 (0.0%) | 0 (0.0%) |
| 12:00 PM to 3:59 PM | 7 (8.7%) | 14 (13.9%) |
| 4:00 PM to 11:59 PM | 18 (22.5%) | 2 (2.0%) |
| Total | 80 (100.0%) | 101 (100.0%) |
Housing Occupancy in Fairchild
Occupancy by Ownership in Fairchild
Of the total 220 dwellings in Fairchild, owner-occupied units account for 159 (72.3%), while renter-occupied units make up 61 (27.7%).
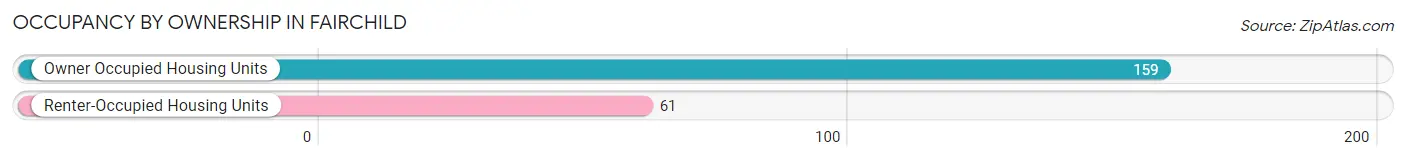
| Occupancy | # Housing Units | % Housing Units |
| Owner Occupied Housing Units | 159 | 72.3% |
| Renter-Occupied Housing Units | 61 | 27.7% |
| Total Occupied Housing Units | 220 | 100.0% |
Occupancy by Household Size in Fairchild
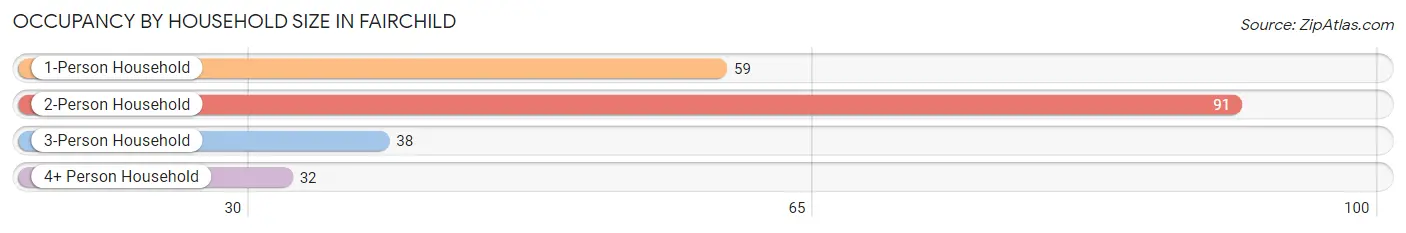
| Household Size | # Housing Units | % Housing Units |
| 1-Person Household | 59 | 26.8% |
| 2-Person Household | 91 | 41.4% |
| 3-Person Household | 38 | 17.3% |
| 4+ Person Household | 32 | 14.5% |
| Total Housing Units | 220 | 100.0% |
Occupancy by Ownership by Household Size in Fairchild
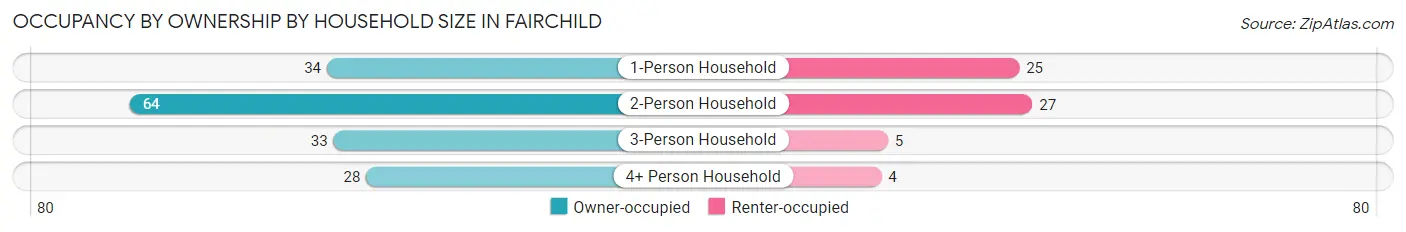
| Household Size | Owner-occupied | Renter-occupied |
| 1-Person Household | 34 (57.6%) | 25 (42.4%) |
| 2-Person Household | 64 (70.3%) | 27 (29.7%) |
| 3-Person Household | 33 (86.8%) | 5 (13.2%) |
| 4+ Person Household | 28 (87.5%) | 4 (12.5%) |
| Total Housing Units | 159 (72.3%) | 61 (27.7%) |
Occupancy by Educational Attainment in Fairchild
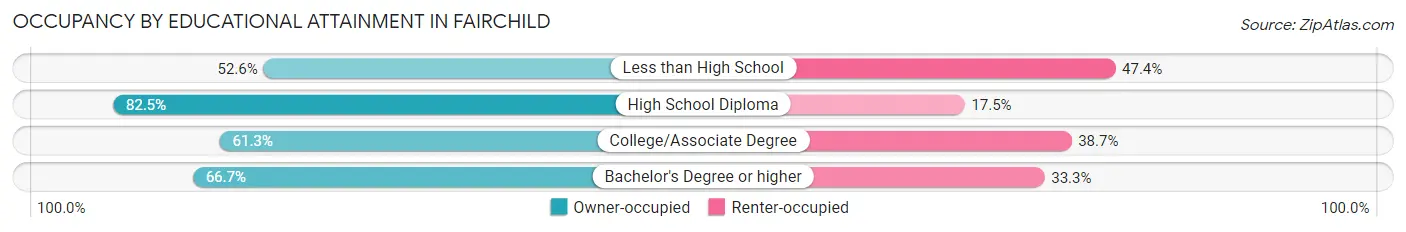
| Household Size | Owner-occupied | Renter-occupied |
| Less than High School | 10 (52.6%) | 9 (47.4%) |
| High School Diploma | 99 (82.5%) | 21 (17.5%) |
| College/Associate Degree | 46 (61.3%) | 29 (38.7%) |
| Bachelor's Degree or higher | 4 (66.7%) | 2 (33.3%) |
Occupancy by Age of Householder in Fairchild
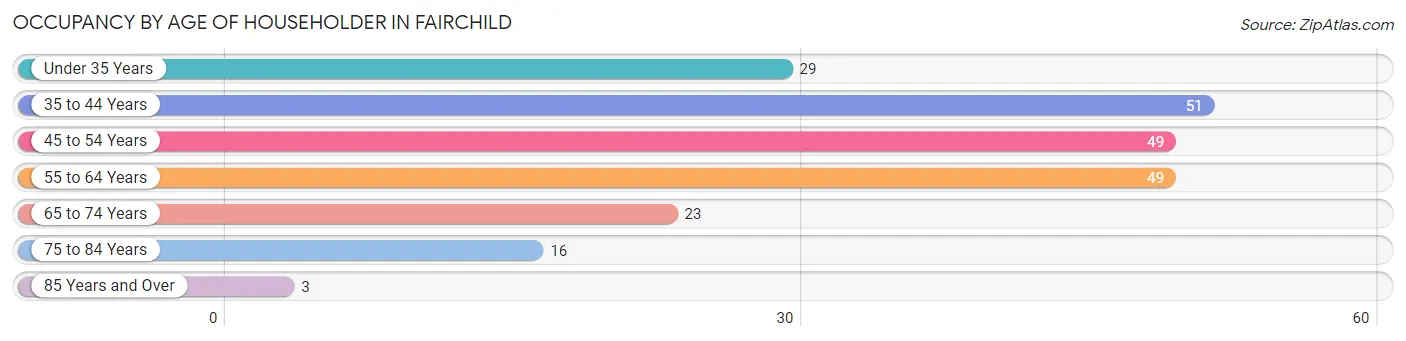
| Age Bracket | # Households | % Households |
| Under 35 Years | 29 | 13.2% |
| 35 to 44 Years | 51 | 23.2% |
| 45 to 54 Years | 49 | 22.3% |
| 55 to 64 Years | 49 | 22.3% |
| 65 to 74 Years | 23 | 10.4% |
| 75 to 84 Years | 16 | 7.3% |
| 85 Years and Over | 3 | 1.4% |
| Total | 220 | 100.0% |
Housing Finances in Fairchild
Median Income by Occupancy in Fairchild
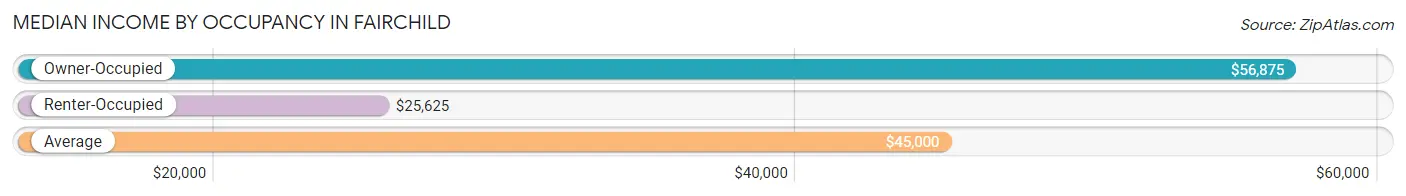
| Occupancy Type | # Households | Median Income |
| Owner-Occupied | 159 (72.3%) | $56,875 |
| Renter-Occupied | 61 (27.7%) | $25,625 |
| Average | 220 (100.0%) | $45,000 |
Occupancy by Householder Income Bracket in Fairchild
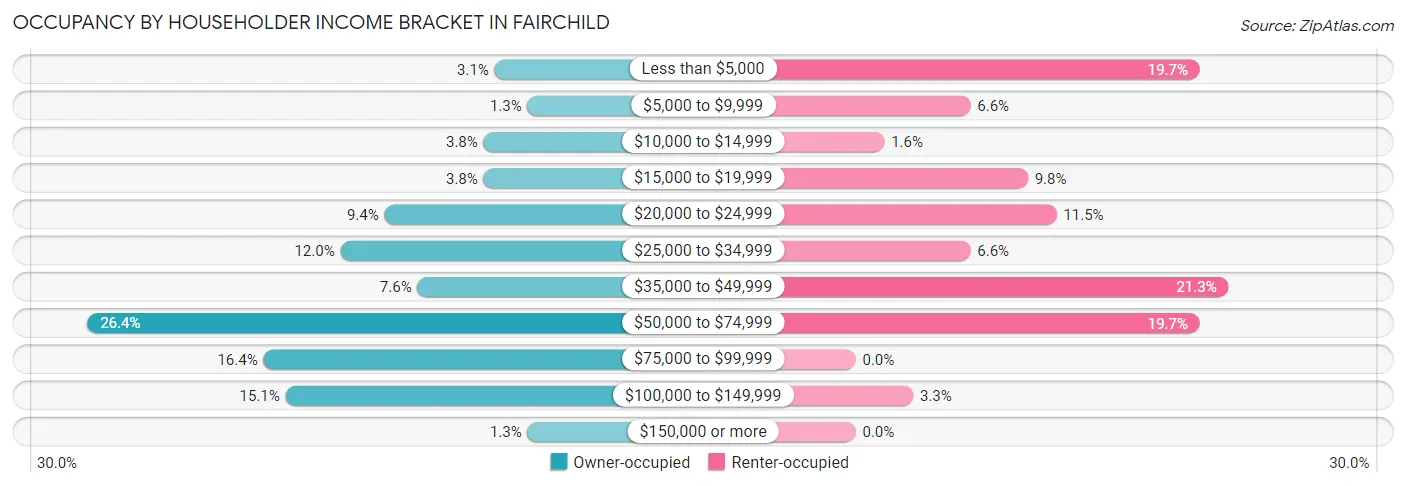
| Income Bracket | Owner-occupied | Renter-occupied |
| Less than $5,000 | 5 (3.1%) | 12 (19.7%) |
| $5,000 to $9,999 | 2 (1.3%) | 4 (6.6%) |
| $10,000 to $14,999 | 6 (3.8%) | 1 (1.6%) |
| $15,000 to $19,999 | 6 (3.8%) | 6 (9.8%) |
| $20,000 to $24,999 | 15 (9.4%) | 7 (11.5%) |
| $25,000 to $34,999 | 19 (11.9%) | 4 (6.6%) |
| $35,000 to $49,999 | 12 (7.5%) | 13 (21.3%) |
| $50,000 to $74,999 | 42 (26.4%) | 12 (19.7%) |
| $75,000 to $99,999 | 26 (16.4%) | 0 (0.0%) |
| $100,000 to $149,999 | 24 (15.1%) | 2 (3.3%) |
| $150,000 or more | 2 (1.3%) | 0 (0.0%) |
| Total | 159 (100.0%) | 61 (100.0%) |
Monthly Housing Cost Tiers in Fairchild
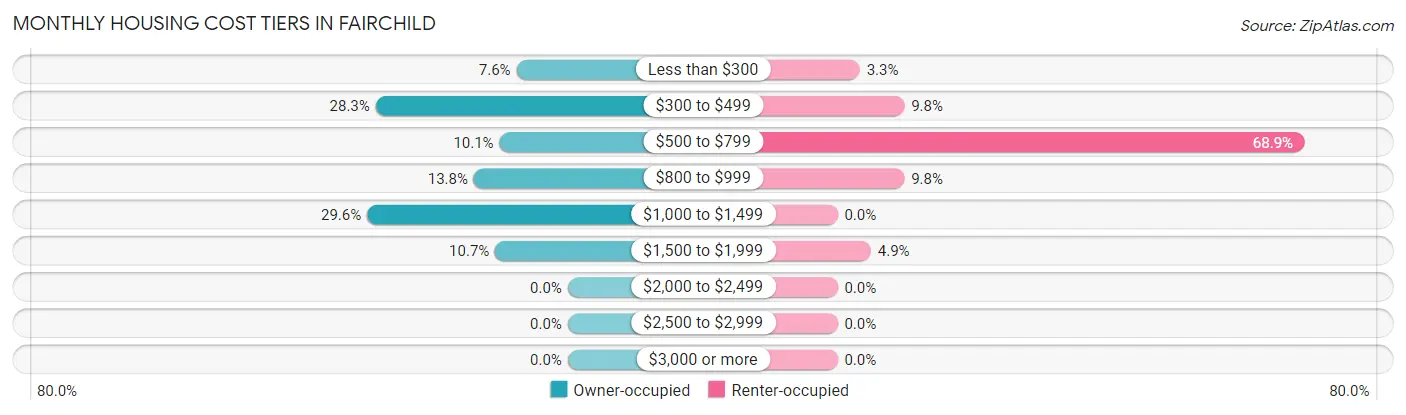
| Monthly Cost | Owner-occupied | Renter-occupied |
| Less than $300 | 12 (7.5%) | 2 (3.3%) |
| $300 to $499 | 45 (28.3%) | 6 (9.8%) |
| $500 to $799 | 16 (10.1%) | 42 (68.9%) |
| $800 to $999 | 22 (13.8%) | 6 (9.8%) |
| $1,000 to $1,499 | 47 (29.6%) | 0 (0.0%) |
| $1,500 to $1,999 | 17 (10.7%) | 3 (4.9%) |
| $2,000 to $2,499 | 0 (0.0%) | 0 (0.0%) |
| $2,500 to $2,999 | 0 (0.0%) | 0 (0.0%) |
| $3,000 or more | 0 (0.0%) | 0 (0.0%) |
| Total | 159 (100.0%) | 61 (100.0%) |
Physical Housing Characteristics in Fairchild
Housing Structures in Fairchild
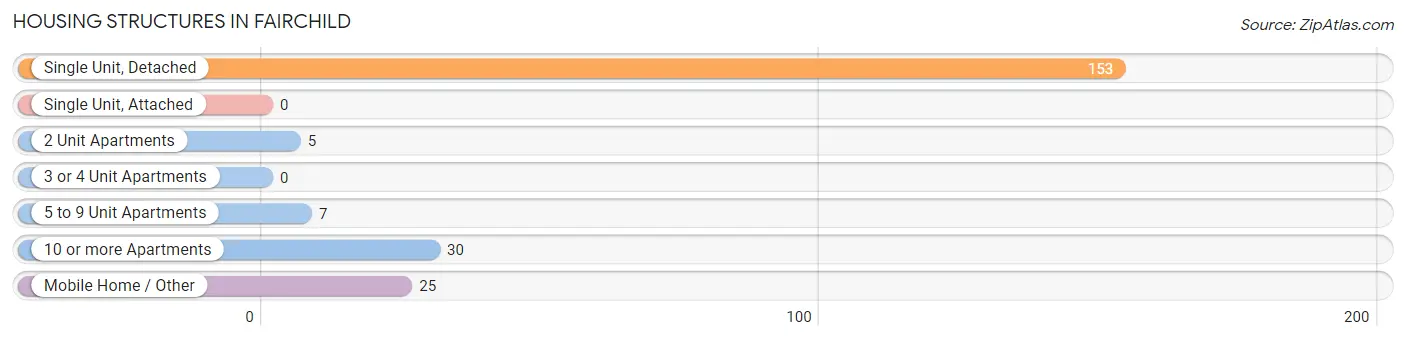
| Structure Type | # Housing Units | % Housing Units |
| Single Unit, Detached | 153 | 69.6% |
| Single Unit, Attached | 0 | 0.0% |
| 2 Unit Apartments | 5 | 2.3% |
| 3 or 4 Unit Apartments | 0 | 0.0% |
| 5 to 9 Unit Apartments | 7 | 3.2% |
| 10 or more Apartments | 30 | 13.6% |
| Mobile Home / Other | 25 | 11.4% |
| Total | 220 | 100.0% |
Housing Structures by Occupancy in Fairchild
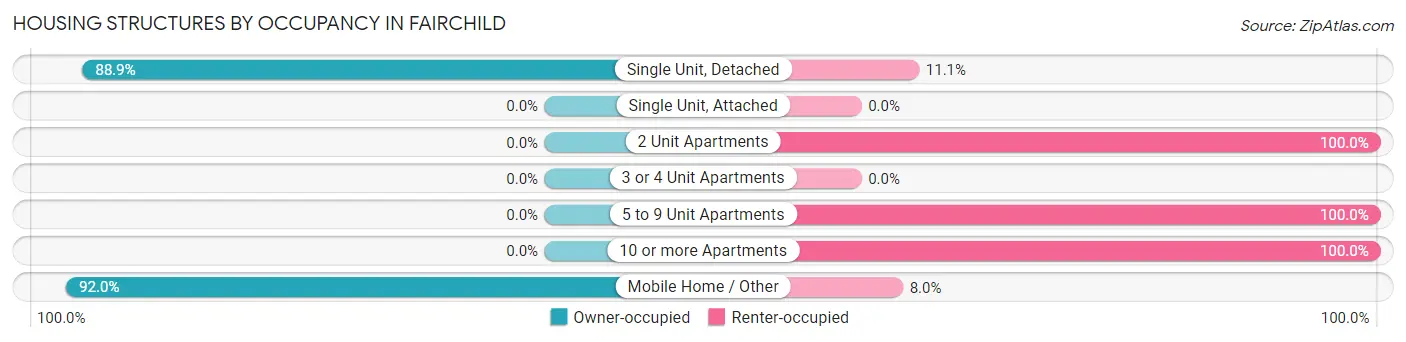
| Structure Type | Owner-occupied | Renter-occupied |
| Single Unit, Detached | 136 (88.9%) | 17 (11.1%) |
| Single Unit, Attached | 0 (0.0%) | 0 (0.0%) |
| 2 Unit Apartments | 0 (0.0%) | 5 (100.0%) |
| 3 or 4 Unit Apartments | 0 (0.0%) | 0 (0.0%) |
| 5 to 9 Unit Apartments | 0 (0.0%) | 7 (100.0%) |
| 10 or more Apartments | 0 (0.0%) | 30 (100.0%) |
| Mobile Home / Other | 23 (92.0%) | 2 (8.0%) |
| Total | 159 (72.3%) | 61 (27.7%) |
Housing Structures by Number of Rooms in Fairchild
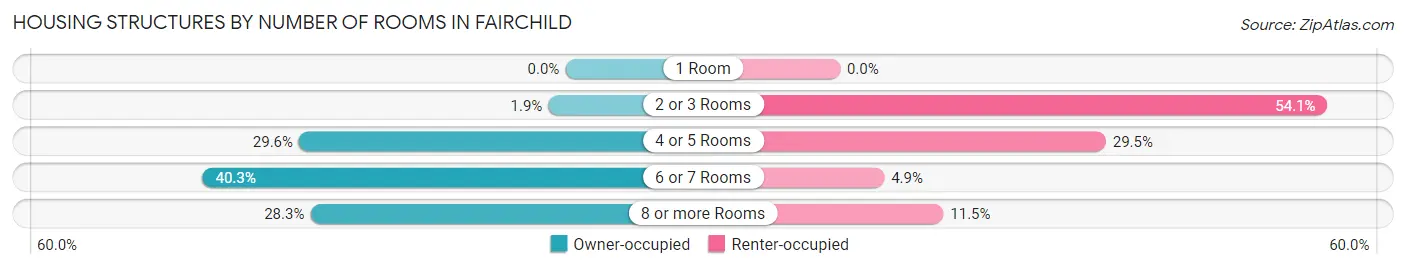
| Number of Rooms | Owner-occupied | Renter-occupied |
| 1 Room | 0 (0.0%) | 0 (0.0%) |
| 2 or 3 Rooms | 3 (1.9%) | 33 (54.1%) |
| 4 or 5 Rooms | 47 (29.6%) | 18 (29.5%) |
| 6 or 7 Rooms | 64 (40.3%) | 3 (4.9%) |
| 8 or more Rooms | 45 (28.3%) | 7 (11.5%) |
| Total | 159 (100.0%) | 61 (100.0%) |
Housing Structure by Heating Type in Fairchild
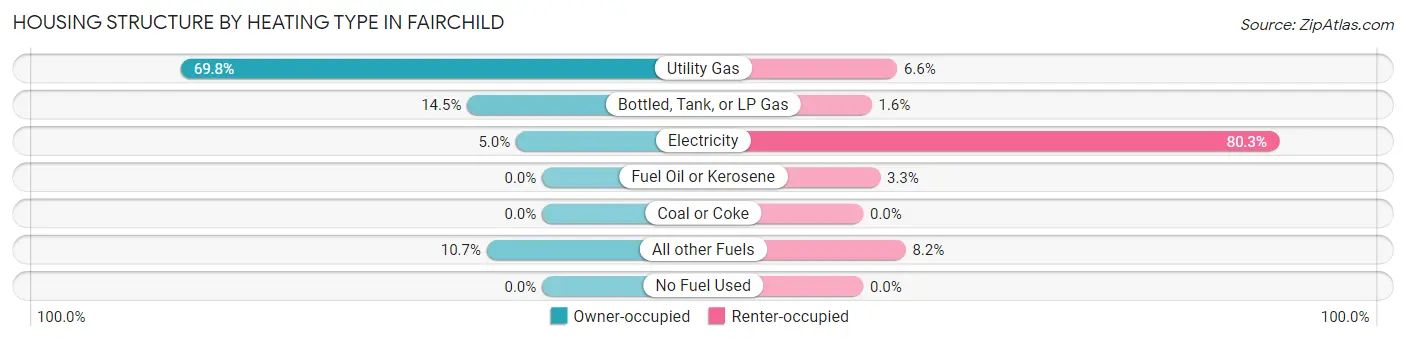
| Heating Type | Owner-occupied | Renter-occupied |
| Utility Gas | 111 (69.8%) | 4 (6.6%) |
| Bottled, Tank, or LP Gas | 23 (14.5%) | 1 (1.6%) |
| Electricity | 8 (5.0%) | 49 (80.3%) |
| Fuel Oil or Kerosene | 0 (0.0%) | 2 (3.3%) |
| Coal or Coke | 0 (0.0%) | 0 (0.0%) |
| All other Fuels | 17 (10.7%) | 5 (8.2%) |
| No Fuel Used | 0 (0.0%) | 0 (0.0%) |
| Total | 159 (100.0%) | 61 (100.0%) |
Household Vehicle Usage in Fairchild
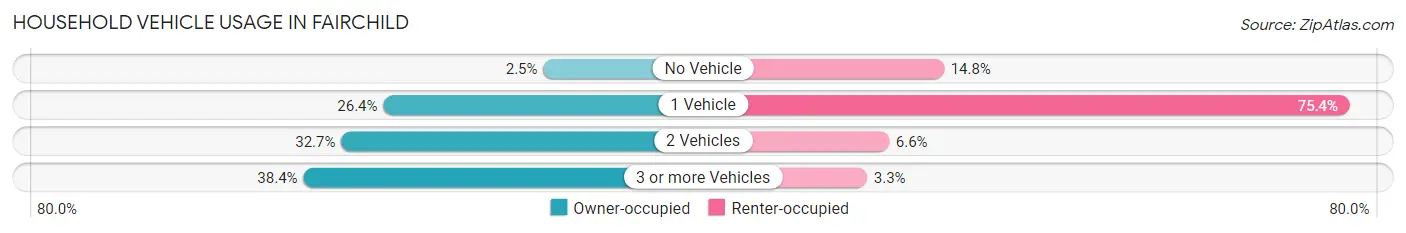
| Vehicles per Household | Owner-occupied | Renter-occupied |
| No Vehicle | 4 (2.5%) | 9 (14.7%) |
| 1 Vehicle | 42 (26.4%) | 46 (75.4%) |
| 2 Vehicles | 52 (32.7%) | 4 (6.6%) |
| 3 or more Vehicles | 61 (38.4%) | 2 (3.3%) |
| Total | 159 (100.0%) | 61 (100.0%) |
Real Estate & Mortgages in Fairchild
Real Estate and Mortgage Overview in Fairchild
| Characteristic | Without Mortgage | With Mortgage |
| Housing Units | 70 | 89 |
| Median Property Value | $37,500 | $104,300 |
| Median Household Income | $52,000 | $2 |
| Monthly Housing Costs | $343 | $0 |
| Real Estate Taxes | $737 | $0 |
Property Value by Mortgage Status in Fairchild
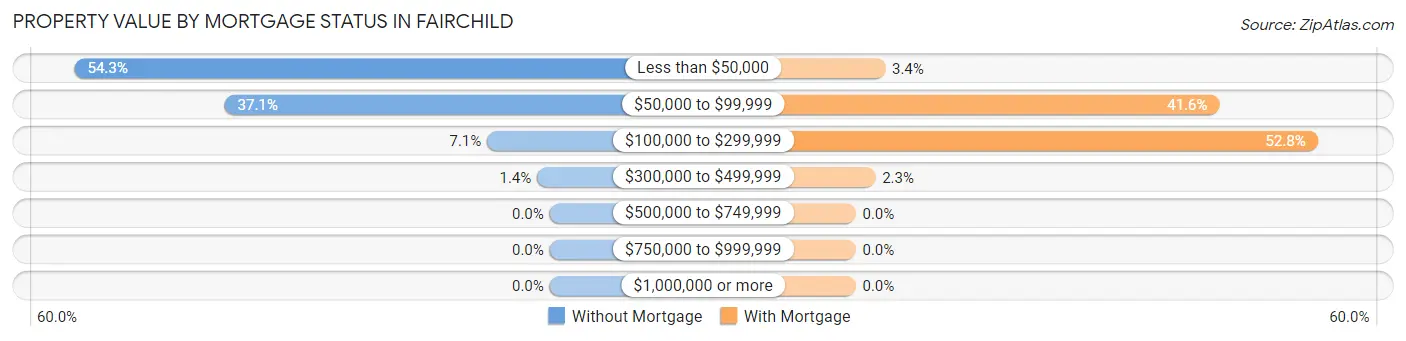
| Property Value | Without Mortgage | With Mortgage |
| Less than $50,000 | 38 (54.3%) | 3 (3.4%) |
| $50,000 to $99,999 | 26 (37.1%) | 37 (41.6%) |
| $100,000 to $299,999 | 5 (7.1%) | 47 (52.8%) |
| $300,000 to $499,999 | 1 (1.4%) | 2 (2.2%) |
| $500,000 to $749,999 | 0 (0.0%) | 0 (0.0%) |
| $750,000 to $999,999 | 0 (0.0%) | 0 (0.0%) |
| $1,000,000 or more | 0 (0.0%) | 0 (0.0%) |
| Total | 70 (100.0%) | 89 (100.0%) |
Household Income by Mortgage Status in Fairchild
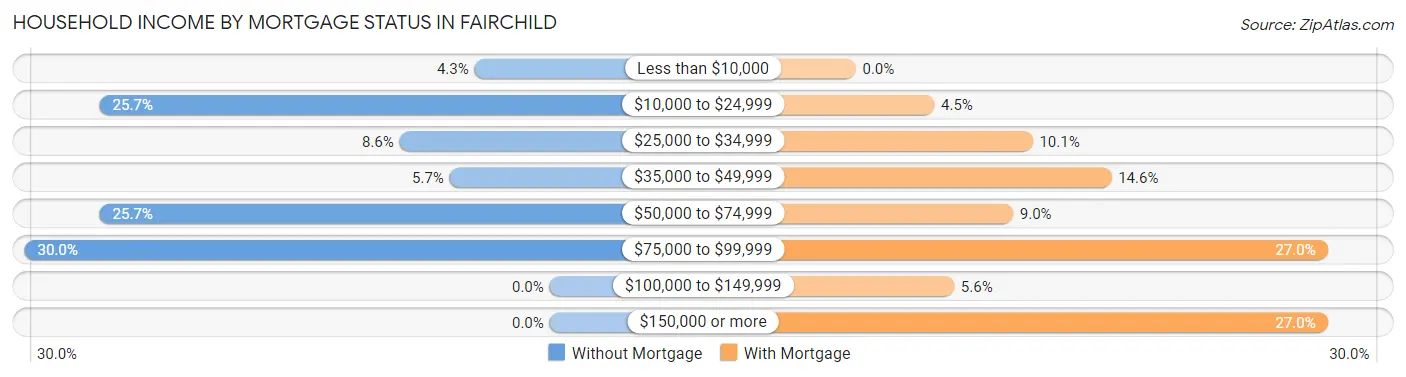
| Household Income | Without Mortgage | With Mortgage |
| Less than $10,000 | 3 (4.3%) | 0 (0.0%) |
| $10,000 to $24,999 | 18 (25.7%) | 4 (4.5%) |
| $25,000 to $34,999 | 6 (8.6%) | 9 (10.1%) |
| $35,000 to $49,999 | 4 (5.7%) | 13 (14.6%) |
| $50,000 to $74,999 | 18 (25.7%) | 8 (9.0%) |
| $75,000 to $99,999 | 21 (30.0%) | 24 (27.0%) |
| $100,000 to $149,999 | 0 (0.0%) | 5 (5.6%) |
| $150,000 or more | 0 (0.0%) | 24 (27.0%) |
| Total | 70 (100.0%) | 89 (100.0%) |
Property Value to Household Income Ratio in Fairchild
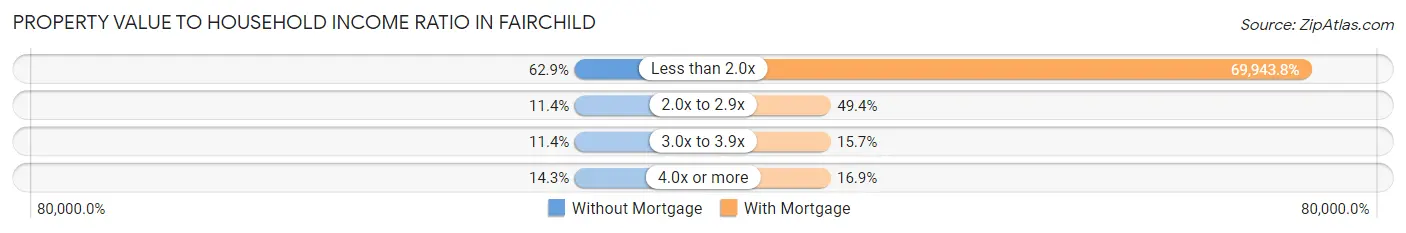
| Value-to-Income Ratio | Without Mortgage | With Mortgage |
| Less than 2.0x | 44 (62.9%) | 62,250 (69,943.8%) |
| 2.0x to 2.9x | 8 (11.4%) | 44 (49.4%) |
| 3.0x to 3.9x | 8 (11.4%) | 14 (15.7%) |
| 4.0x or more | 10 (14.3%) | 15 (16.9%) |
| Total | 70 (100.0%) | 89 (100.0%) |
Real Estate Taxes by Mortgage Status in Fairchild
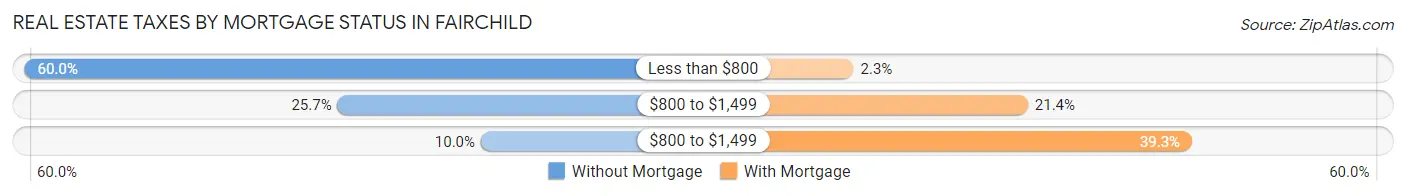
| Property Taxes | Without Mortgage | With Mortgage |
| Less than $800 | 42 (60.0%) | 2 (2.2%) |
| $800 to $1,499 | 18 (25.7%) | 19 (21.3%) |
| $800 to $1,499 | 7 (10.0%) | 35 (39.3%) |
| Total | 70 (100.0%) | 89 (100.0%) |
Health & Disability in Fairchild
Health Insurance Coverage by Age in Fairchild
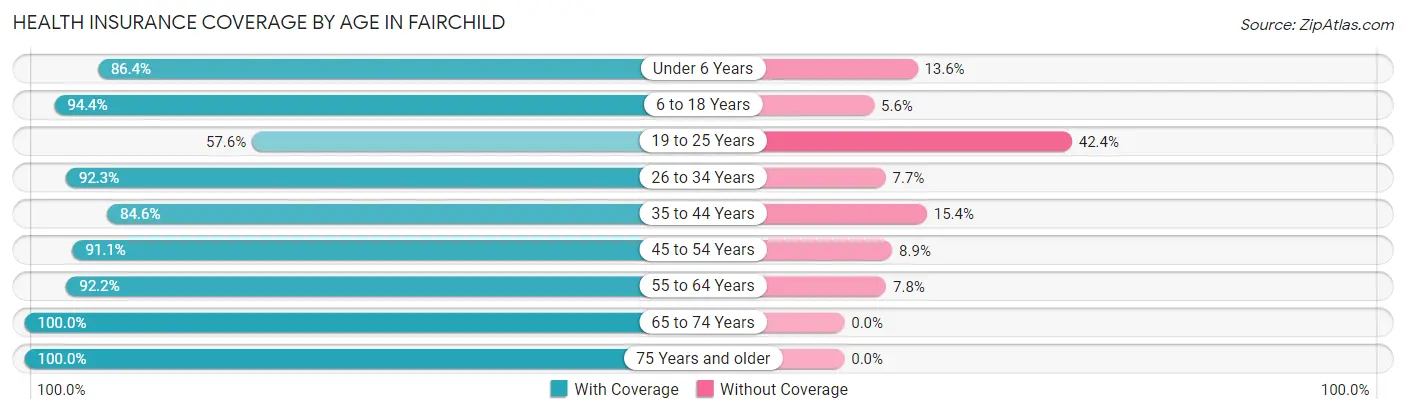
| Age Bracket | With Coverage | Without Coverage |
| Under 6 Years | 19 (86.4%) | 3 (13.6%) |
| 6 to 18 Years | 85 (94.4%) | 5 (5.6%) |
| 19 to 25 Years | 19 (57.6%) | 14 (42.4%) |
| 26 to 34 Years | 48 (92.3%) | 4 (7.7%) |
| 35 to 44 Years | 55 (84.6%) | 10 (15.4%) |
| 45 to 54 Years | 102 (91.1%) | 10 (8.9%) |
| 55 to 64 Years | 71 (92.2%) | 6 (7.8%) |
| 65 to 74 Years | 28 (100.0%) | 0 (0.0%) |
| 75 Years and older | 26 (100.0%) | 0 (0.0%) |
| Total | 453 (89.7%) | 52 (10.3%) |
Health Insurance Coverage by Citizenship Status in Fairchild
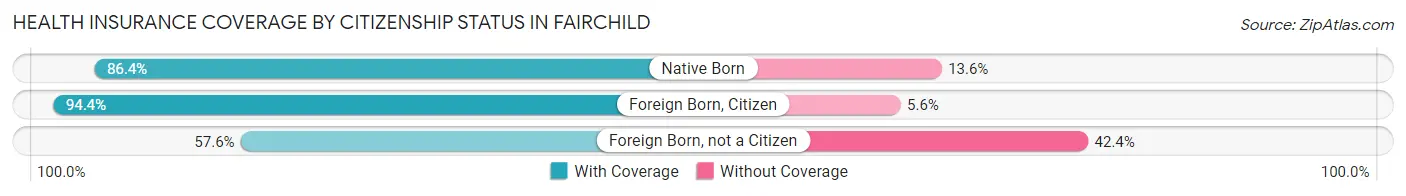
| Citizenship Status | With Coverage | Without Coverage |
| Native Born | 19 (86.4%) | 3 (13.6%) |
| Foreign Born, Citizen | 85 (94.4%) | 5 (5.6%) |
| Foreign Born, not a Citizen | 19 (57.6%) | 14 (42.4%) |
Health Insurance Coverage by Household Income in Fairchild
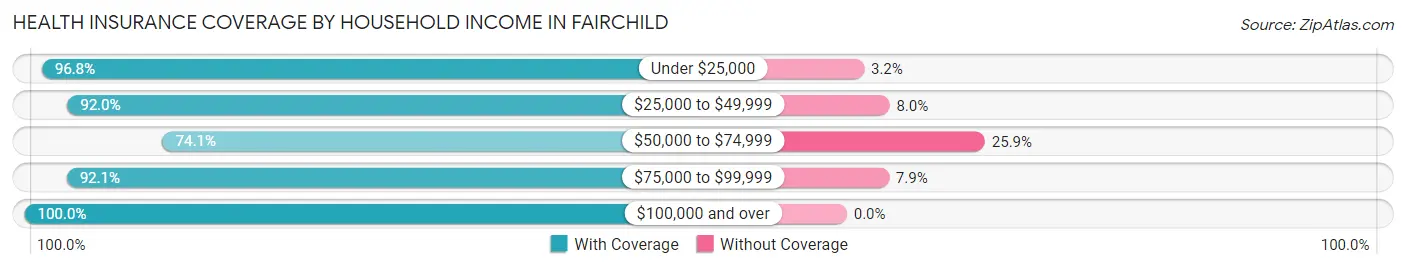
| Household Income | With Coverage | Without Coverage |
| Under $25,000 | 120 (96.8%) | 4 (3.2%) |
| $25,000 to $49,999 | 92 (92.0%) | 8 (8.0%) |
| $50,000 to $74,999 | 106 (74.1%) | 37 (25.9%) |
| $75,000 to $99,999 | 35 (92.1%) | 3 (7.9%) |
| $100,000 and over | 100 (100.0%) | 0 (0.0%) |
Public vs Private Health Insurance Coverage by Age in Fairchild
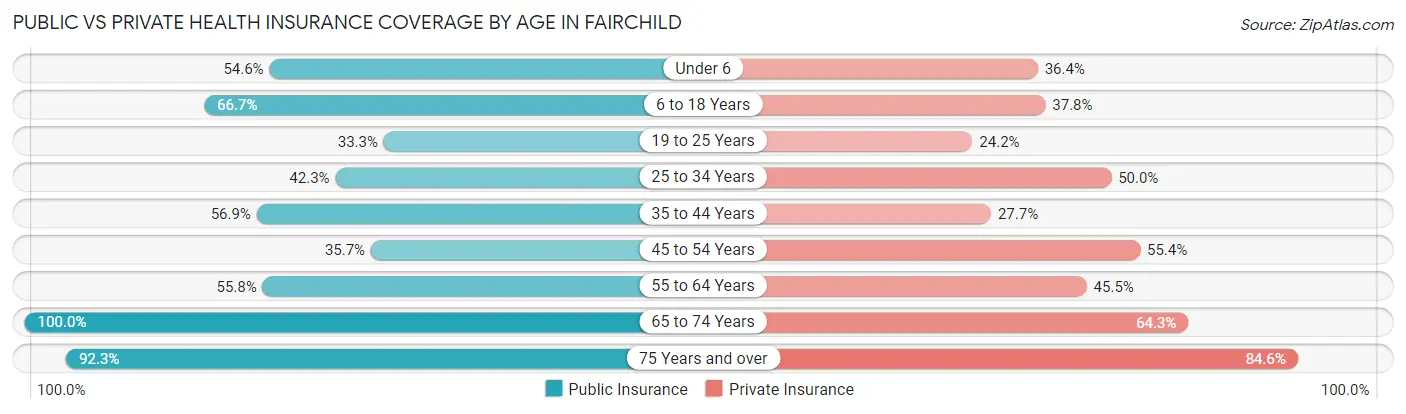
| Age Bracket | Public Insurance | Private Insurance |
| Under 6 | 12 (54.5%) | 8 (36.4%) |
| 6 to 18 Years | 60 (66.7%) | 34 (37.8%) |
| 19 to 25 Years | 11 (33.3%) | 8 (24.2%) |
| 25 to 34 Years | 22 (42.3%) | 26 (50.0%) |
| 35 to 44 Years | 37 (56.9%) | 18 (27.7%) |
| 45 to 54 Years | 40 (35.7%) | 62 (55.4%) |
| 55 to 64 Years | 43 (55.8%) | 35 (45.5%) |
| 65 to 74 Years | 28 (100.0%) | 18 (64.3%) |
| 75 Years and over | 24 (92.3%) | 22 (84.6%) |
| Total | 277 (54.8%) | 231 (45.7%) |
Disability Status by Sex by Age in Fairchild
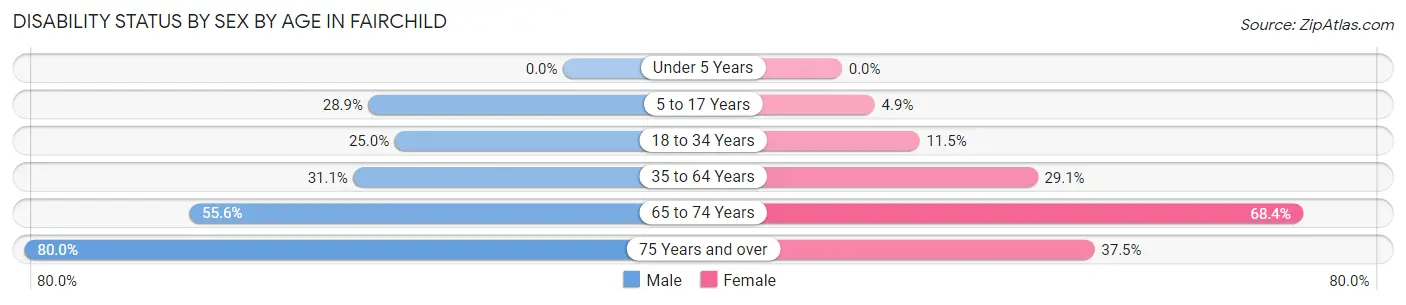
| Age Bracket | Male | Female |
| Under 5 Years | 0 (0.0%) | 0 (0.0%) |
| 5 to 17 Years | 13 (28.9%) | 2 (4.9%) |
| 18 to 34 Years | 12 (25.0%) | 6 (11.5%) |
| 35 to 64 Years | 33 (31.1%) | 43 (29.0%) |
| 65 to 74 Years | 5 (55.6%) | 13 (68.4%) |
| 75 Years and over | 8 (80.0%) | 6 (37.5%) |
Disability Class by Sex by Age in Fairchild
Disability Class: Hearing Difficulty
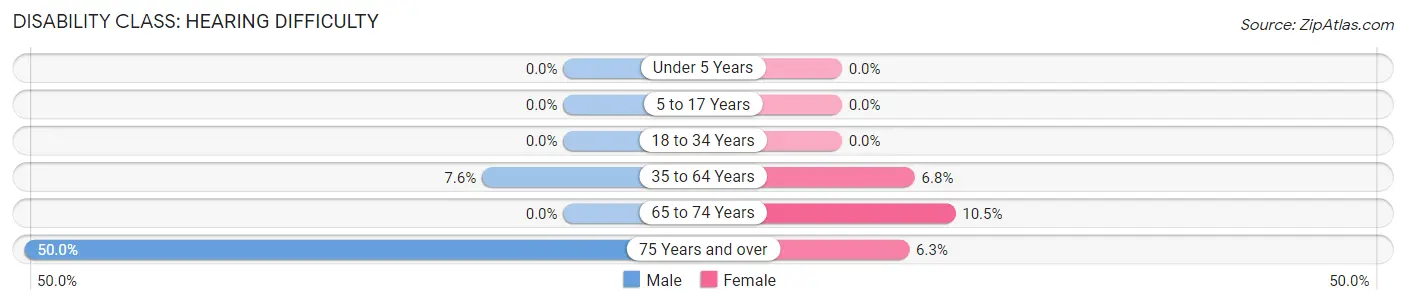
| Age Bracket | Male | Female |
| Under 5 Years | 0 (0.0%) | 0 (0.0%) |
| 5 to 17 Years | 0 (0.0%) | 0 (0.0%) |
| 18 to 34 Years | 0 (0.0%) | 0 (0.0%) |
| 35 to 64 Years | 8 (7.5%) | 10 (6.8%) |
| 65 to 74 Years | 0 (0.0%) | 2 (10.5%) |
| 75 Years and over | 5 (50.0%) | 1 (6.2%) |
Disability Class: Vision Difficulty
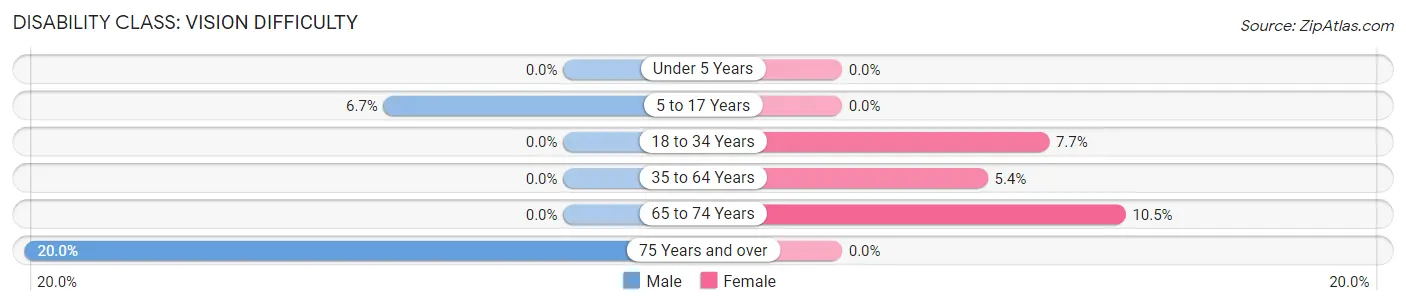
| Age Bracket | Male | Female |
| Under 5 Years | 0 (0.0%) | 0 (0.0%) |
| 5 to 17 Years | 3 (6.7%) | 0 (0.0%) |
| 18 to 34 Years | 0 (0.0%) | 4 (7.7%) |
| 35 to 64 Years | 0 (0.0%) | 8 (5.4%) |
| 65 to 74 Years | 0 (0.0%) | 2 (10.5%) |
| 75 Years and over | 2 (20.0%) | 0 (0.0%) |
Disability Class: Cognitive Difficulty
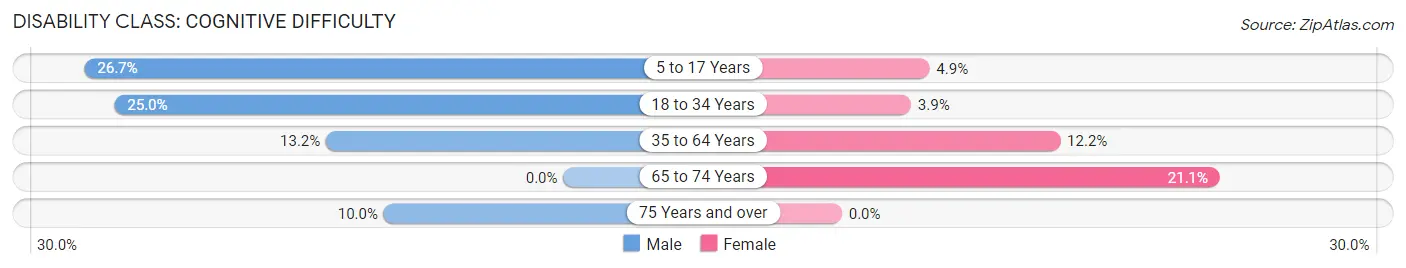
| Age Bracket | Male | Female |
| 5 to 17 Years | 12 (26.7%) | 2 (4.9%) |
| 18 to 34 Years | 12 (25.0%) | 2 (3.8%) |
| 35 to 64 Years | 14 (13.2%) | 18 (12.2%) |
| 65 to 74 Years | 0 (0.0%) | 4 (21.0%) |
| 75 Years and over | 1 (10.0%) | 0 (0.0%) |
Disability Class: Ambulatory Difficulty
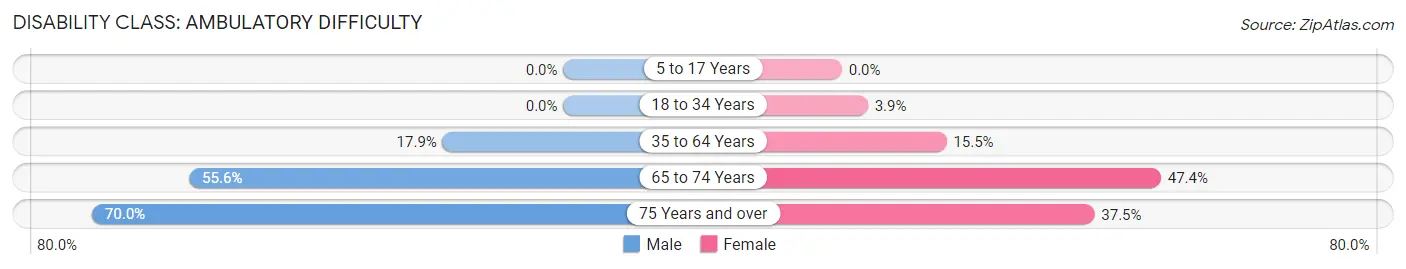
| Age Bracket | Male | Female |
| 5 to 17 Years | 0 (0.0%) | 0 (0.0%) |
| 18 to 34 Years | 0 (0.0%) | 2 (3.8%) |
| 35 to 64 Years | 19 (17.9%) | 23 (15.5%) |
| 65 to 74 Years | 5 (55.6%) | 9 (47.4%) |
| 75 Years and over | 7 (70.0%) | 6 (37.5%) |
Disability Class: Self-Care Difficulty
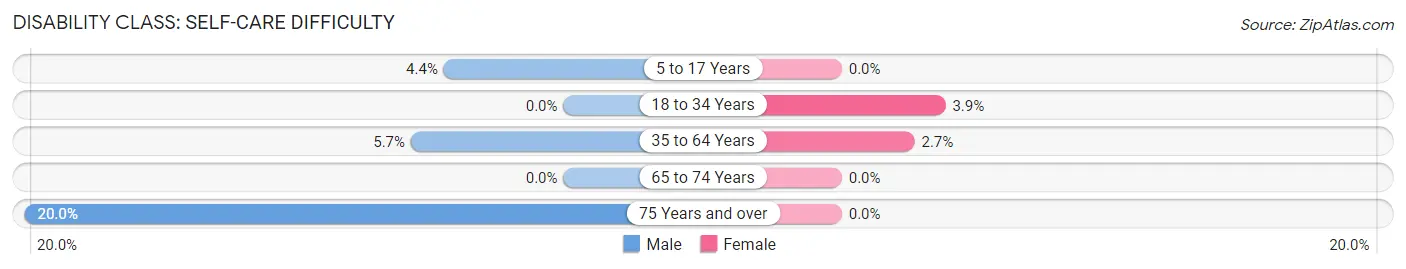
| Age Bracket | Male | Female |
| 5 to 17 Years | 2 (4.4%) | 0 (0.0%) |
| 18 to 34 Years | 0 (0.0%) | 2 (3.8%) |
| 35 to 64 Years | 6 (5.7%) | 4 (2.7%) |
| 65 to 74 Years | 0 (0.0%) | 0 (0.0%) |
| 75 Years and over | 2 (20.0%) | 0 (0.0%) |
Technology Access in Fairchild
Computing Device Access in Fairchild
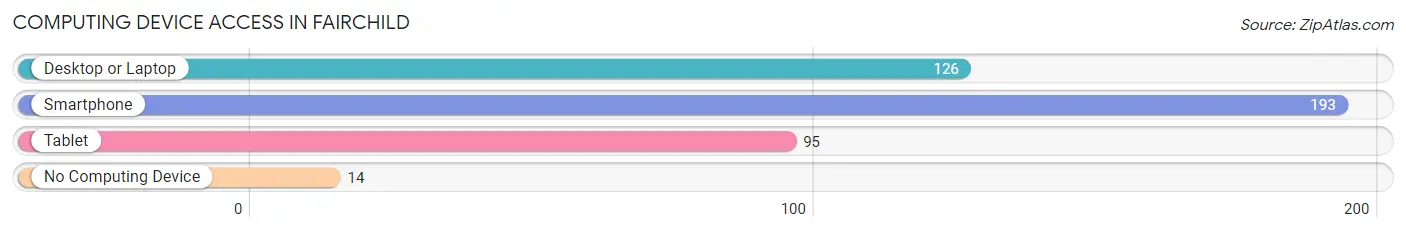
| Device Type | # Households | % Households |
| Desktop or Laptop | 126 | 57.3% |
| Smartphone | 193 | 87.7% |
| Tablet | 95 | 43.2% |
| No Computing Device | 14 | 6.4% |
| Total | 220 | 100.0% |
Internet Access in Fairchild
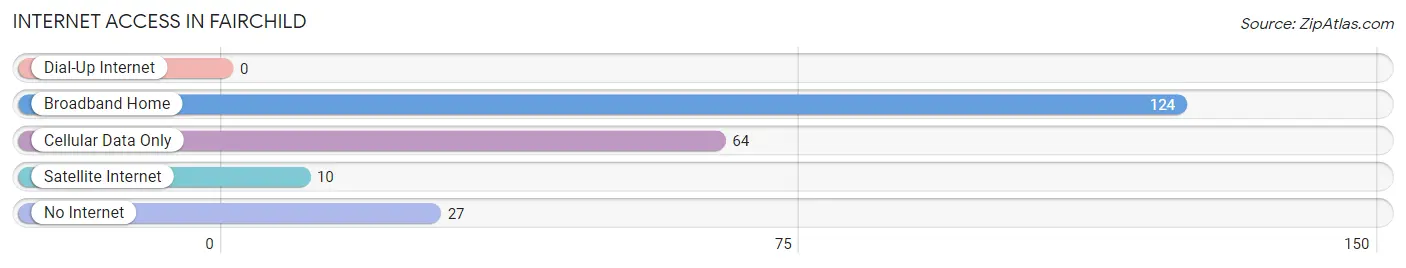
| Internet Type | # Households | % Households |
| Dial-Up Internet | 0 | 0.0% |
| Broadband Home | 124 | 56.4% |
| Cellular Data Only | 64 | 29.1% |
| Satellite Internet | 10 | 4.5% |
| No Internet | 27 | 12.3% |
| Total | 220 | 100.0% |
Fairchild Summary
History
The small town of Fairchild, Wisconsin is located in Eau Claire County, in the western part of the state. It was founded in 1856 by a group of settlers from New York, who were looking for a place to settle and start a new life. The town was named after one of the settlers, William Fairchild, who was a prominent figure in the area.
The town grew slowly but steadily over the years, and by the early 1900s, it had become a thriving community. The town was home to a variety of businesses, including a sawmill, a grist mill, a creamery, a blacksmith shop, and a general store. The town also had a post office, a school, and a church.
In the early 1900s, the town was also home to a number of immigrants, mostly from Germany and Scandinavia. These immigrants brought with them their own culture and traditions, which helped to shape the town’s identity.
In the late 1940s, the town began to experience a period of growth and prosperity. This was due in part to the construction of a new highway, which connected Fairchild to the larger cities of Eau Claire and Chippewa Falls. This new highway allowed for easier access to the larger cities, and it also allowed for the growth of the town’s economy.
In the 1950s, the town experienced a period of decline, as many of the businesses that had been established in the early 1900s began to close. This decline was due in part to the increasing competition from larger cities, as well as the changing economy of the area.
In the late 1970s, the town began to experience a period of revitalization. This was due in part to the construction of a new industrial park, which brought new businesses and jobs to the area. This revitalization also helped to bring new life to the town, as new businesses and residents began to move in.
Today, Fairchild is a small but vibrant community. It is home to a variety of businesses, including a grocery store, a hardware store, a bank, and a variety of restaurants. The town also has a post office, a library, and a number of churches.
Geography
Fairchild is located in the western part of Wisconsin, in Eau Claire County. It is situated on the banks of the Chippewa River, and is surrounded by rolling hills and forests. The town is located about 25 miles east of Eau Claire, and about 40 miles west of Chippewa Falls.
The town has a total area of 1.2 square miles, all of which is land. The town is located at an elevation of 890 feet above sea level.
Economy
The economy of Fairchild is largely based on agriculture and tourism. The town is home to a number of farms, which produce a variety of crops, including corn, soybeans, and hay. The town is also home to a number of tourist attractions, including a golf course, a ski resort, and a number of lakes and rivers.
The town is also home to a number of businesses, including a grocery store, a hardware store, a bank, and a variety of restaurants. The town also has a post office, a library, and a number of churches.
Demographics
As of the 2010 census, the population of Fairchild was 1,093. The town has a total area of 1.2 square miles, all of which is land. The town has a population density of 890 people per square mile.
The racial makeup of the town is 97.7% White, 0.7% African American, 0.2% Native American, 0.2% Asian, 0.1% from other races, and 1.1% from two or more races. Hispanic or Latino of any race were 0.7% of the population.
The median income for a household in the town was $41,250, and the median income for a family was $50,000. The per capita income for the town was $20,945. About 8.3% of families and 10.2% of the population were below the poverty line, including 14.3% of those under age 18 and 6.3% of those age 65 or over.
Common Questions
What is Per Capita Income in Fairchild?
Per Capita income in Fairchild is $24,691.
What is the Median Family Income in Fairchild?
Median Family Income in Fairchild is $50,536.
What is the Median Household income in Fairchild?
Median Household Income in Fairchild is $45,000.
What is Income or Wage Gap in Fairchild?
Income or Wage Gap in Fairchild is 34.8%.
Women in Fairchild earn 65.2 cents for every dollar earned by a man.
What is Inequality or Gini Index in Fairchild?
Inequality or Gini Index in Fairchild is 0.42.
What is the Total Population of Fairchild?
Total Population of Fairchild is 505.
What is the Total Male Population of Fairchild?
Total Male Population of Fairchild is 222.
What is the Total Female Population of Fairchild?
Total Female Population of Fairchild is 283.
What is the Ratio of Males per 100 Females in Fairchild?
There are 78.45 Males per 100 Females in Fairchild.
What is the Ratio of Females per 100 Males in Fairchild?
There are 127.48 Females per 100 Males in Fairchild.
What is the Median Population Age in Fairchild?
Median Population Age in Fairchild is 42.9 Years.
What is the Average Family Size in Fairchild
Average Family Size in Fairchild is 2.6 People.
What is the Average Household Size in Fairchild
Average Household Size in Fairchild is 2.3 People.
How Large is the Labor Force in Fairchild?
There are 246 People in the Labor Forcein in Fairchild.
What is the Percentage of People in the Labor Force in Fairchild?
58.7% of People are in the Labor Force in Fairchild.
What is the Unemployment Rate in Fairchild?
Unemployment Rate in Fairchild is 10.6%.